

Fault Traces on Strike & Dip Seismic Lines
Before seeing some example of fault traces of normal and reverse faults (Figures 104-107), it is important to review thew relationships between the fault traces on transversal sections (field cross-section or seismic lines) and the fault traces on geological maps with a more or less topography (Figure 101-103), as well as the intersection of faults belonging to different fault systems. In fact all areas, lengthened or shortening, can be subdivided in sectors on which the dip and strike of the bedding planes is, more less, homogeneous (lengthened sedimentary areas) or where the axial planes and the axial dips of the compressional structures of the shortened areas is, more or less, constant.
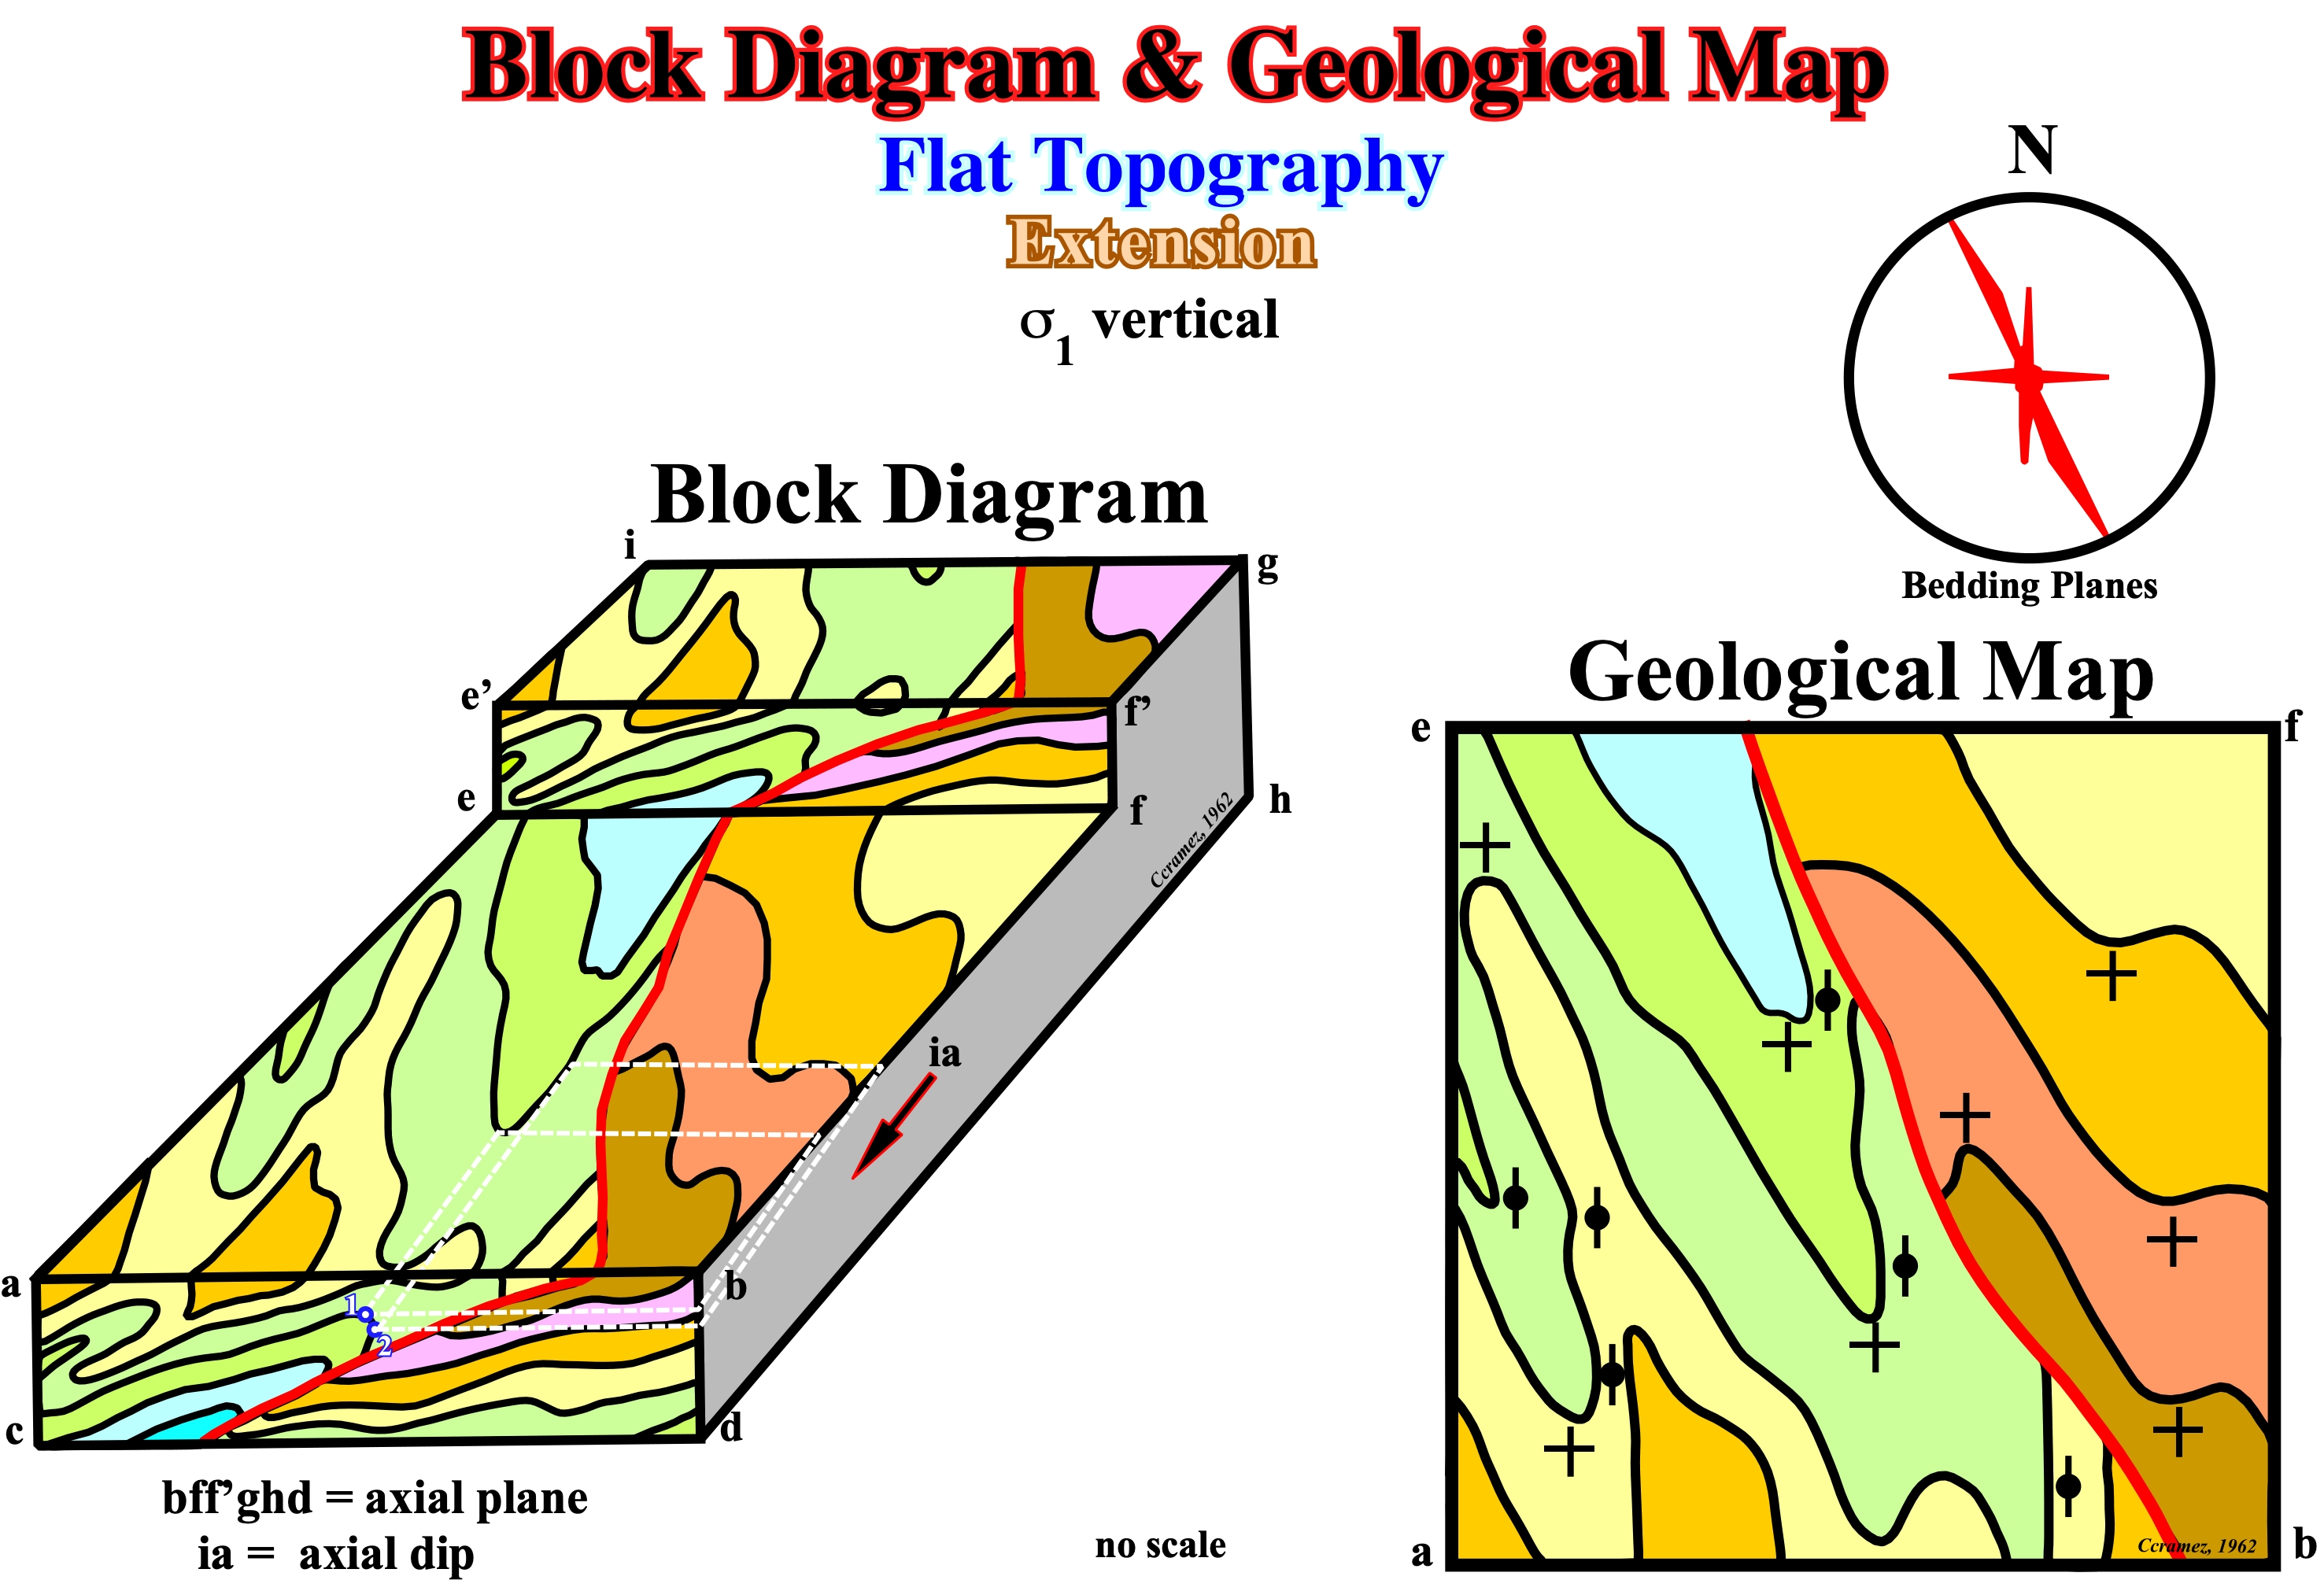
Figure 101- This block diagram summarizes the methodology of 3D seismic interpretation, i.e., the interaction between the cross-sections and geological maps (or between the seismic lines and seismic seiscrops, in the jargon of petroleum geology). Earth scientists responsible for the tentative geological interpretations of seismic data, in order to find the most likely time interpretation without using the intersections of seismic lines, which means they do not use the time plans (seiscrops) to test the profile interpretations or the profiles to test the interpretation of the time plans. On the contrary, many geoscientists use a circular method to justify their interpretations ("Verificationism"). The relationships observed in extensional structures between horizontal surfaces (geological maps without topography, or seiscrops) and transverse (or seismic lines) should also be respected in compressional structures. These relationships are summarized in the block diagram, in which the basic principles of three-dimensional seismic interpretation are illustrated. The direction of the more inclined layers is approximately σ2 and the dip of the less inclined layers gives the axial dip. In an area with horizontal layers, the axial dip of the structures is zero and the direction of the vertical layers is parallel to the axial plane of the structures (perpendicular to σ3 ).
The relationships between the fault traces on a cross-section or on a seismic line and the their traces on a geological map with a flat topography, i.e., avoiding the apparent deformation created by the topography are illustrated on figures 102 and 103.
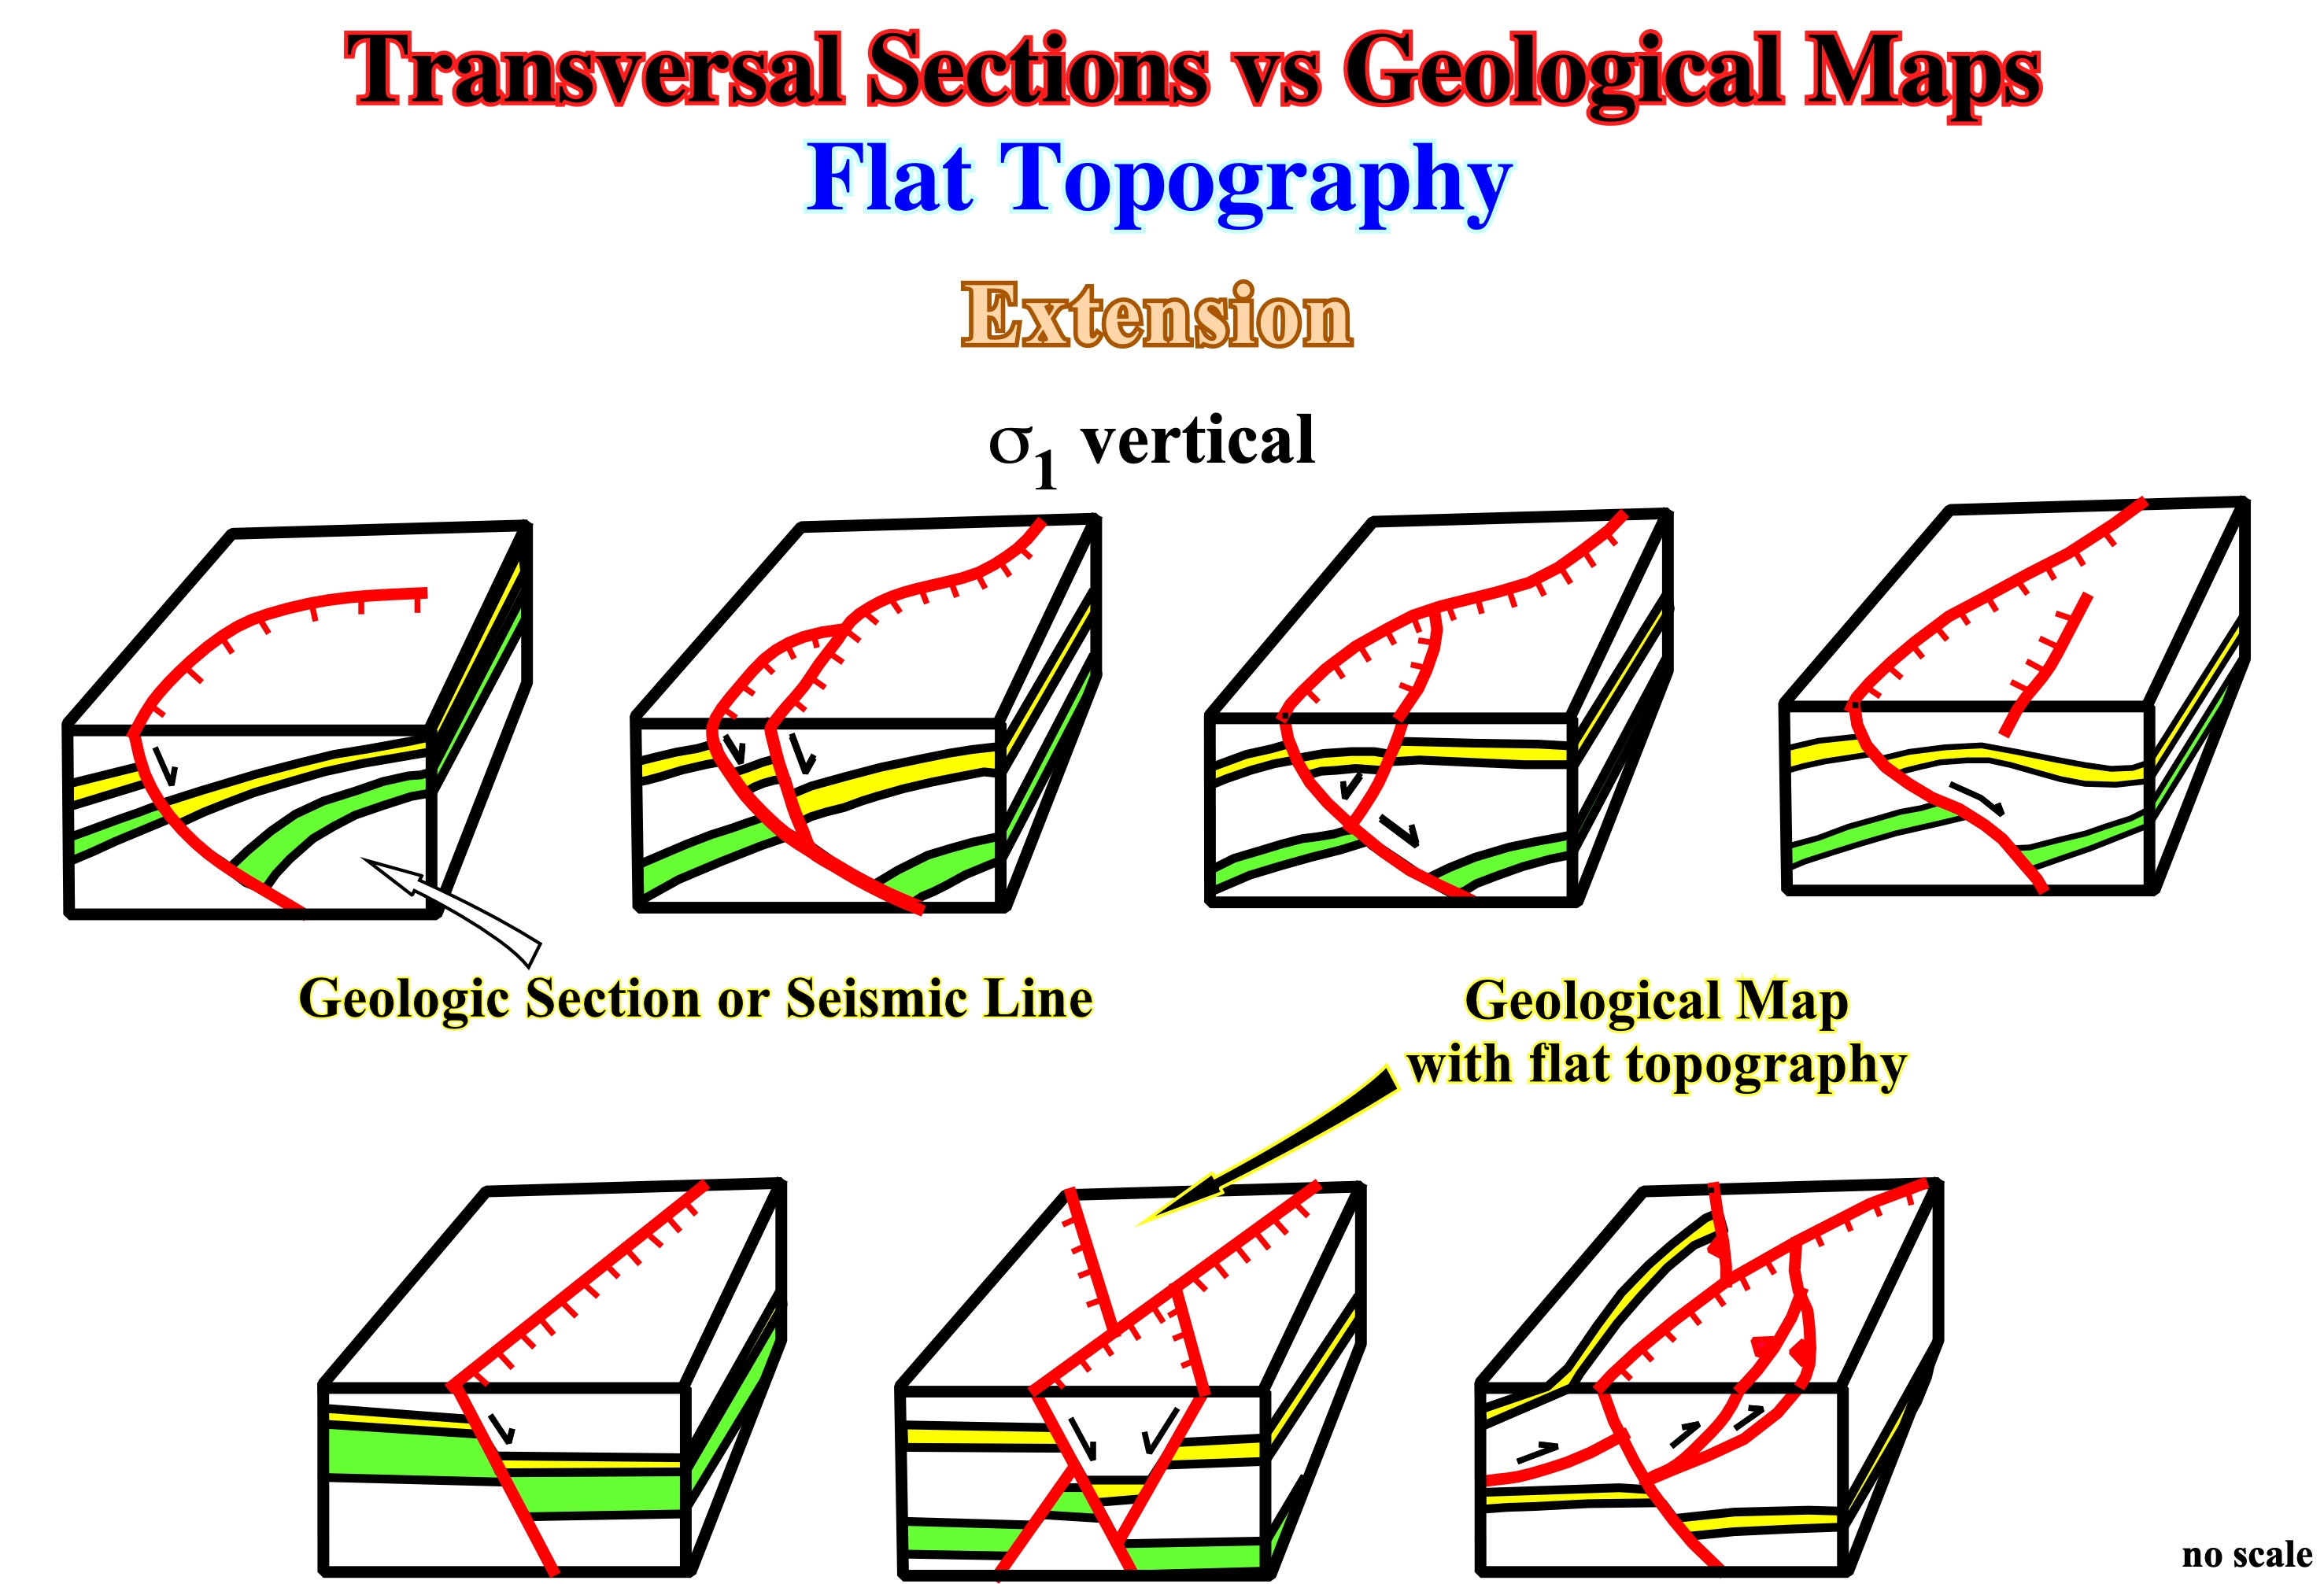
Figure 102- The relations between the eroded surfaces, geological maps or time planes (seiscrops), with a flat topography and the transversal cross-sections or seismic profiles are illustrated on this block diagrams. The geometry in transversal geological sections or seismic lines should be consistent with the geometry visible on the flat surfaces. When a geoscientist recognizes a curvilinear normal fault in a time plane, the fault on a seismic profile, must show, in depth, a downward decreasing dip (the fault plane should flattens in depth). Similarly, when two straight normal faults intersecting, in a flat surface or in a cross-section, the most recent fault displaces the oldest. However, this hypothesis is valid only when the map (top surface) is, without or with a flat topography (as in the two diagrams blocks in the lower right corner).
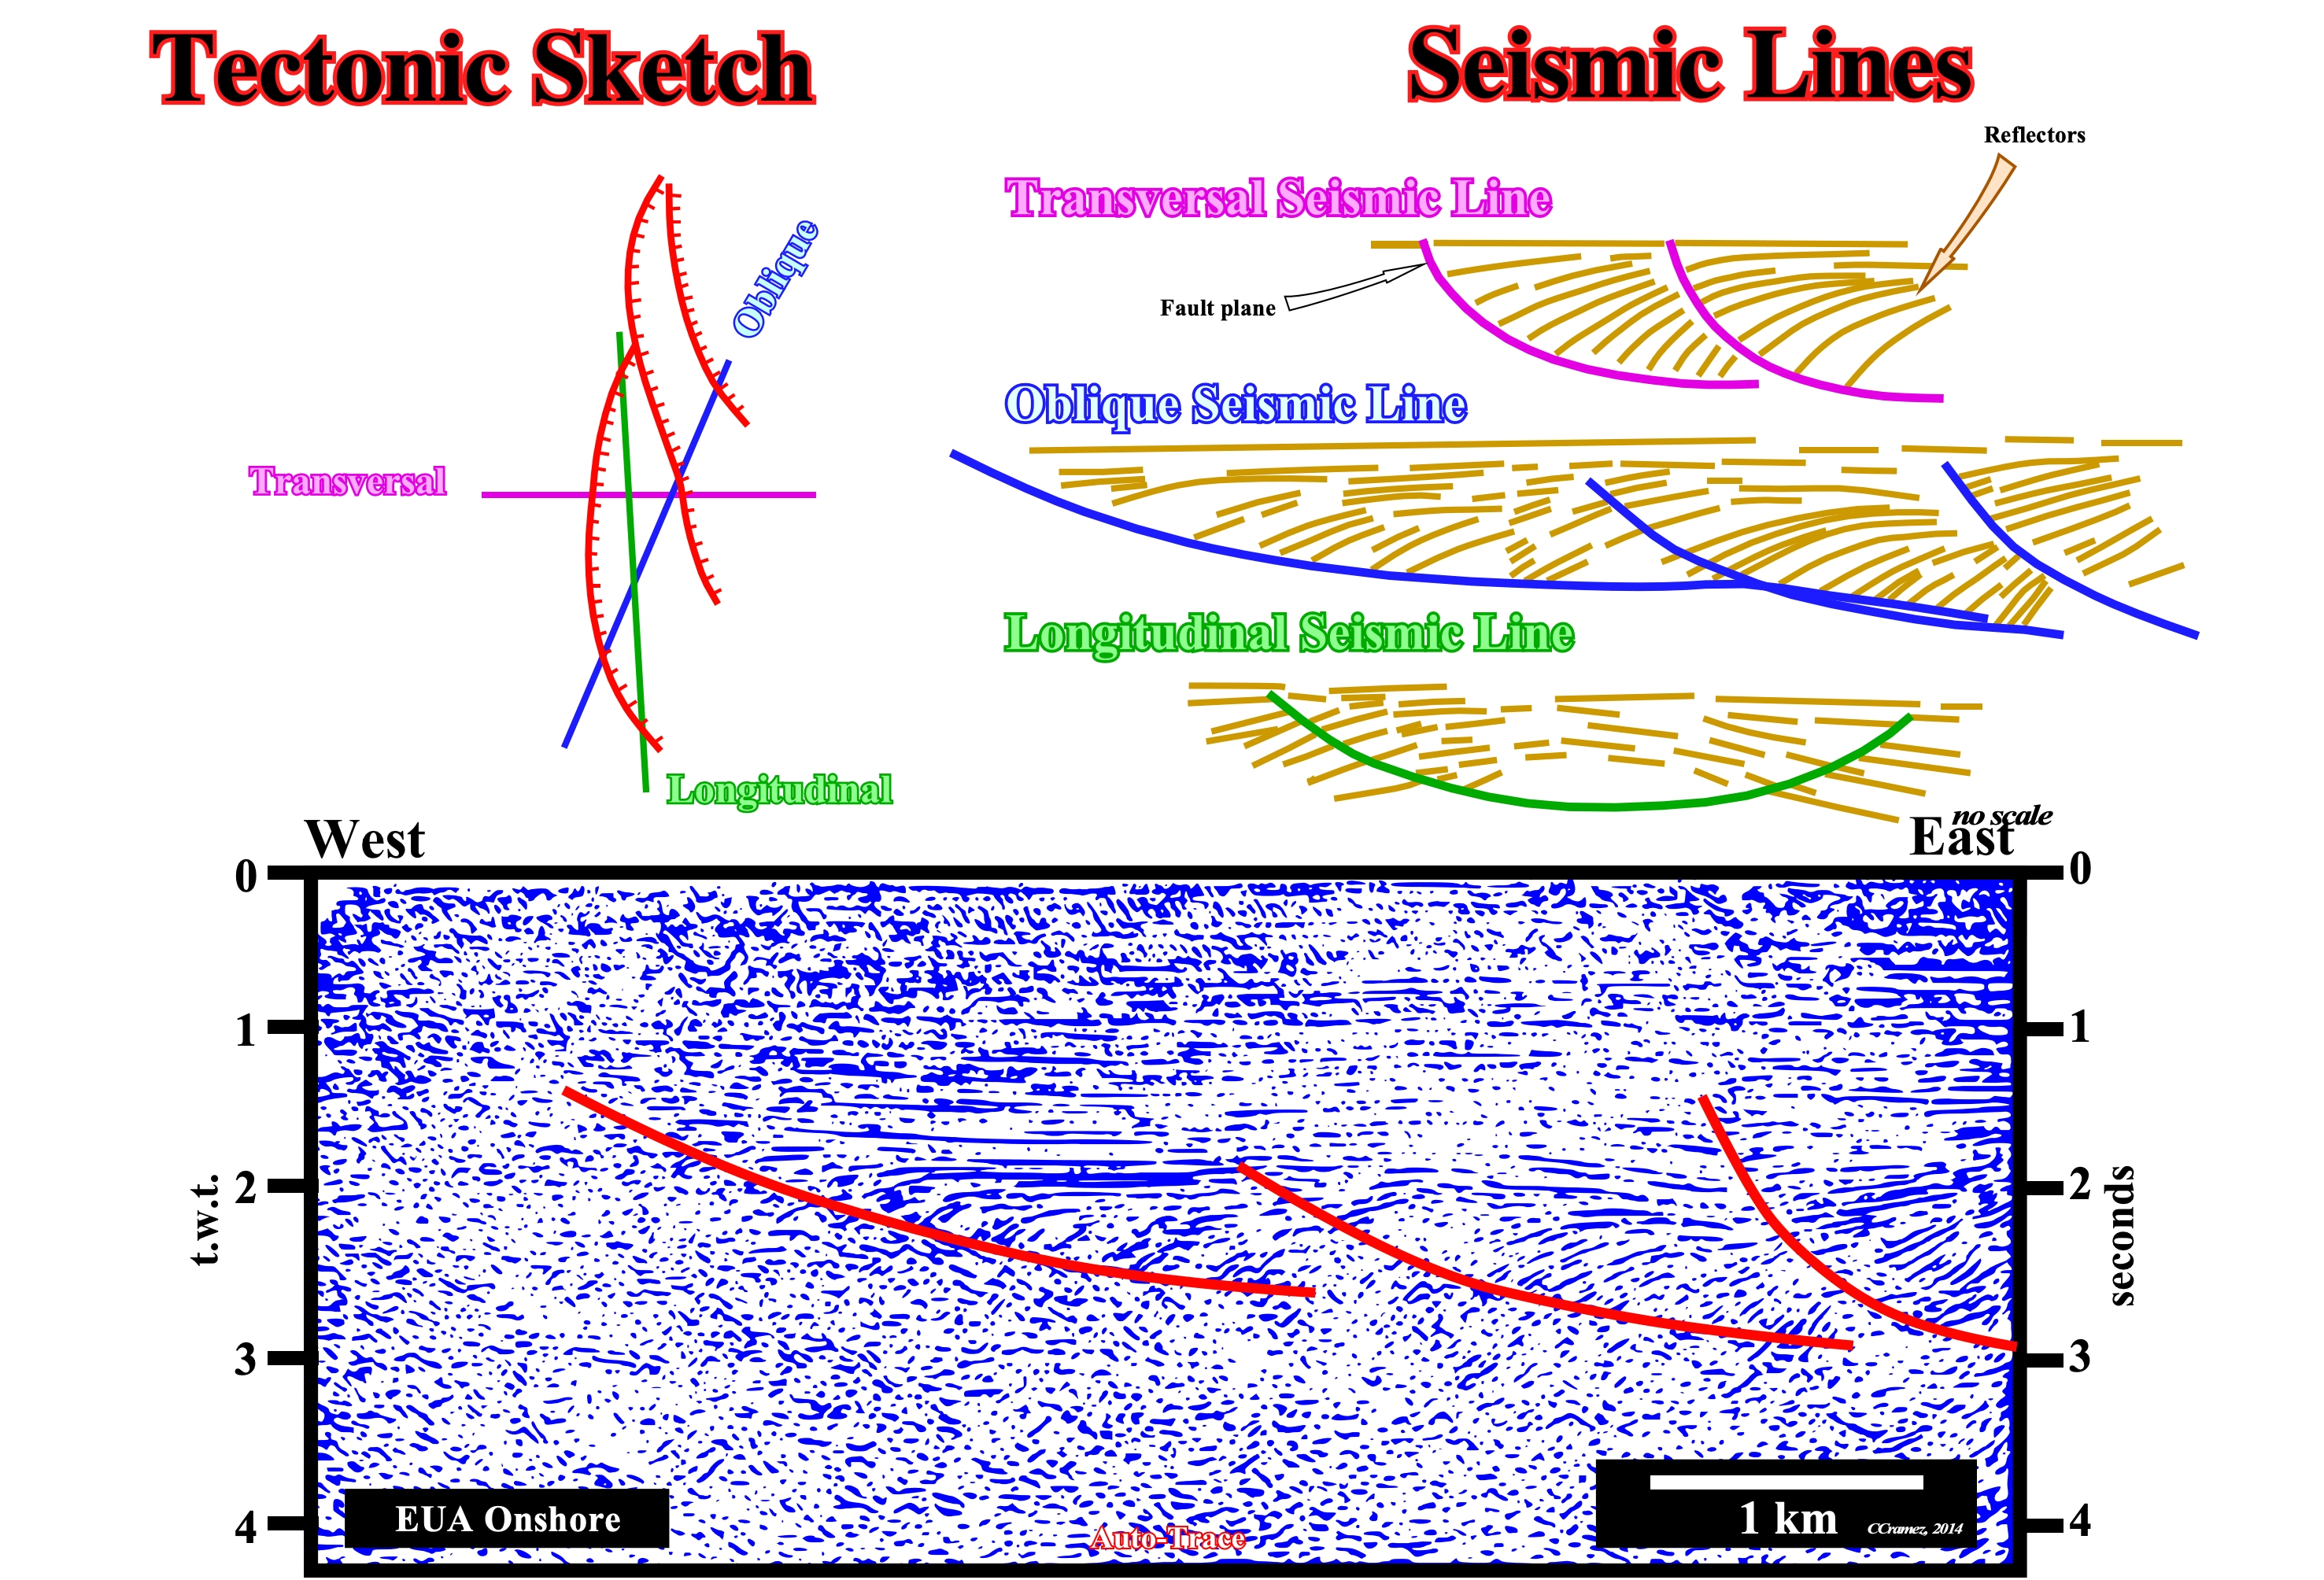
Figure 103- On a seismic line, the geometry of the reflectors is largely dependent on the angle between the seismic profile and the direction of the geological structures. The most representative geometry is observed in transversal lines, i.e., lines perpendicular to the direction to the fault planes and bedding planes. On the longitudinal and oblique lines, the geometric relationships between the reflectors or between the reflectors and the discontinuities are apparent. On this arbitrary and not straight line, the fault planes are intersected at different angles. The geometry of the reflectors in the faulted blocks is quite different. The most representative is the one in which the rotation of the reflectors is more homogeneous and significant, that to say, on the hangingwall of easternmost fault.
Figure 104- These two seismic lines are perpendicular. In relation to the direction of the sedimentary structures visible on these lines, the west-east line is transversal. It is, more or less, perpendicular to the structures, while the North-South line is longitudinal. The structures are compressional, since the sediments were shortened by anticlines and reverse faults. As an exercise propose the most likely geometry of reverse faults on both lines.
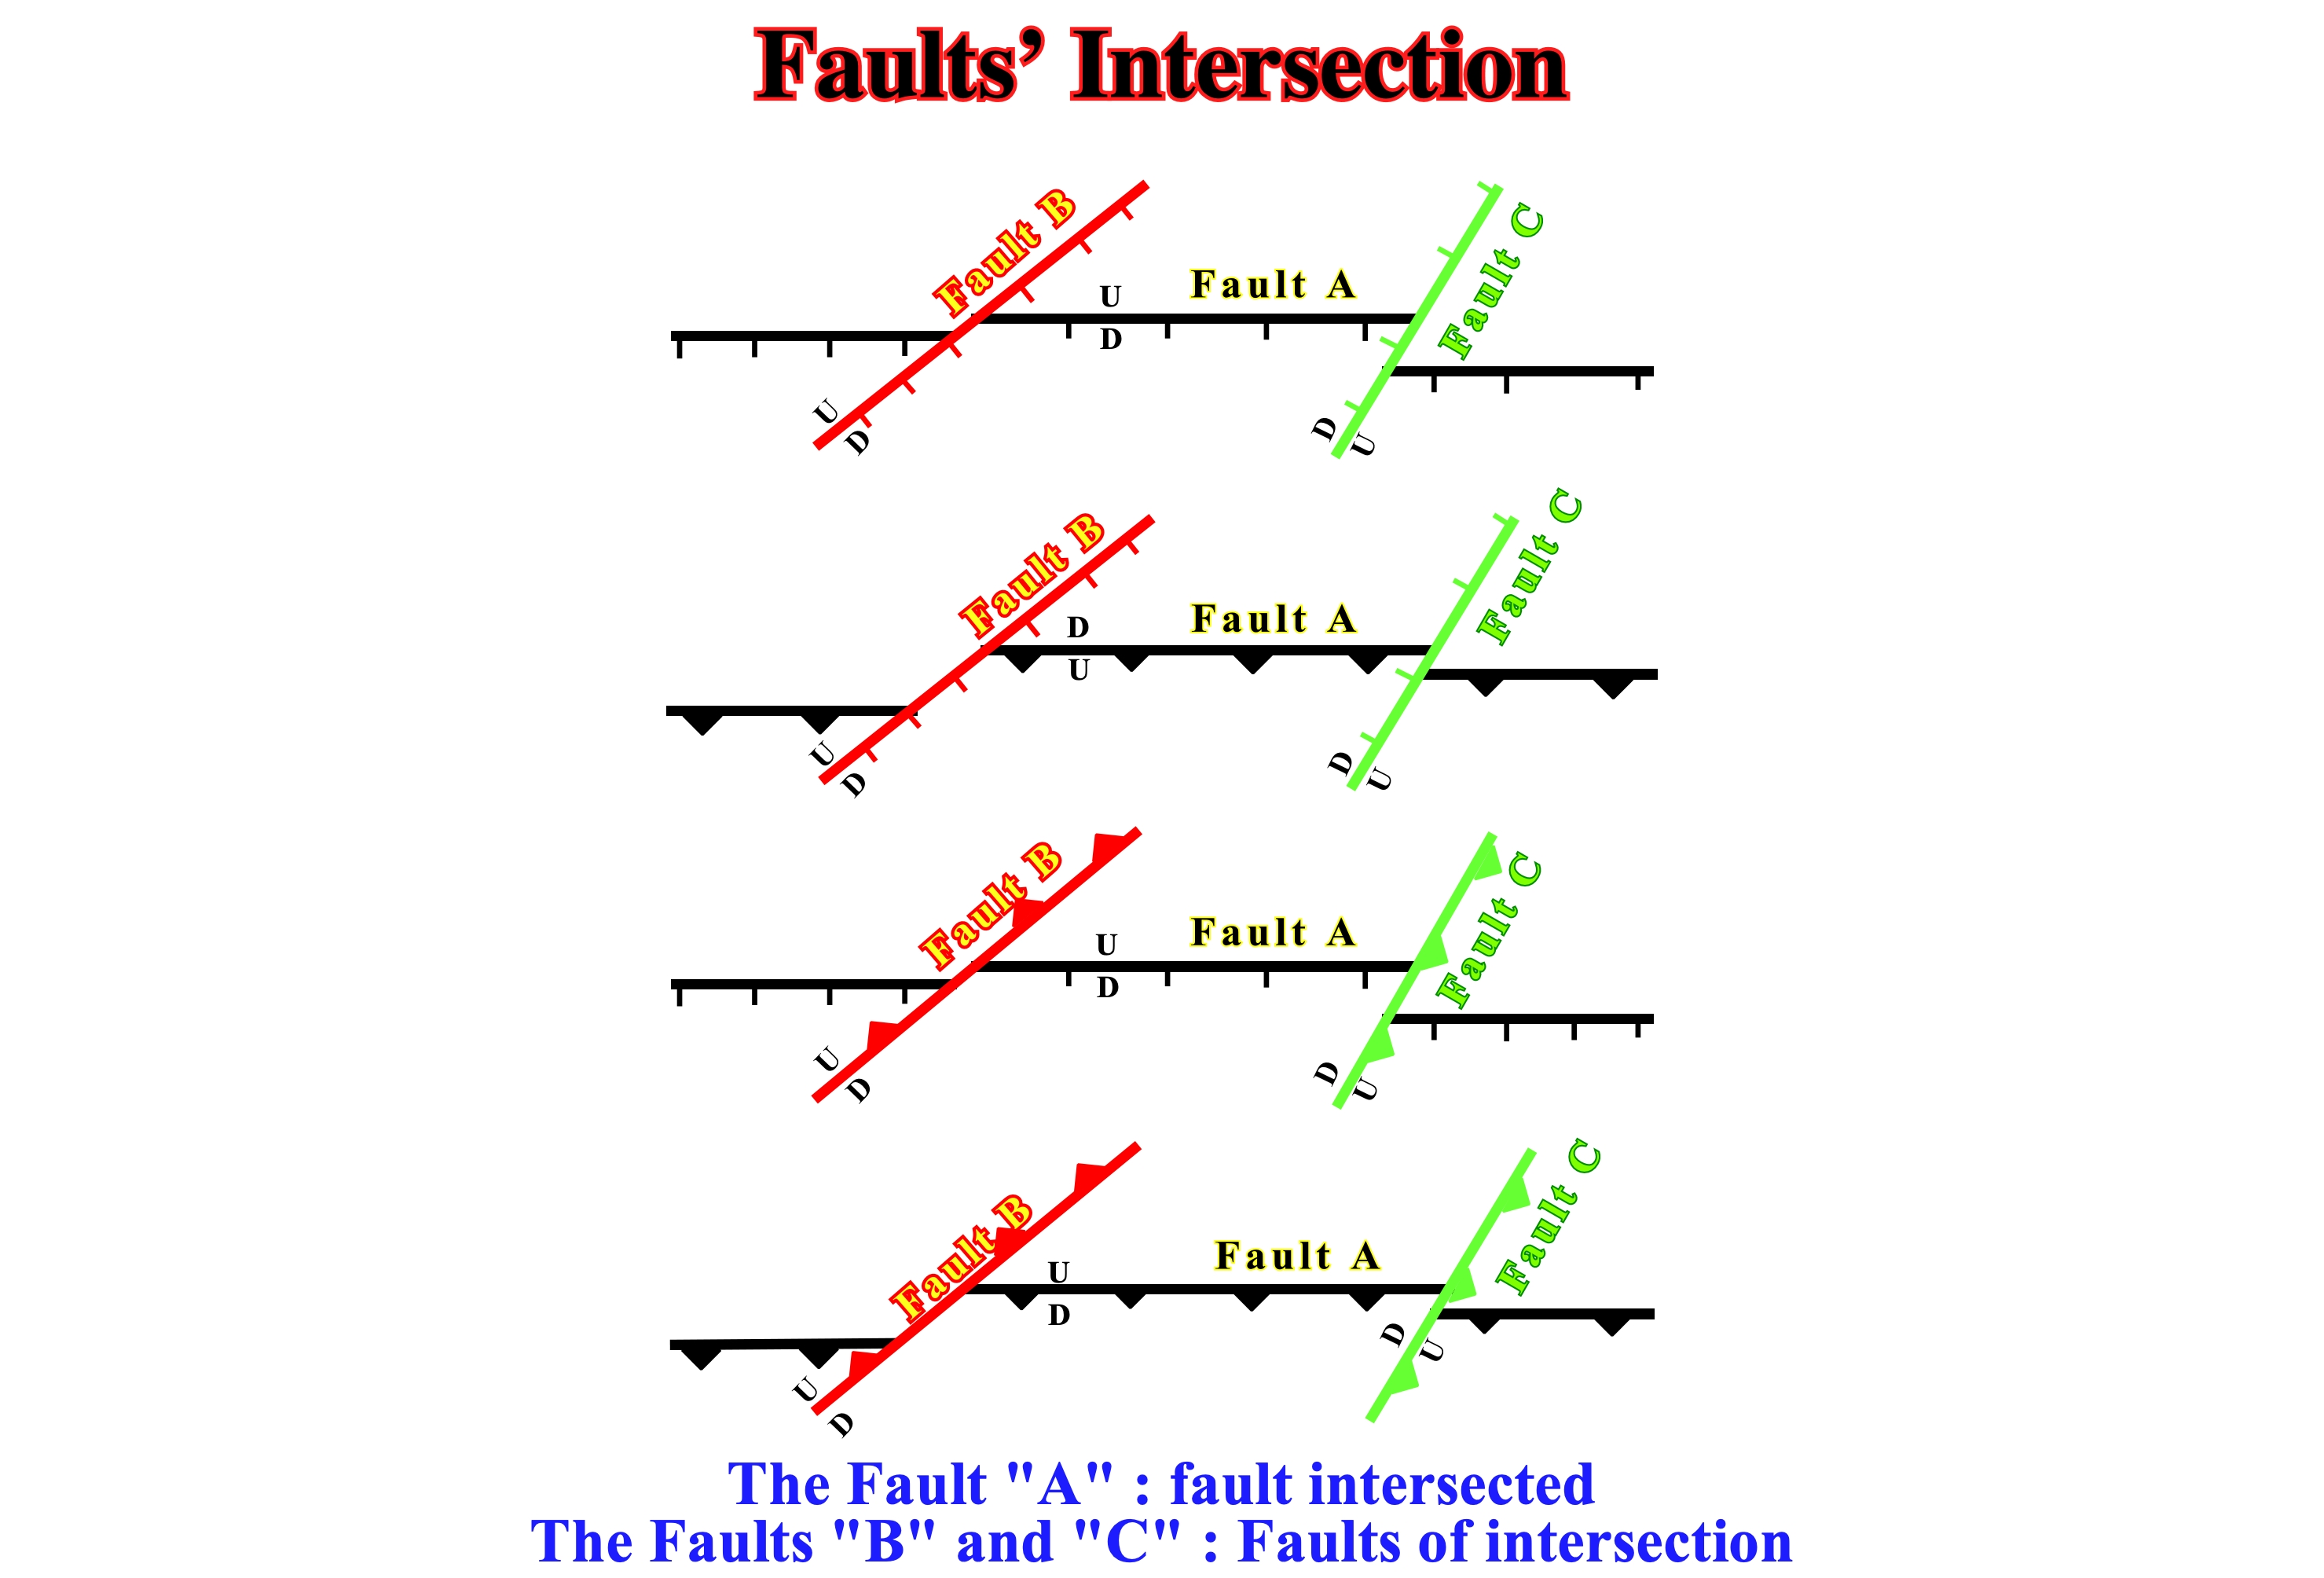
Figure 105- This map illustrates several fault combinations that intersect at different angles on a flat surface or on non-conformity. On the surface, the intersected fault (B) is, always, displaced by faults that cross it (red and green) in the direction of its dip in the upper fault block (hangingwall). This movement is independent of the angle of intersection of the faults, at the condition that the direction of fault movement intersecting is sliding along its dip.
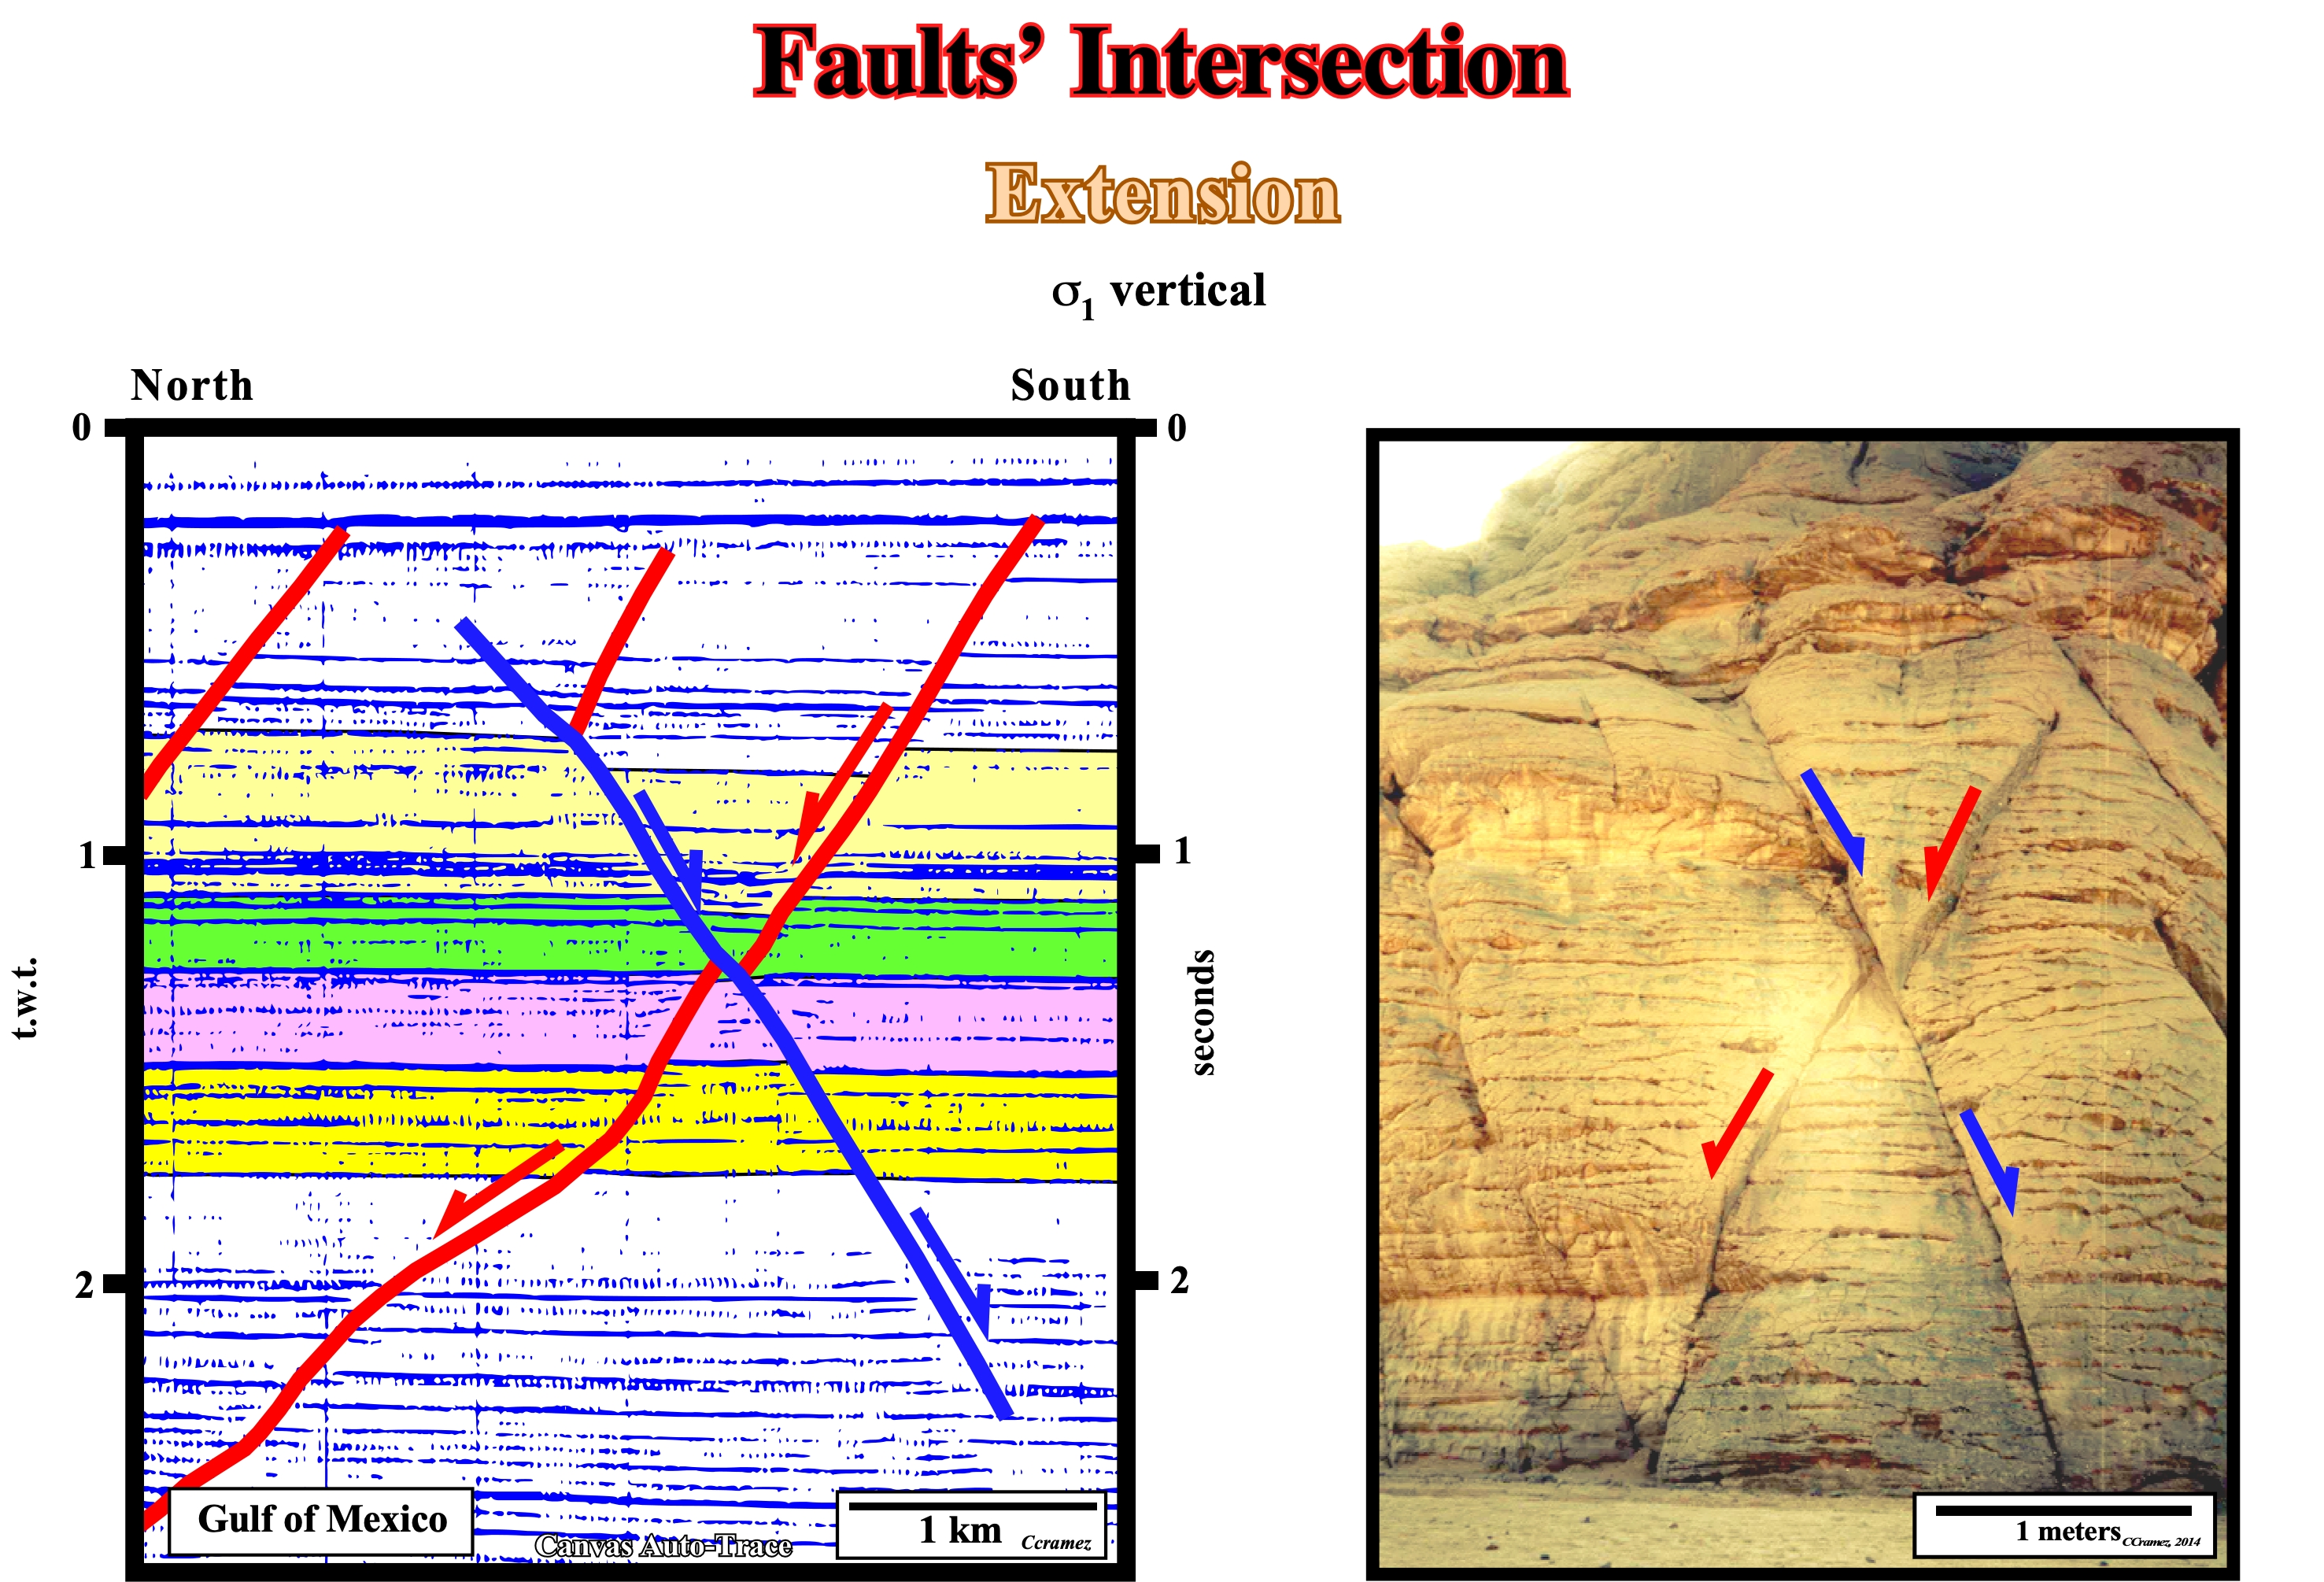
Figure 106- This seismic line the Gulf of Mexico, illustrates a typical example of normal faults in X. The younger fault, colored in blue, dips rightward and displaces the oldest dipping leftward. On a time plane ("seiscrop") or on geological map, with a flat topography, the youngest fault displaces, also, the oldest fault. However, as we shall see later, a structural map in time or a geological map of a area with a significant topography, the intersection of two faults seems, rather, much more complicated. In this photo of a coastal outcropping, the sandstones are affected by normal faults of different ages. The latest fault (in blue) displaced rightward the oldest fault (in red).
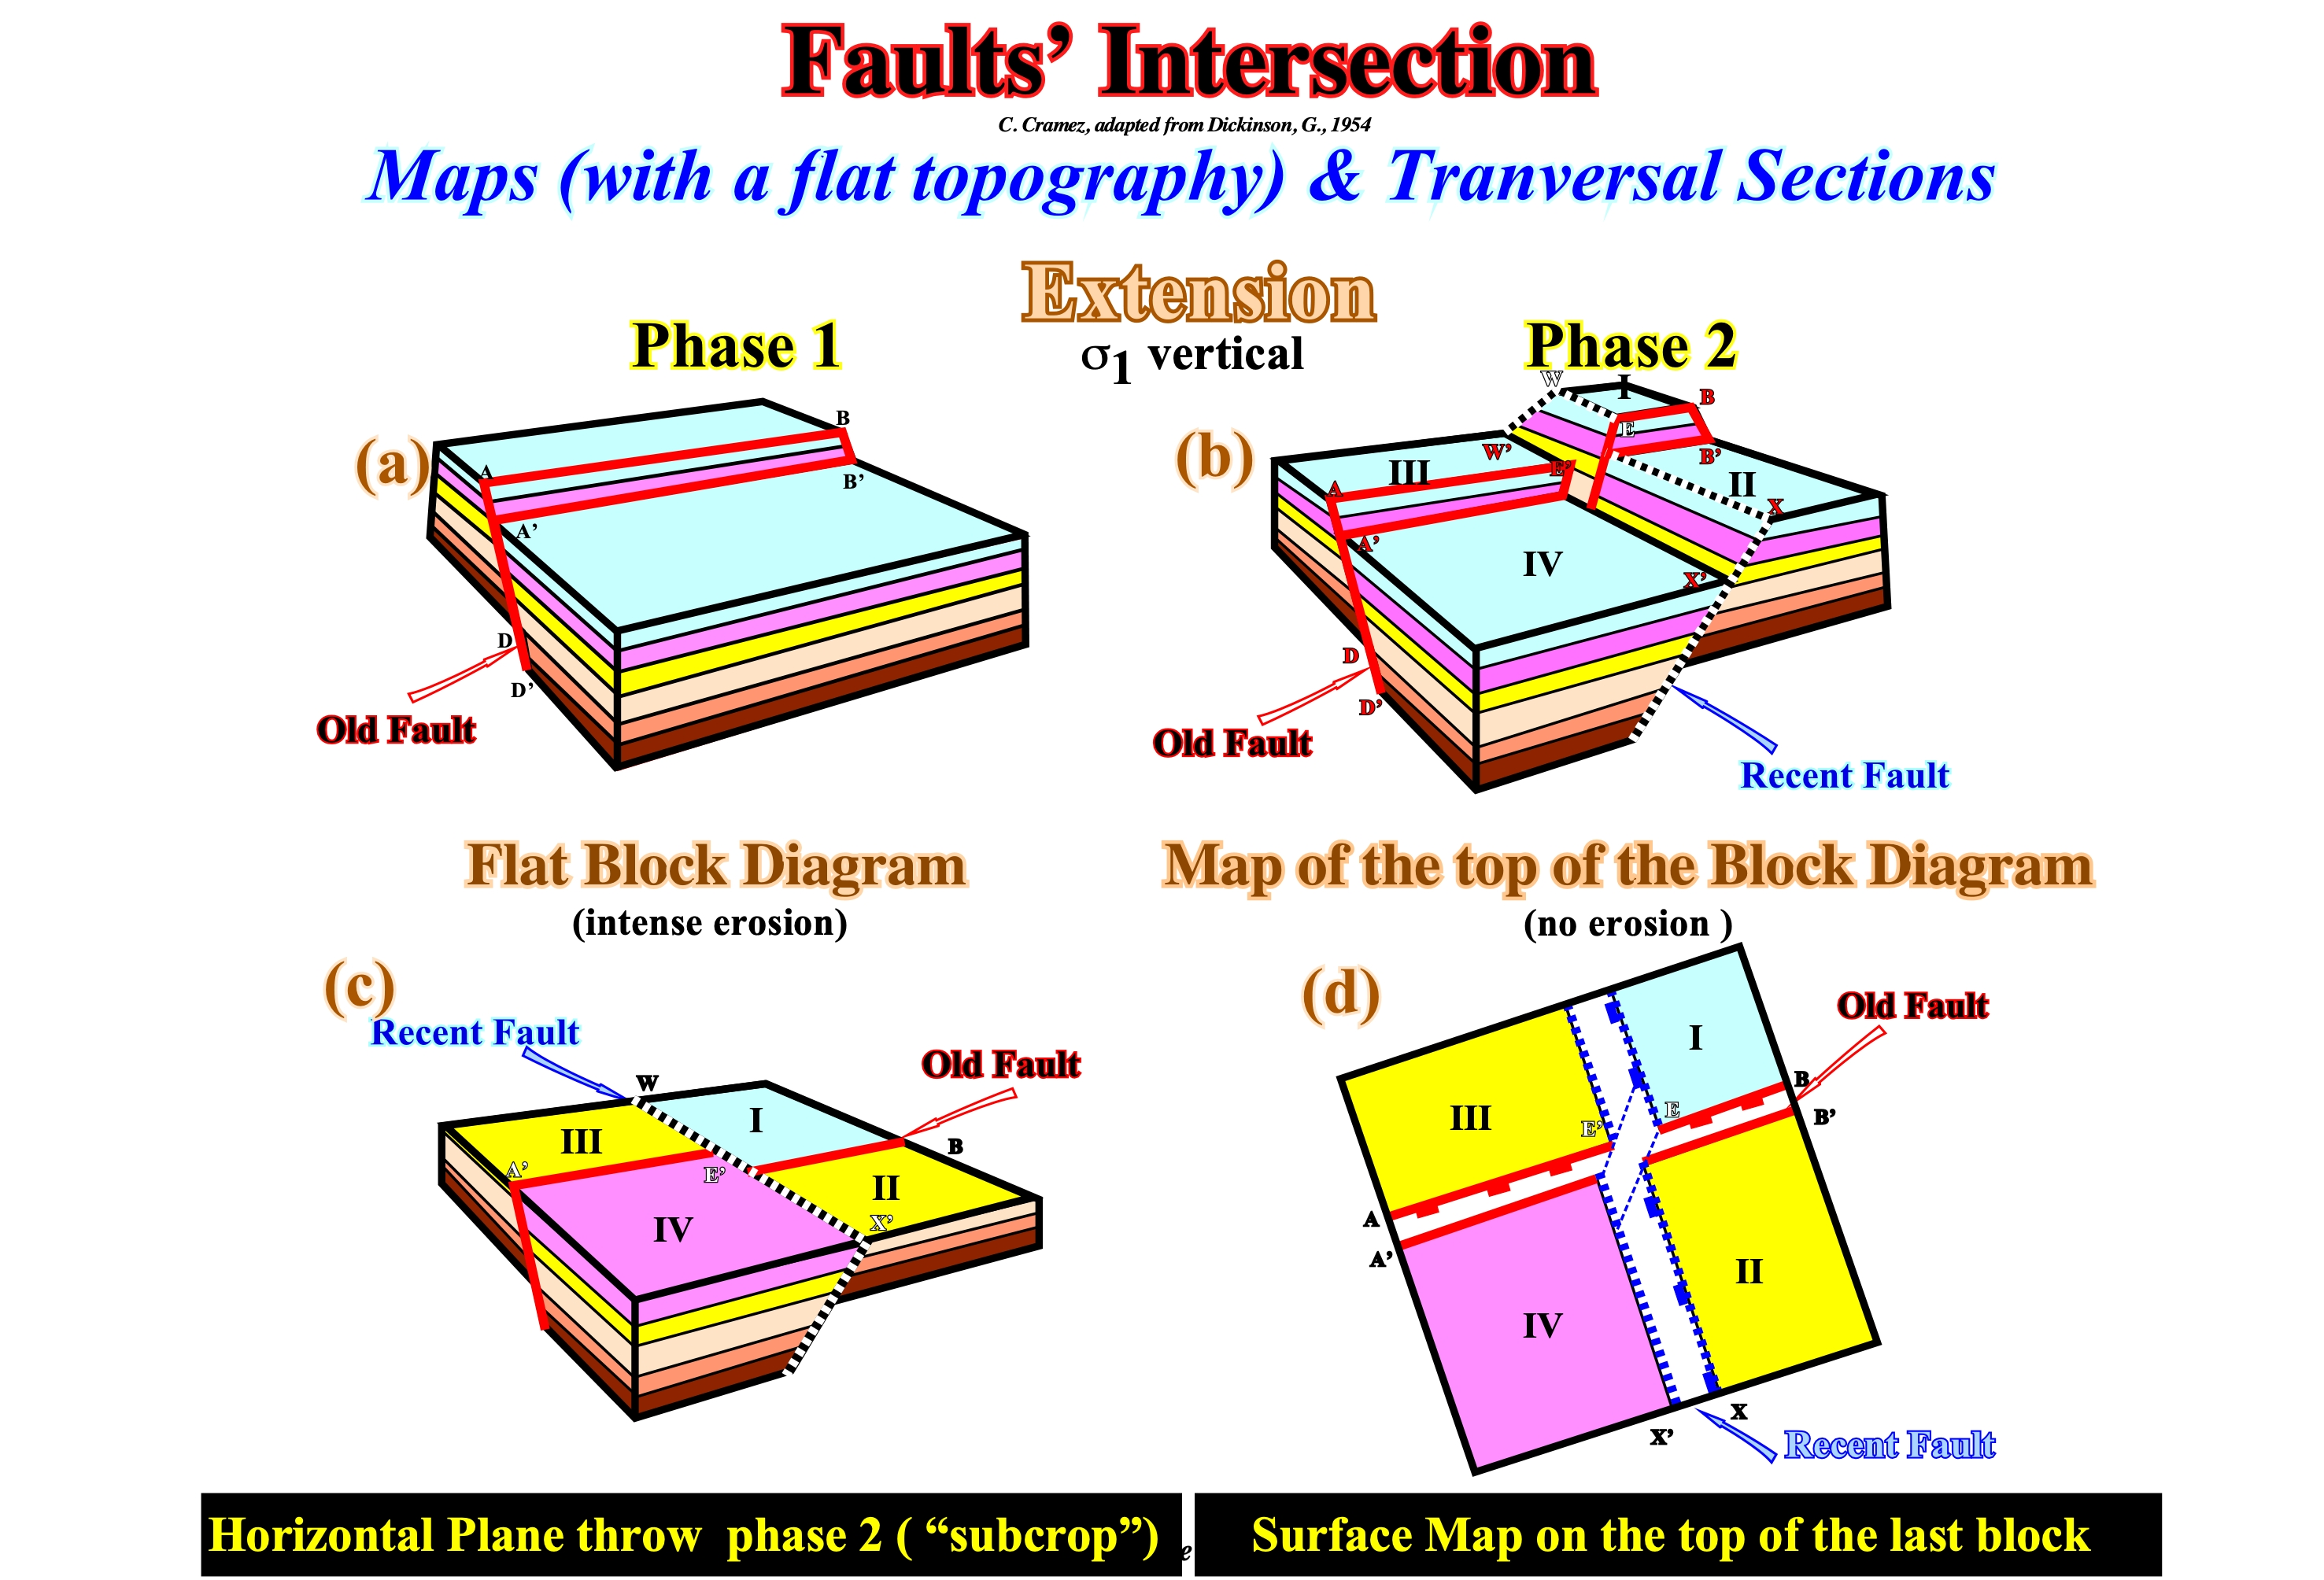
Figure 107- The effects of fault intersection on the field or on isochronous seismic maps are much more complicated than on a flat surface. Two faults that intersect cut the sediments into four blocks, which vertical displacement can be very different in each block. On the maps, the latest fault is, apparently, displaced by the oldest, as illustrated in the block diagram. The understanding this displacement is very important to establish the chronology of the faults, which, often, is critical to assess the likelihood presence of hydrocarbons in certain non-structural traps, as in morphological traps by juxtaposition. As with all other traps, their age should be older or synchronous, of the migration of hydrocarbons. Sometimes, geoscientists interpreting isochronous maps (time structural maps), do not take into account the influence of the topography. In time contour maps of chronostratigraphic surfaces are deformed, as a consequence of the topography and, often, the younger faults are, apparently, displaced by the older.