

Seismic Artifacts Induced by Faulting
The seismic reflection technique produces a certain number of misleading features that are easily misinterpreted as real geological fractures. Such a misleadings or artifacts are known as "pitfalls* by the geoscientists working in petroleum exploration. The more common seismic artifacts* or pitfalls are: (i) Velocity Pull-up/pull-down (with laterally varying velocities, deep horizontal reflectors will be pulled up where they are overlain locally by a high velocity body and will be pushed down by a low velocity body) ; (ii) Multiples (when the acoustic energy bounces off of a reflector at depth and comes back to the surface, an additional bounce can be generated by the air-rock interface) ; (iii) Sideswipe (reflections coming from out of the plane crossing other reflections) and (iv) Buried Focus (tight synclines at depth can act like concave mirrors to produce an inverted image).
On a seismic line, the majority of normal faults have a similar geometry (hangingwall and footwall dipping in same direction, as well, as the fault plane). In the figure 108, the stratigraphic intervals are assumed to be, in the field, more or less, horizontal, as well as in the depth geological model. On the seismic answer of such a geological model, the associated reflectors are also horizontal. However, below the fault plane, the reflectors of the lower block (footwall) are pulled down.
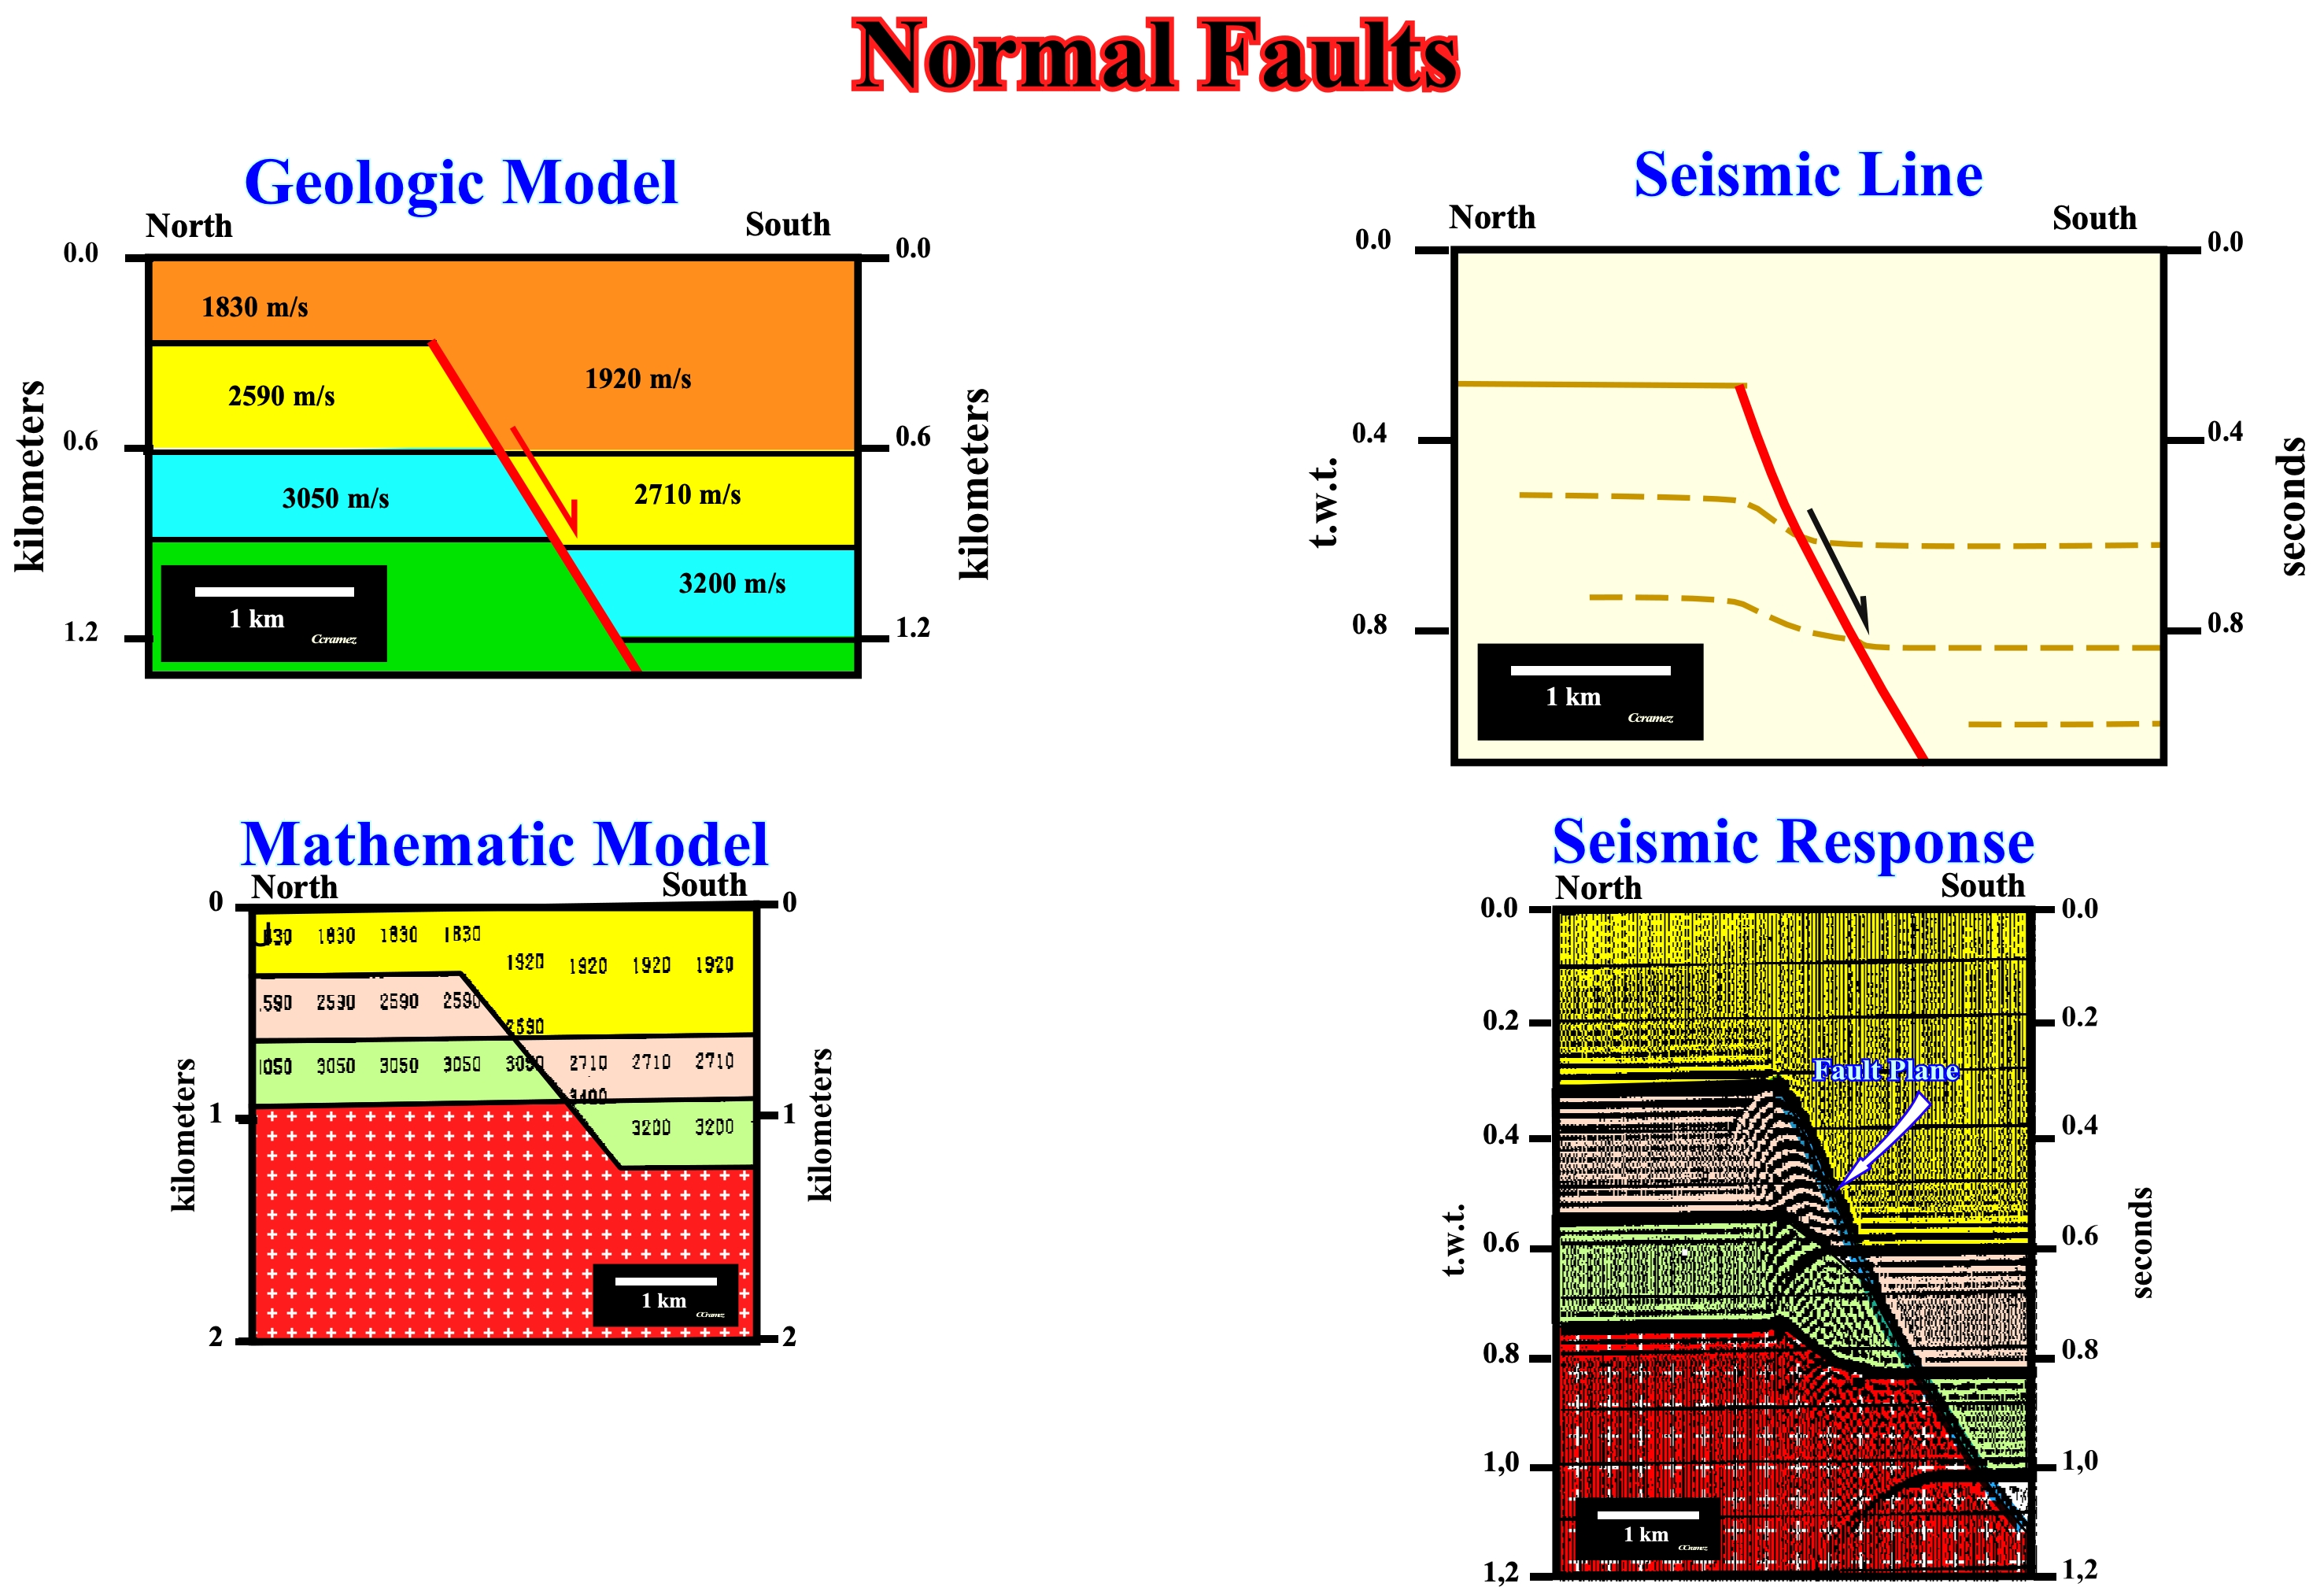
Figure 108- In the upper figures a geological model of a normal fault and its seismic responses are illustrated. Theoretically, due to the relative downward movement of the hangingwall, sedimentary intervals with different interval velocities are juxtaposed, what has important consequences on the seismic response. The reflectors of the footwall beneath the fault plane (area with lateral velocity changes) are pulled down, since at the same level, the velocity interval in the hangingwall is smaller. In the mathematical model (lower left figure), three sedimentary intervals are considered above the basement. All intervals are affected by a normal fault. The sediments of the hangingwall are denser (the fault postdate the compaction). They arrived at greater depths. The velocities of compressional waves is greater than in the sediments of the hangingwall. Subsequently, on the seismic response, below the fault plane, the reflectors of the hangingwall are pulled down, since there is a lateral change of the interval velocity.
The seismic artifact induced by lateral changes of velocity interval, is easily recognized on seismic data, as illustrated below, in the Angola offshore seismic lines (Figure 109). As the sediment of the footwall (growth fault) have a lower velocity (especially shales) than that of the sediments of the footwall (mainly carbonates), not only the reflectors, beneath the fault plane, are pulled down, but also the reflector associated with salt weld.
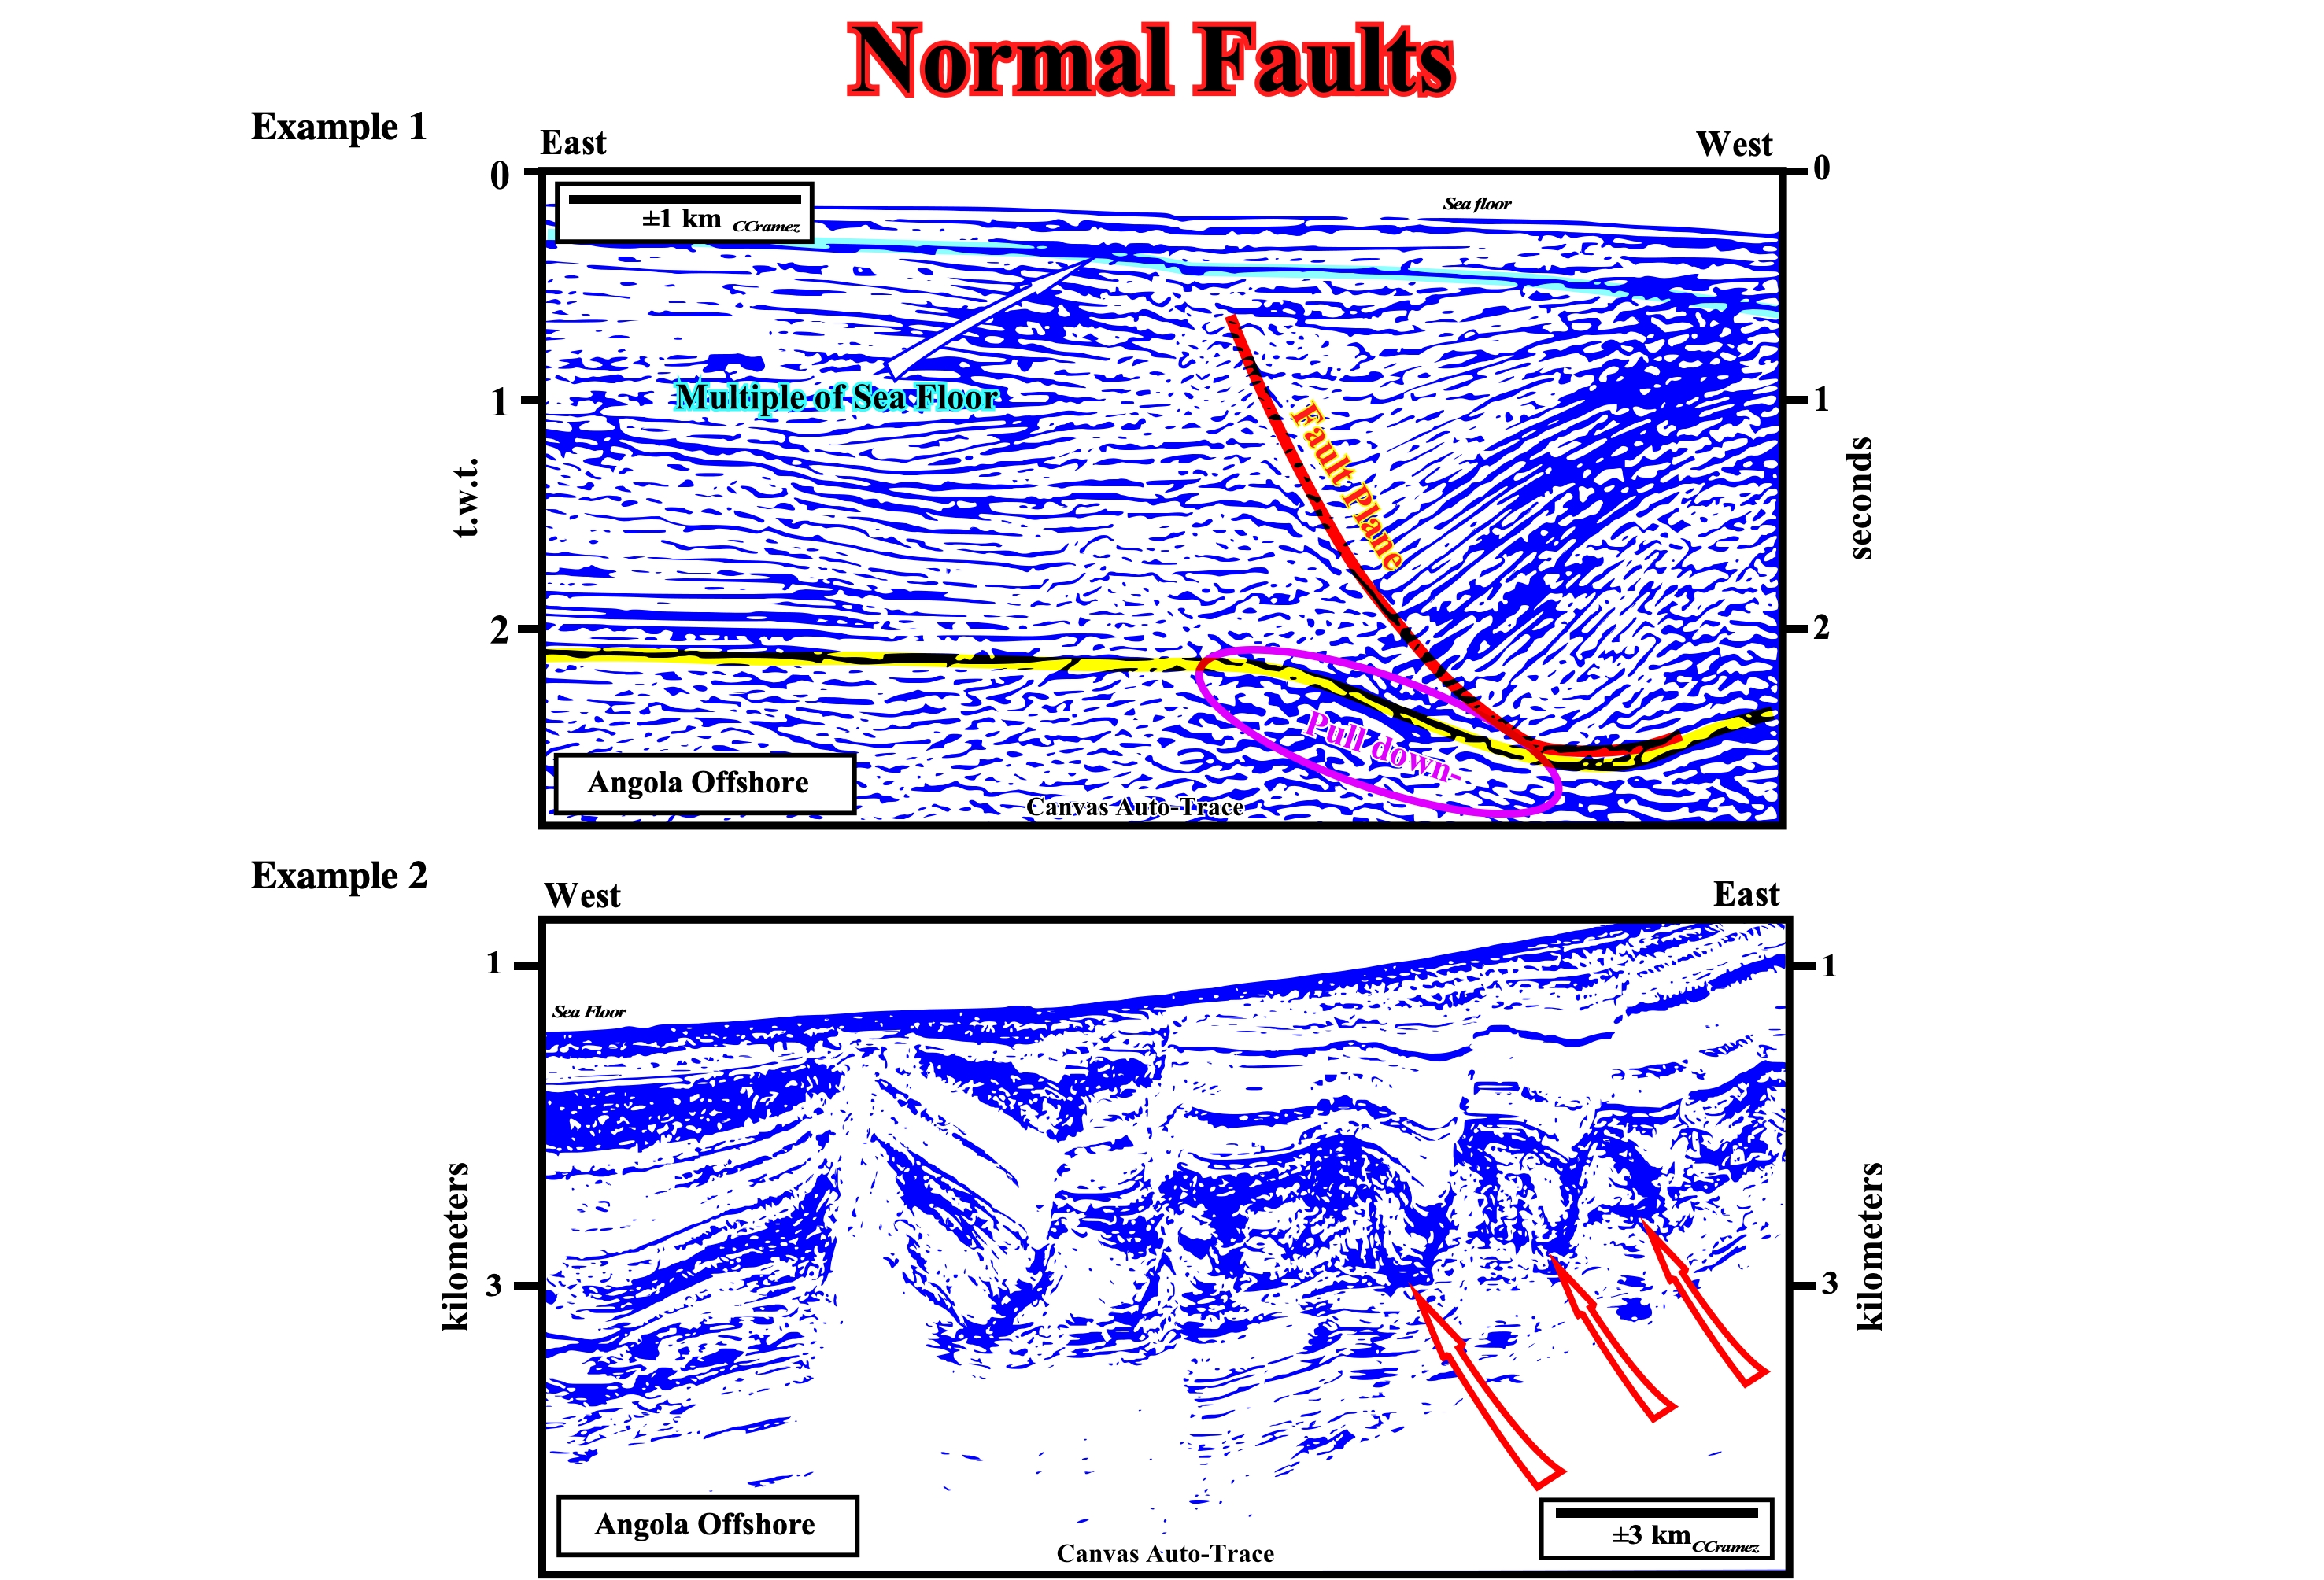
Figure 109- In the Angola offshore seismic line, illustrated above, the pull down of the yellow reflector (base of evaporitic interval), under the fault plane which is the western limit of a Tertiary depocenter, is induced by the lateral juxtaposition of sedimentary intervals with different interval velocities. The fault places side by side, the limestone of the footwall with the shales of hangingwall. In a depth version of this seismic line, the tectonic disharmony induced by salt tectonic (emphasized by the yellow marker) must be, more or less, sub-horizontal. This conjecture can be used to tentatively correct the geological interpretation and locally the interval velocity used in the depth conversion, as well as the picking of disharmony. In the seismic line illustrated below, which comes from the same offshore, the seismic artifacts induced by the normal faults are easy to recognize, as well as, the fact mentioned, several times, that, in general, there is no reflector associated with a fault plane, which is emphasized by the reflector terminations of the faulted blocks.
In the geological model of a reverse fault used below, the geometry of the different sedimentary facies (lithologies) is parallel and horizontal. The interval velocities are, laterally, constant. Due to the movement of the faults, created by a tectonic compressional regime (sedimentary shortening), the footwall is uplifted and therefore sedimentary packages with different interval velocities are juxtaposed (lateral change in velocity). The main consequence of such a lateral and abrupt change in the interval velocity is a pull up of the seismic reflectors below the fault plane, that is to say, of the footwall. The most likely seismic response (in time) of this model, as well as, the used interval velocities are illustrated in figures 110 ans 111.

Figure 110- The geological model of a reverse fault and its, likely, seismic response here illustrated are quite obvious. Due to the shortening of the sediments induced by a compressional tectonic regime, the sedimentary packages of the hangingwall were uplifted. Such a discontinuous uplift placed, in juxtaposition, sedimentary intervals with different lithologies and compaction, since the model assumes a faulting postdating compaction. In other words, there is a sharp change of the interval velocities between the fault blocks. As a reverse fault is a fault with low angle, on a seismic line, the reflectors of the footwall are pulled up due to a lateral change of the interval velocity, as illustrated in the sketch on the right. The seismic response from a mathematical model of a reverse fault (below), in which the sediments of the footwall are less compacted (less dense) than those of the hangingwall, corroborates the hypothesis that the reflectors below the fault plane are pulled up creating the illusion, very common, an anticline structure.
It is particularly important to note that in a seismic line, the trace of the fault plane of a reverse fault is not underlined by a clear reflection but marked by reflector terminations that dip in rectilinear manner (right) and the reflectors pulled up at the left (footwall). Earth scientists should not interpret a pull up of the reflectors as a geological uplift associated with a compressional tectonic regime (as in an anticline trap, for instance). In case of doubt, to decide between a pull up and a structural tectonic event, a depth conversion can solve the problem : (i) If the structure disappears in a depth version of the seismic line, that means that was a pull up induced by a lateral change of the interval velocity ; (Ii) If, on the contrary, the structure persists it can be tentatively interpreted as the result of a sedimentary shortening in the hangingwall (seldom as a antiform).
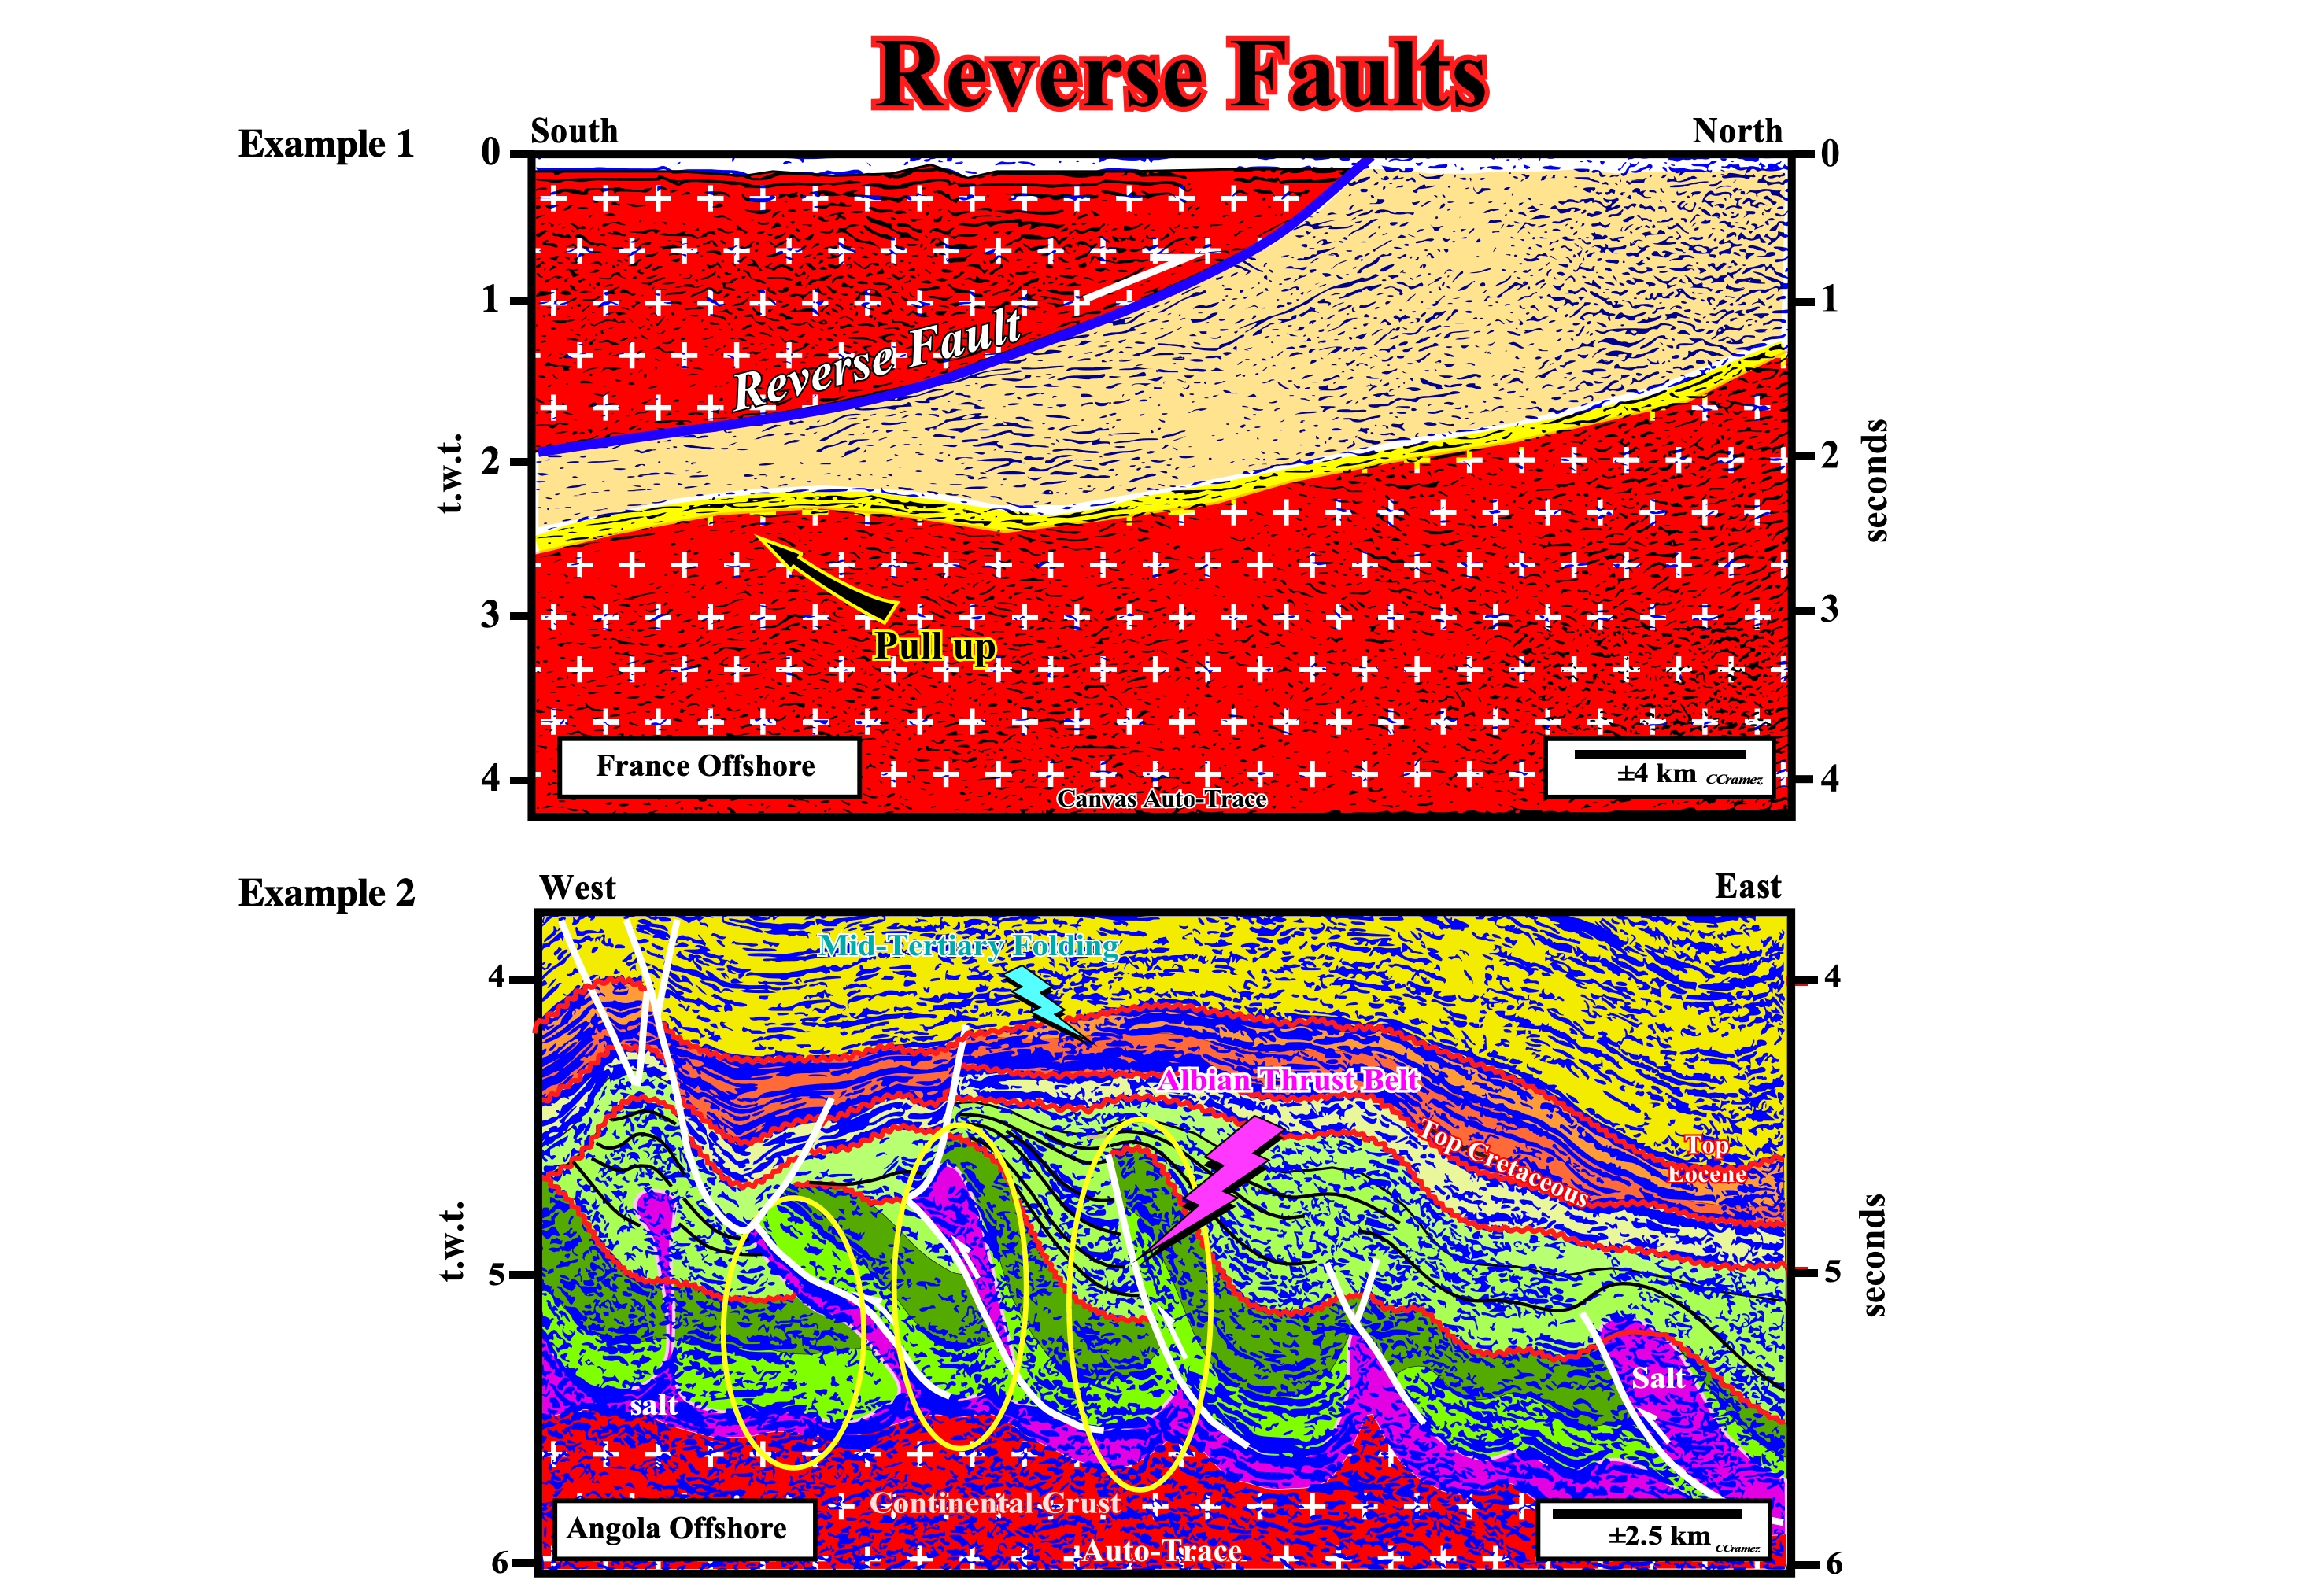
Figure 111- This tentative geologic interpretation of a France onshore seismic line illustrates the seismic artifact associated with thrust and reverse faults, that is to say, an antiform below the fault plane. Despite the strong presumption of a seismic pull up, the geoscientists decided to drill an exploration well thinking they were testing a large structural trap. In fact, in certain sedimentary basins, there are prolific oil traps below reverse and thrust faults, as in onshore Colombia. Geoscientists should always test their time interpretations with depth conversions before deciding to drill a well.. If an antiform structure is detected in the footwall of a reverse fault, they should admitted two possibilities : (i) Seismic artifact and (ii) Anticline, which they must imperatively be test rejecting the lesser resistant to refutation tests. In seismic line below (offshore Angola), it can be said that when the salt interval is not too thick, salt thrust belts (Aptian) and carbonates (Albian) can be formed, particular, in the deep waters of the Congo and Angola basins, which implies the presence on the seismic lines, pull ups below the reverse and thrust faults.