

Seismic Artifacts Induced by Evaporites
A tentative geological interpretation of seismic line with a salt diapir and its depth conversion (more or less, a geological model) are illustrated in the figures 112 & 113. The tentative interpretation (in the right side of the figure) shows seismic anomalies associated with thickness variations of the salt. In this particular example, the salt interval, which has a speed of 4580 m / s is covered by sediments with a calcareous facies in which the compressional waves travel with a high velocity (about 5480-4870 m / s). Thus, when the salt flows laterally, it becomes thinner and, therefore, the result is a pull down of the seismic reflectors (velocity of the waves in the salt is, relatively, slower than in the carbonates).
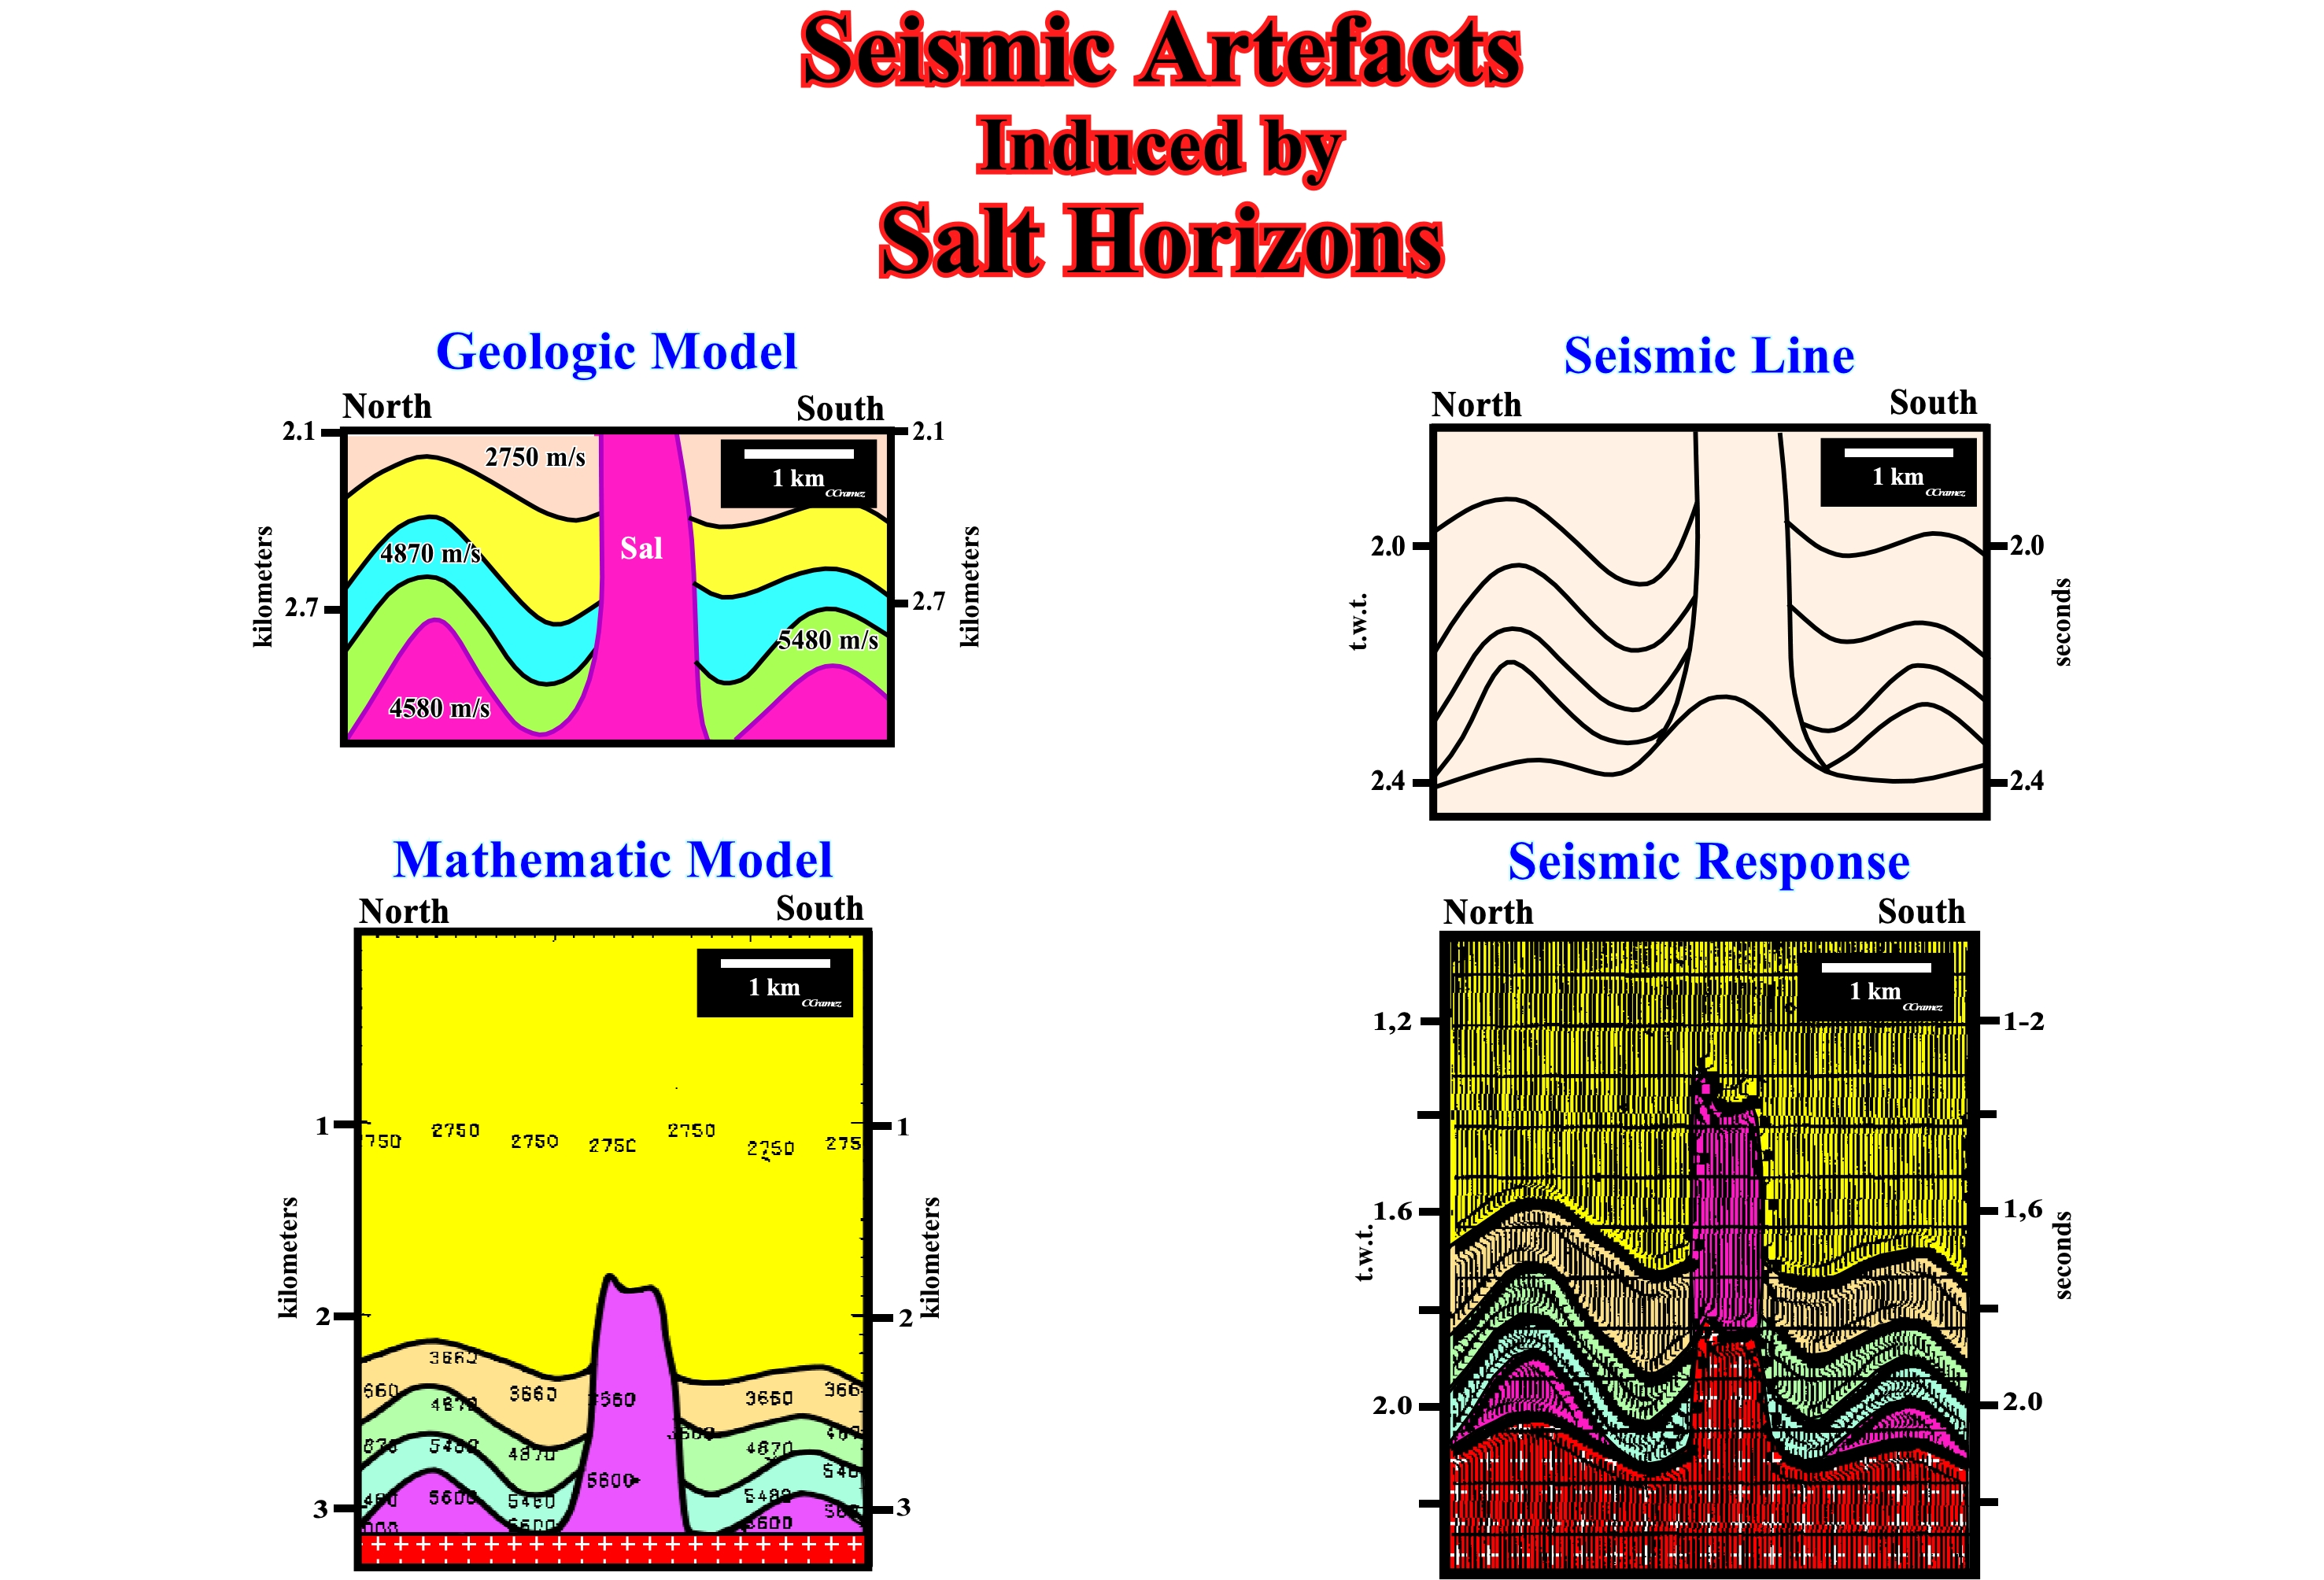
Figure 112- In the geological model, the velocity of compressional waves in the salt is constant and equal to 4580 m/s. The density of the salt varies between 2.15 and 2.17 g/cm 3. Furthermore, the salt can not be compacted, this means that its density is constant and thus the speed of the waves does not changed in depth. The interval velocity of suprasalt strata is supposed to be laterally constant. On seismic line of such a geological model, shown at right, the base of the salt layer is wavy. It suffered a seismic pull up under the thick salt. The seismic response of the geological model is quite evident. The lower part of the salt, particularly, under the apex salt dome is pulled upward, almost 0.2 seconds (double time t.w.t.). Likewise, the salt welds (absence of salt due to its lateral and vertical flow) are, slightly, pull downward. Note that this geologic model of a salt dome, with vertical sidewalls, is unrealistic. Indeed, due to the fact that the salt can not be compacted, salt structures with vertical sidewalls are a physical impossibilities. In the lower part, below the density inversion point, the pressure of the sediments against the salt is greater than the pressure of the salt against the sediments. On the contrary, in the upper part, above the density inversion point, the pressure of salt against the sediments is greater than the pressure of the sediments against salt. Subsequently, a salt structure with the form of a drop is formed which can be disconnected or not of the mother-salt rock forming a vertical salt weld.
The velocity model and the seismic response illustrated above show, clearly the apparent causes the wavy geometry of the bottom of the salt (or evaporites) in time sections (migrated or un-migrated). Only on a converted depth seismic line, the bottom of salt is, more or less, rectilinear, at the condition that the interval velocity of all sedimentary packages is well known. The seismic line below, comes from a salt basin where the lateral changes of salt thickness are common. These thickness changes induce lateral changes of the interval velocity, which cause obvious seismic artifact's. However, without a correct depth conversion is, sometimes, dangerous to assume a priori that the bottom of the salt is flat. In fact, in Kwanza basin, for example, sedimentary steps or stairs, associated with fracture zones and pre-salt carbonate buildups fossilized by salt onlaps have been observed.
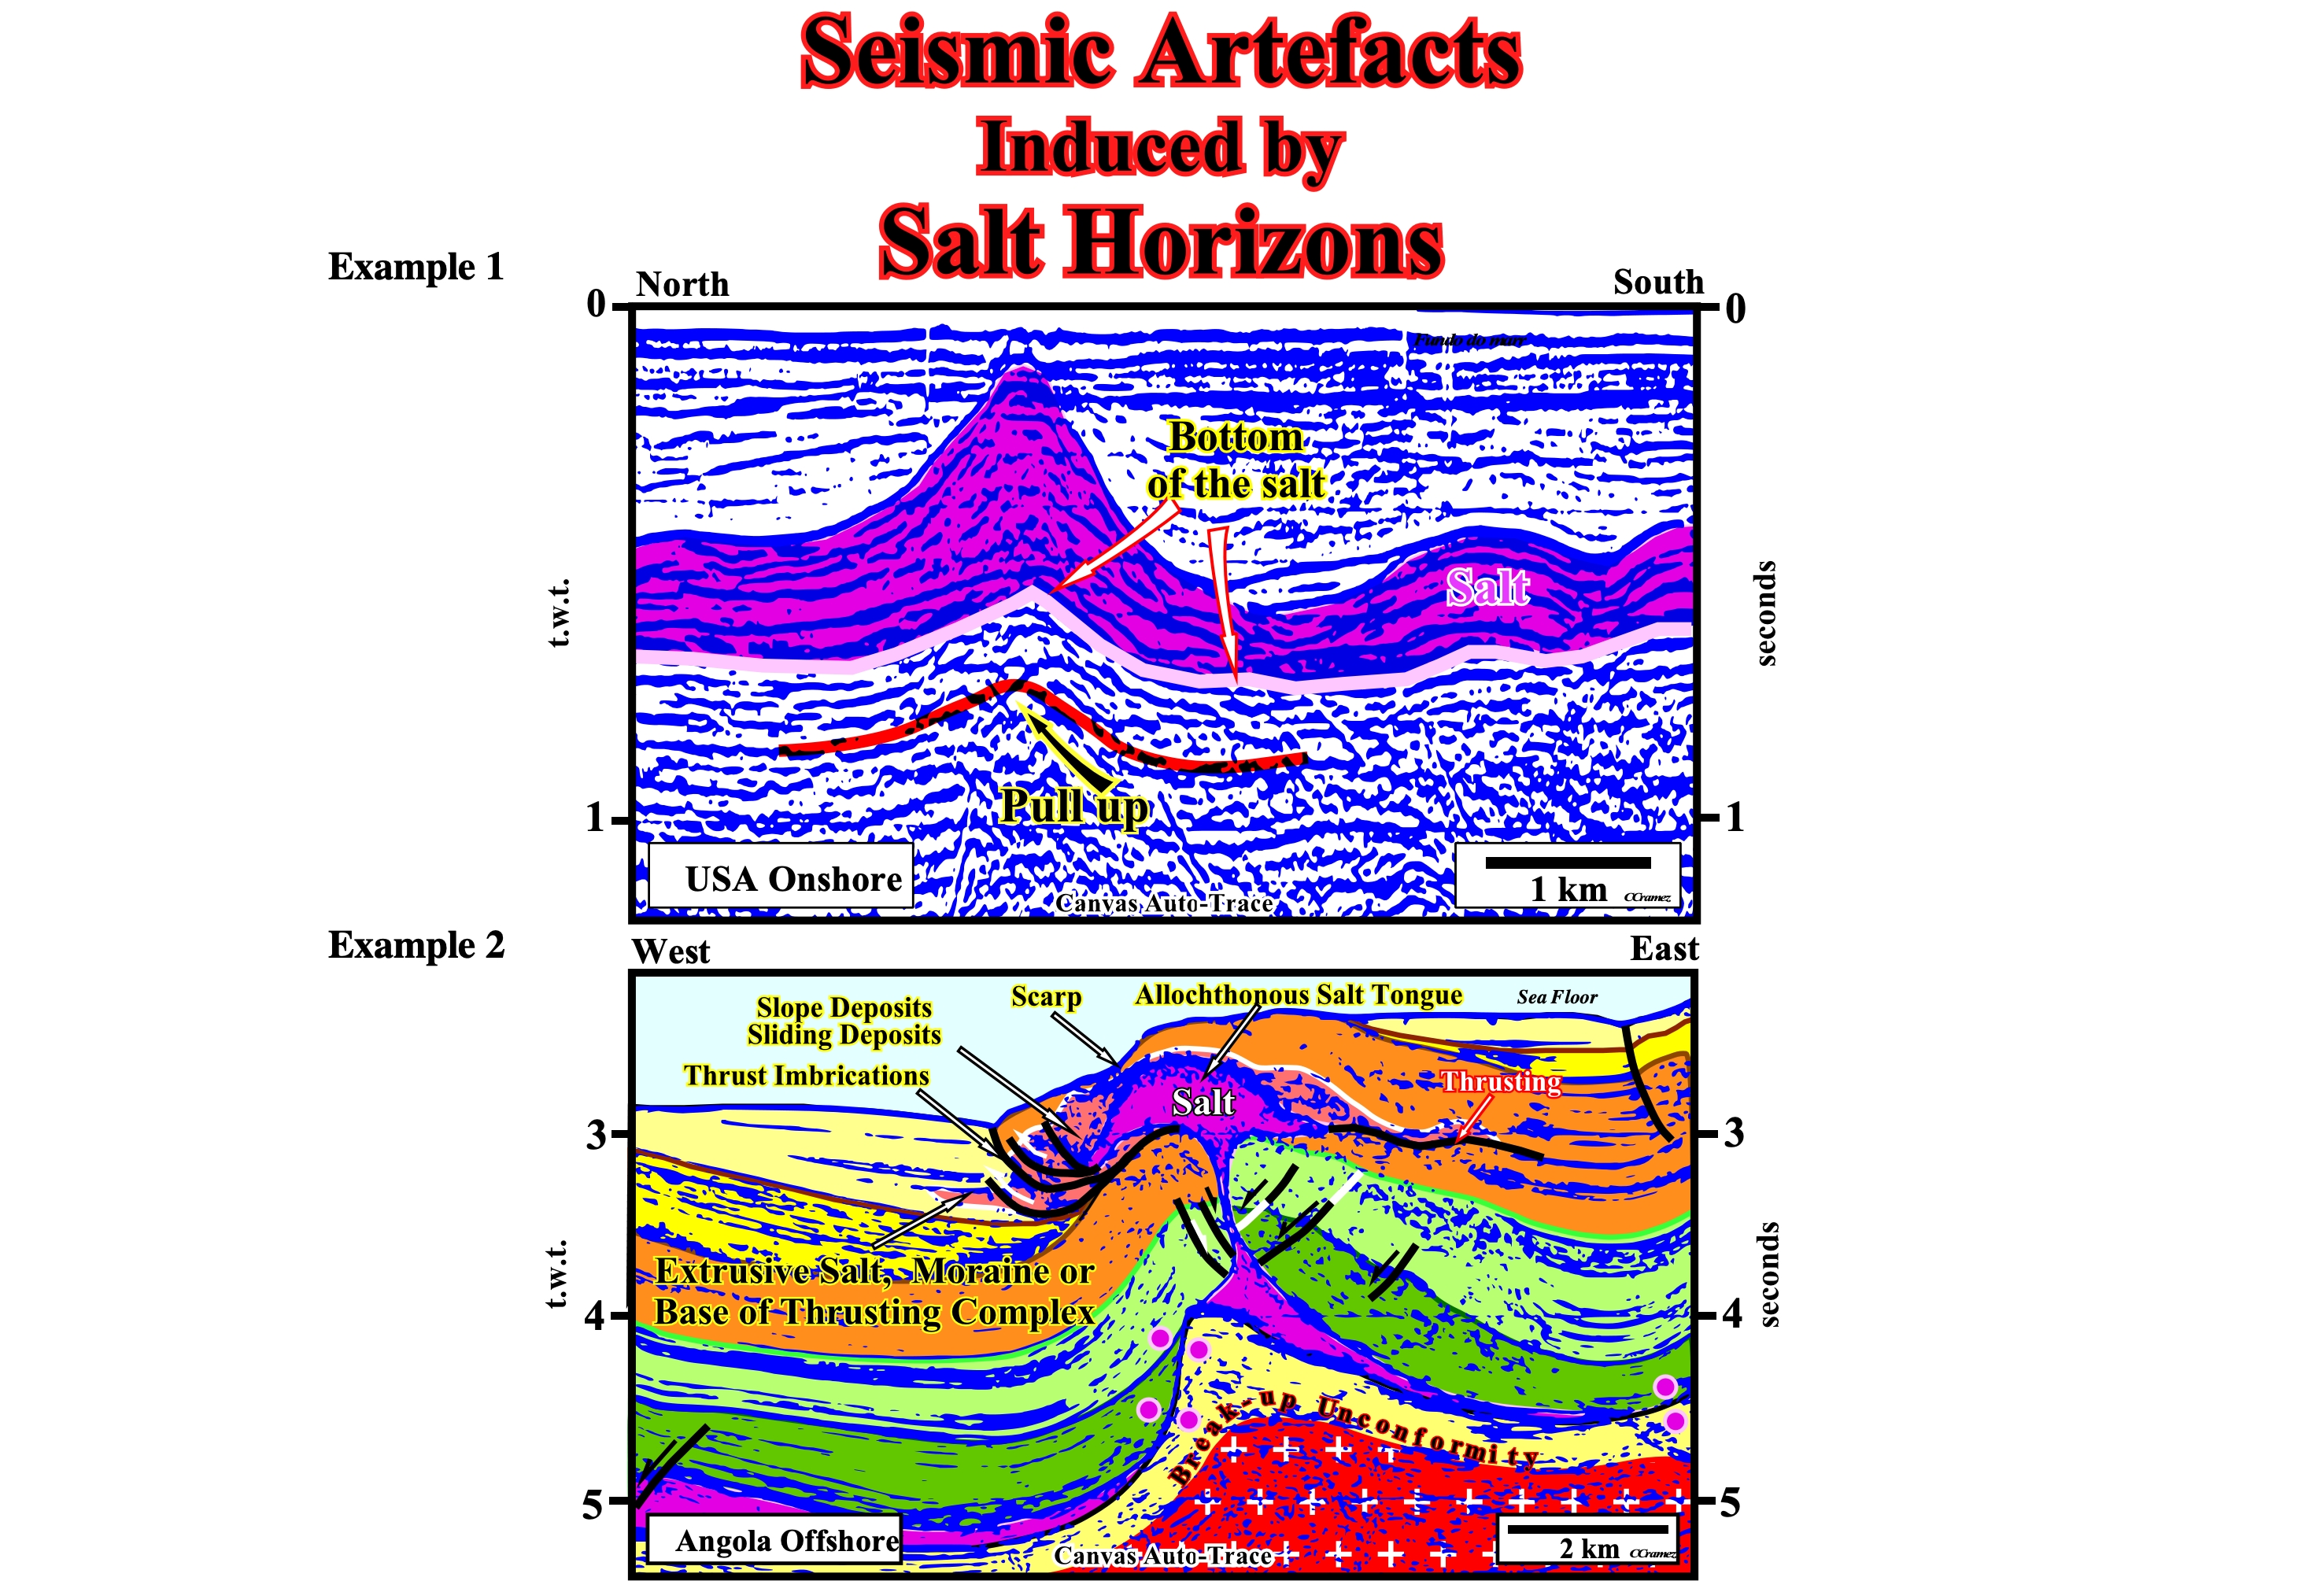
Figure 113- The tentative geological interpretation of the seismic line of Louisiana (USA) onshore illustrates the seismic artifacts induced by an non-isopachous evaporitic interval. The bottom of the salt is pulled up, where salt interval is thicker. The seismic waves traveling through an interval with high velocity and thicker (± 5.000 m / s) spend less time, so that, the bottom of the salt is pulled up. The same happens on the seismic line of Angola offshore, in which the salt fossilized by onlapping a step of infrasalt sediments, which means that the bottom of the salt was never isochronous.