

Seismic Artifacts in Geological Interpretation of Seismic Lines
1) Canyons
Submarine canyons (with substantial water depth) produce, on seismic lines, significant lateral variations in the interval velocity, since the seismic waves travel faster in the sediments than in water. As a result, on a seismic line (in time section), the seismic horizons under a submarine canyon are pulled down (Figures 114 & 115), since the seismic waves spend more time to cross the water than the sediments. Geoscientists in charge of the tentative geological interpretation of seismic lines should take account of these pitfalls.
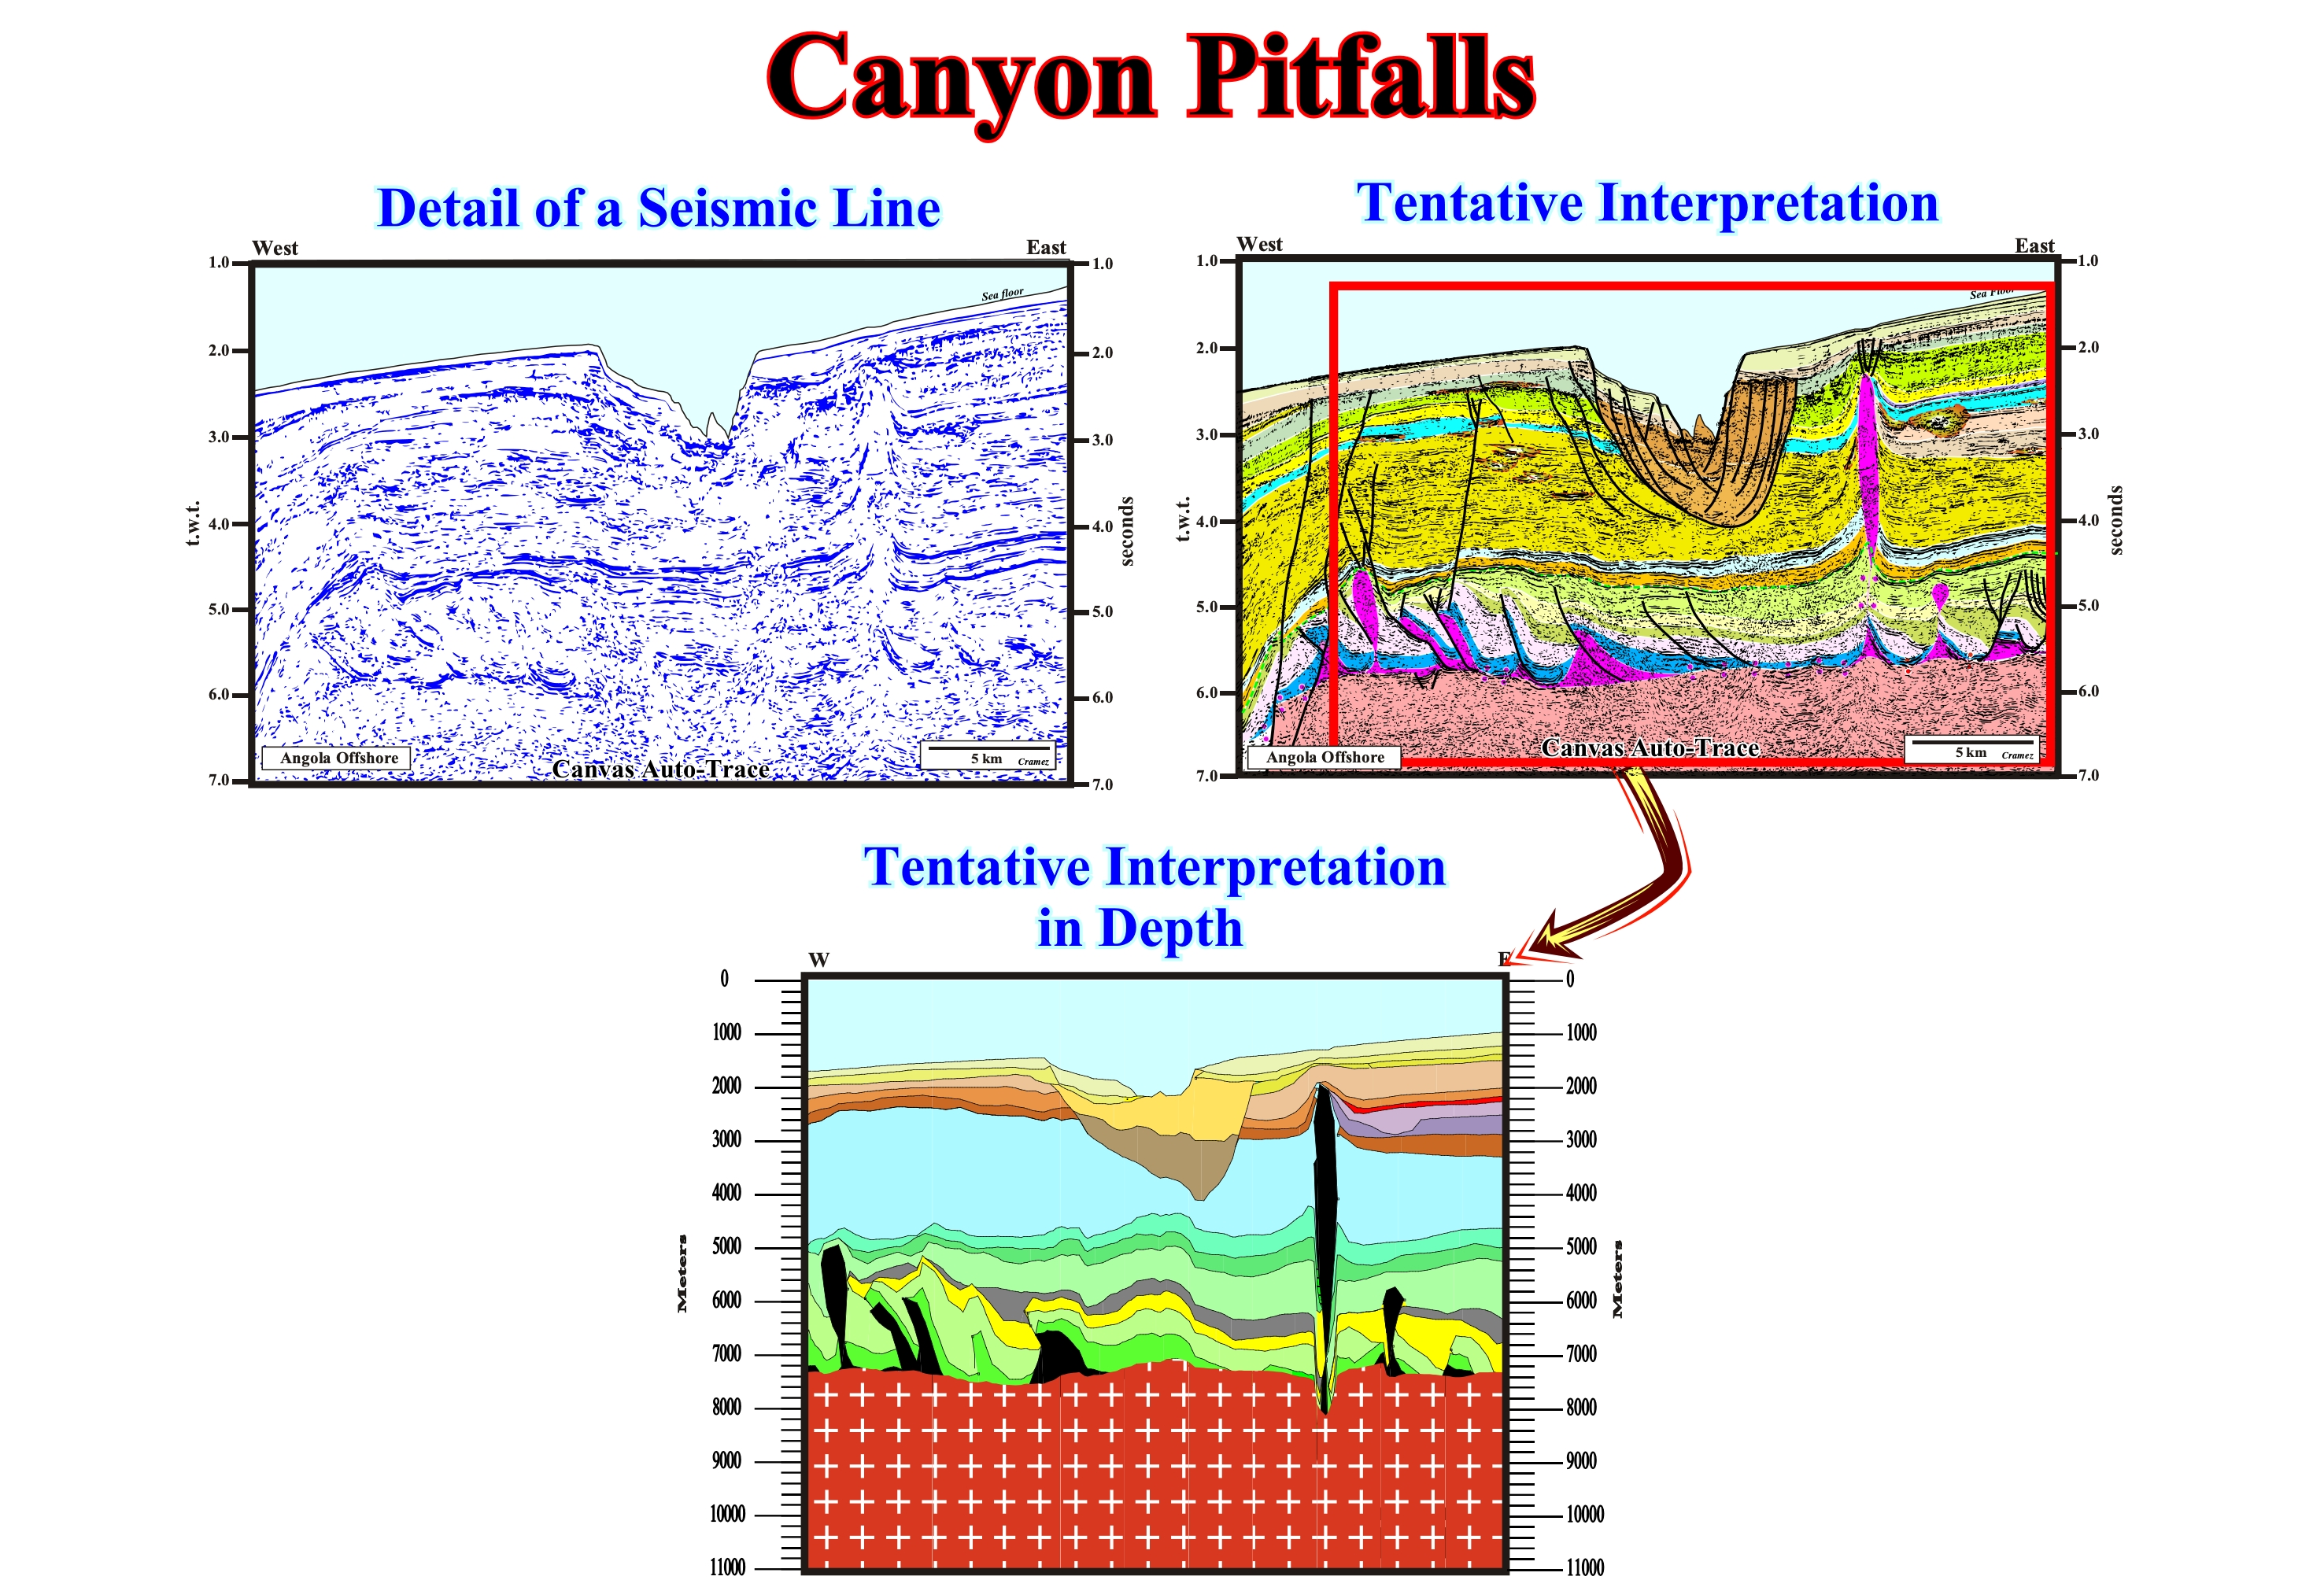
Figure 114- In the detail of a seismic line from the North Angola offshore (top left), the submarine canyon of the Congo River is recognized, immediately, by the increasing and sharp decreasing of the depth of water, which, regionally, increases gradually westward. The term submarine canyon is, here, used as a synonym for underwater ravine, that is to say, a steep valley located on the seabed of the continental slope and not to designate the infilling of a submarine canyon, as it is considered, often, by certain geoscientists of the oil companies. On seismic lines, theoretically, such a variation in depth of water will, naturally, pull down all horizons who are under the base of the canyon. However, as can be seen in the tentative interpretation (the interval in violet corresponds to the evaporites), the downward pull of the horizons below the submarine canyon is not very evident. In reality, the pull-down induced water depth of the submarine canyon must also be added to the pull-down induced by the sediments of the former infilling of the Congo (well marked in this tentative interpretation), since the sediments that fill the old canyon (colored in brown in this tentative) are less compacted than the sediments eroded from the canyon. So, the main question is to know why the pull down is not seen on seismic line. The depth tentative interpretation of seismic line, as proposed in the bottom of the figure (the salt corresponds to the black interval), strongly suggests that prior to formation of the submarine canyon, locally, the sediments were shortened, i.e., raised, which, practically, nullifies the induced downward pull. This local uplift is, most likely, associated with late reactivation of the fault bordering a rift-type basin within the continental crust (white crosses on red background). The rift-type basin is not visible in the tentative interpretation since just the sediments posterior to the breakup of the Gondwana were taken into account in the interpretation.
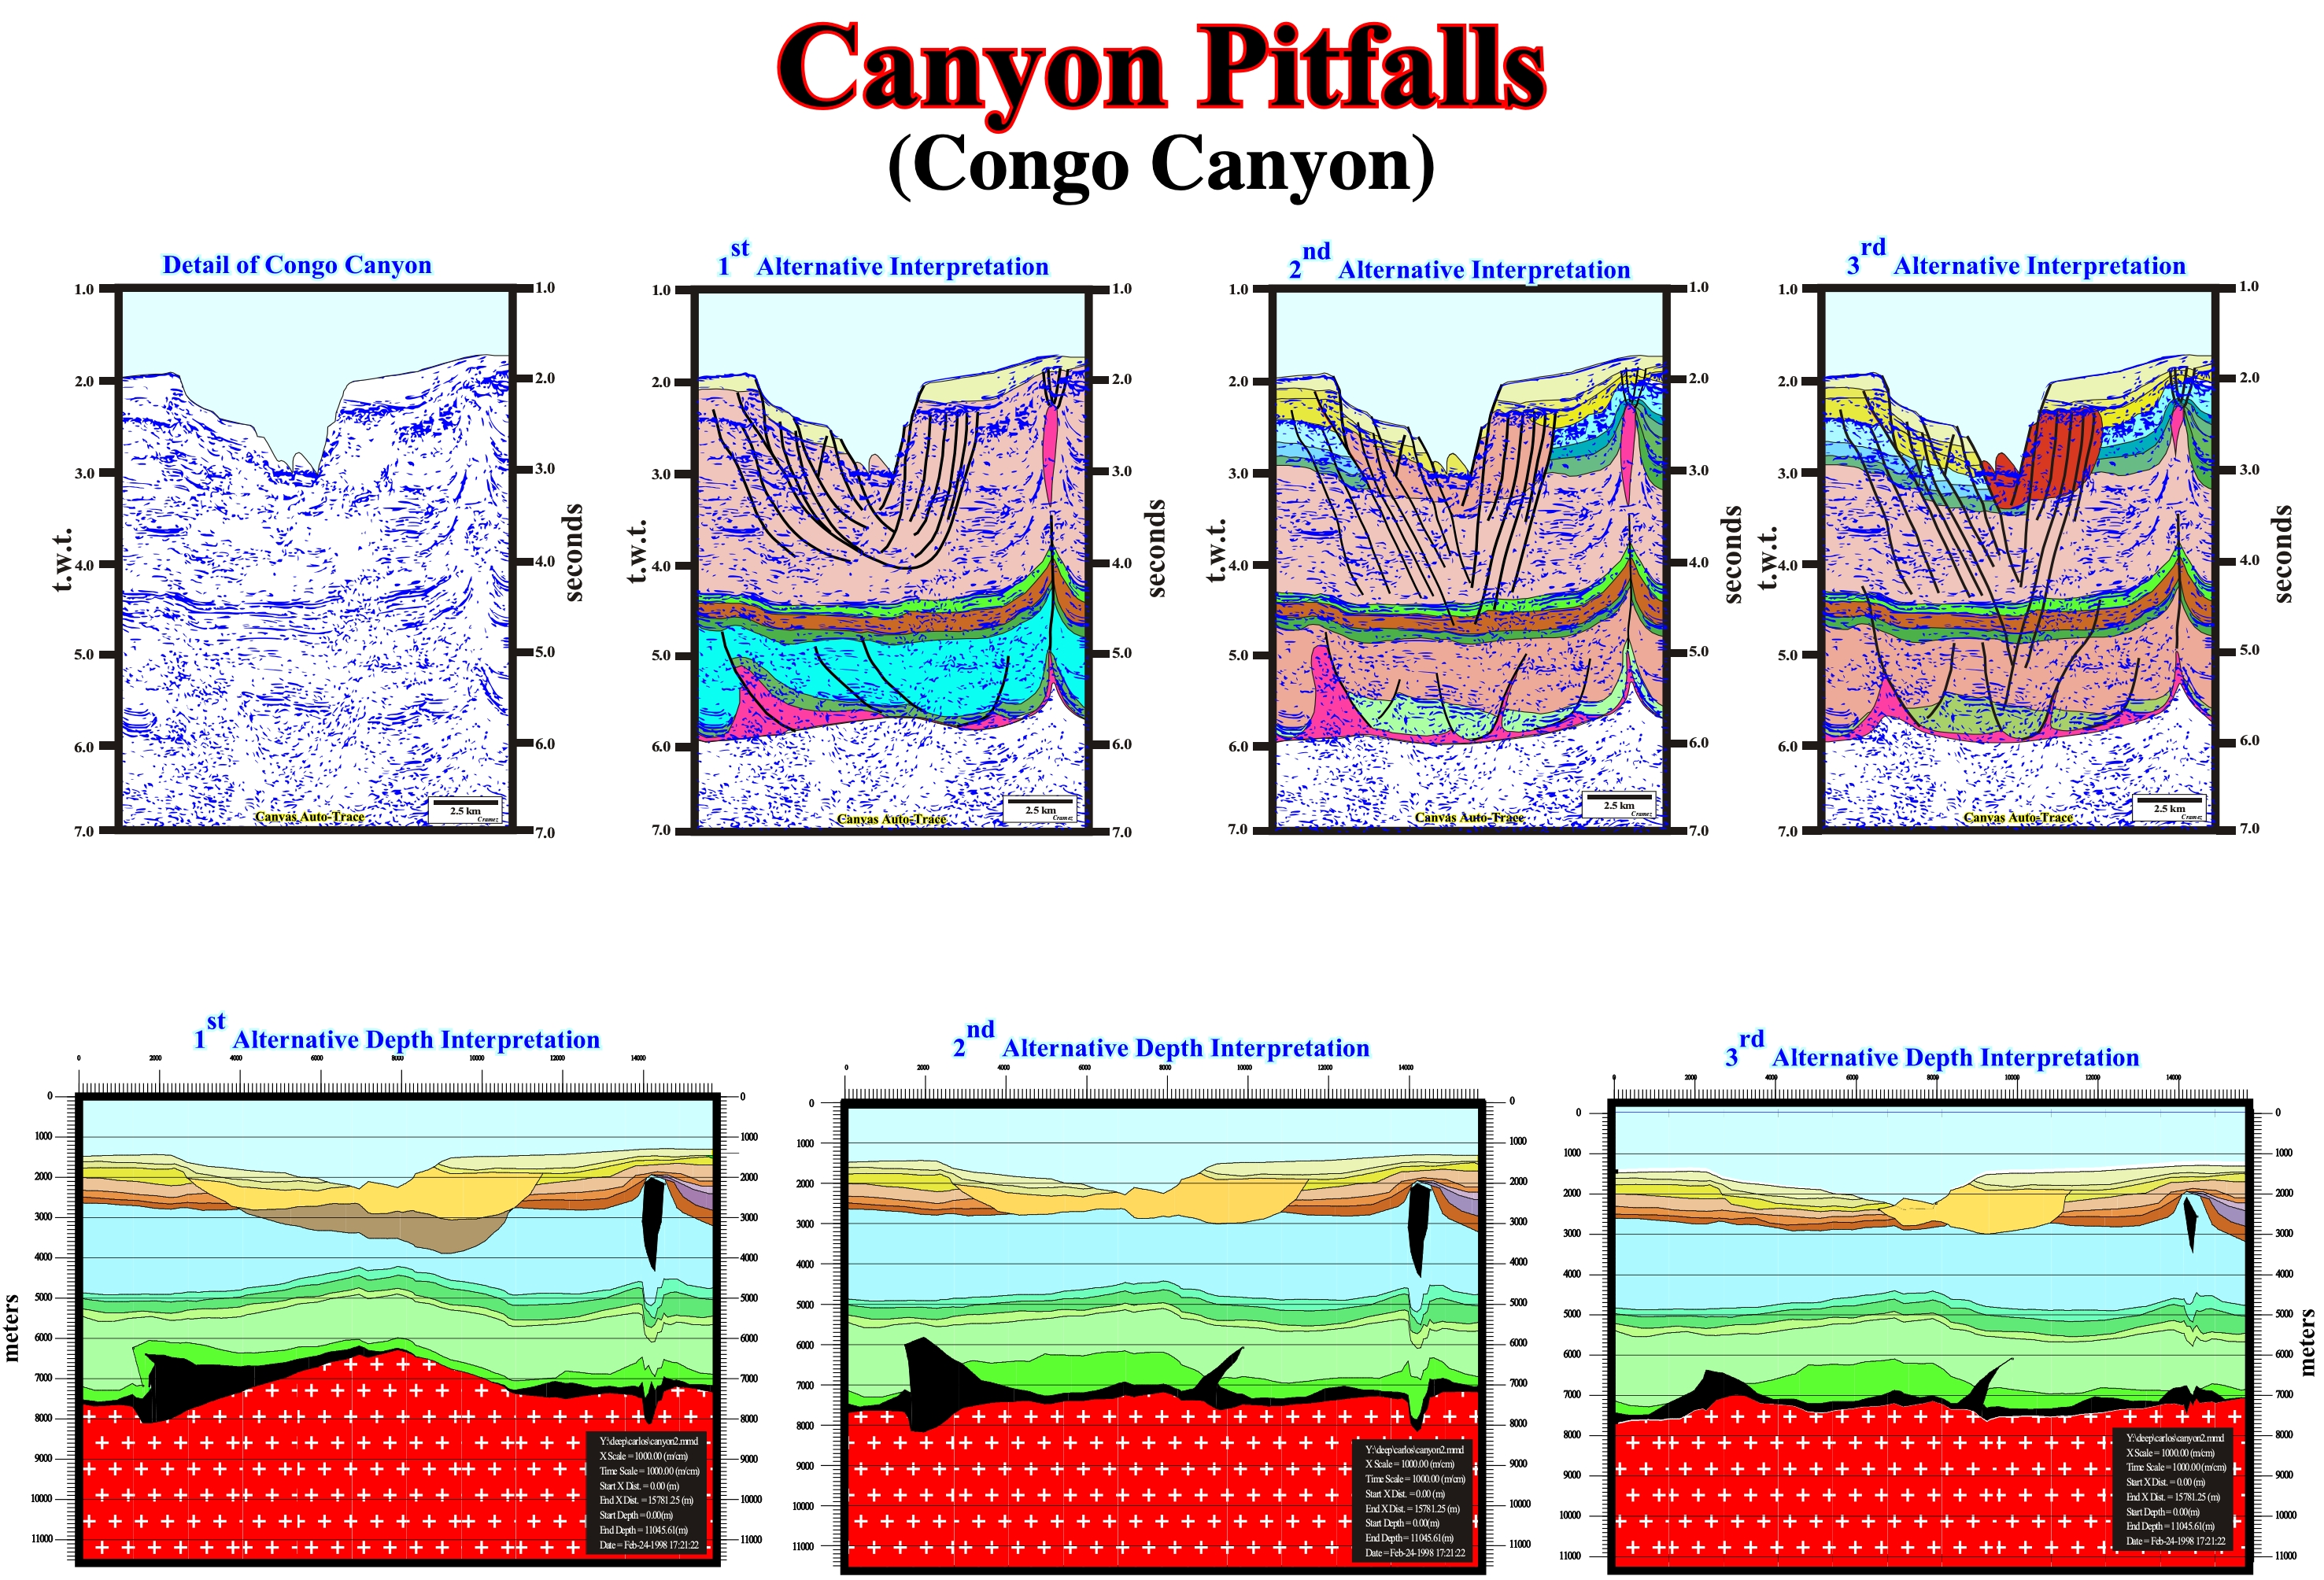
Figure 115 -Using more or less, the detail of the seismic line of the previous figure, three tentative geological interpretations of the sediments of divergent margin are proposed (the continental crust, in red with white crosses, may contain rift-type basins). The big difference between the tentatives proposed is, basically, in the model adopted to explain the formation of the submarine canyon. The hypothesis of a canyon created, solely, by erosion of a stream not controlled by the tectonic and with a very thick infilling is, by far, the most refutable by the depth conversions. The other two hypothesis, in which the tectonic has a very important role in the creation and development of the canyon are more likely, i.e., less refutable. The depth conversions interpretation of the three tentatives are, relatively, similar except in the amplitude of the uplift of the sediments under the canyon. In the depth conversion of first interpretation, the uplift of the continental crust and the margin of sediments is very exaggerated (± 800 m). This means that the thickness of the old canyon of Congo is smaller than that considered by the geoscientist in charge of the interpretation.
2) Canyons & Reverse Faults
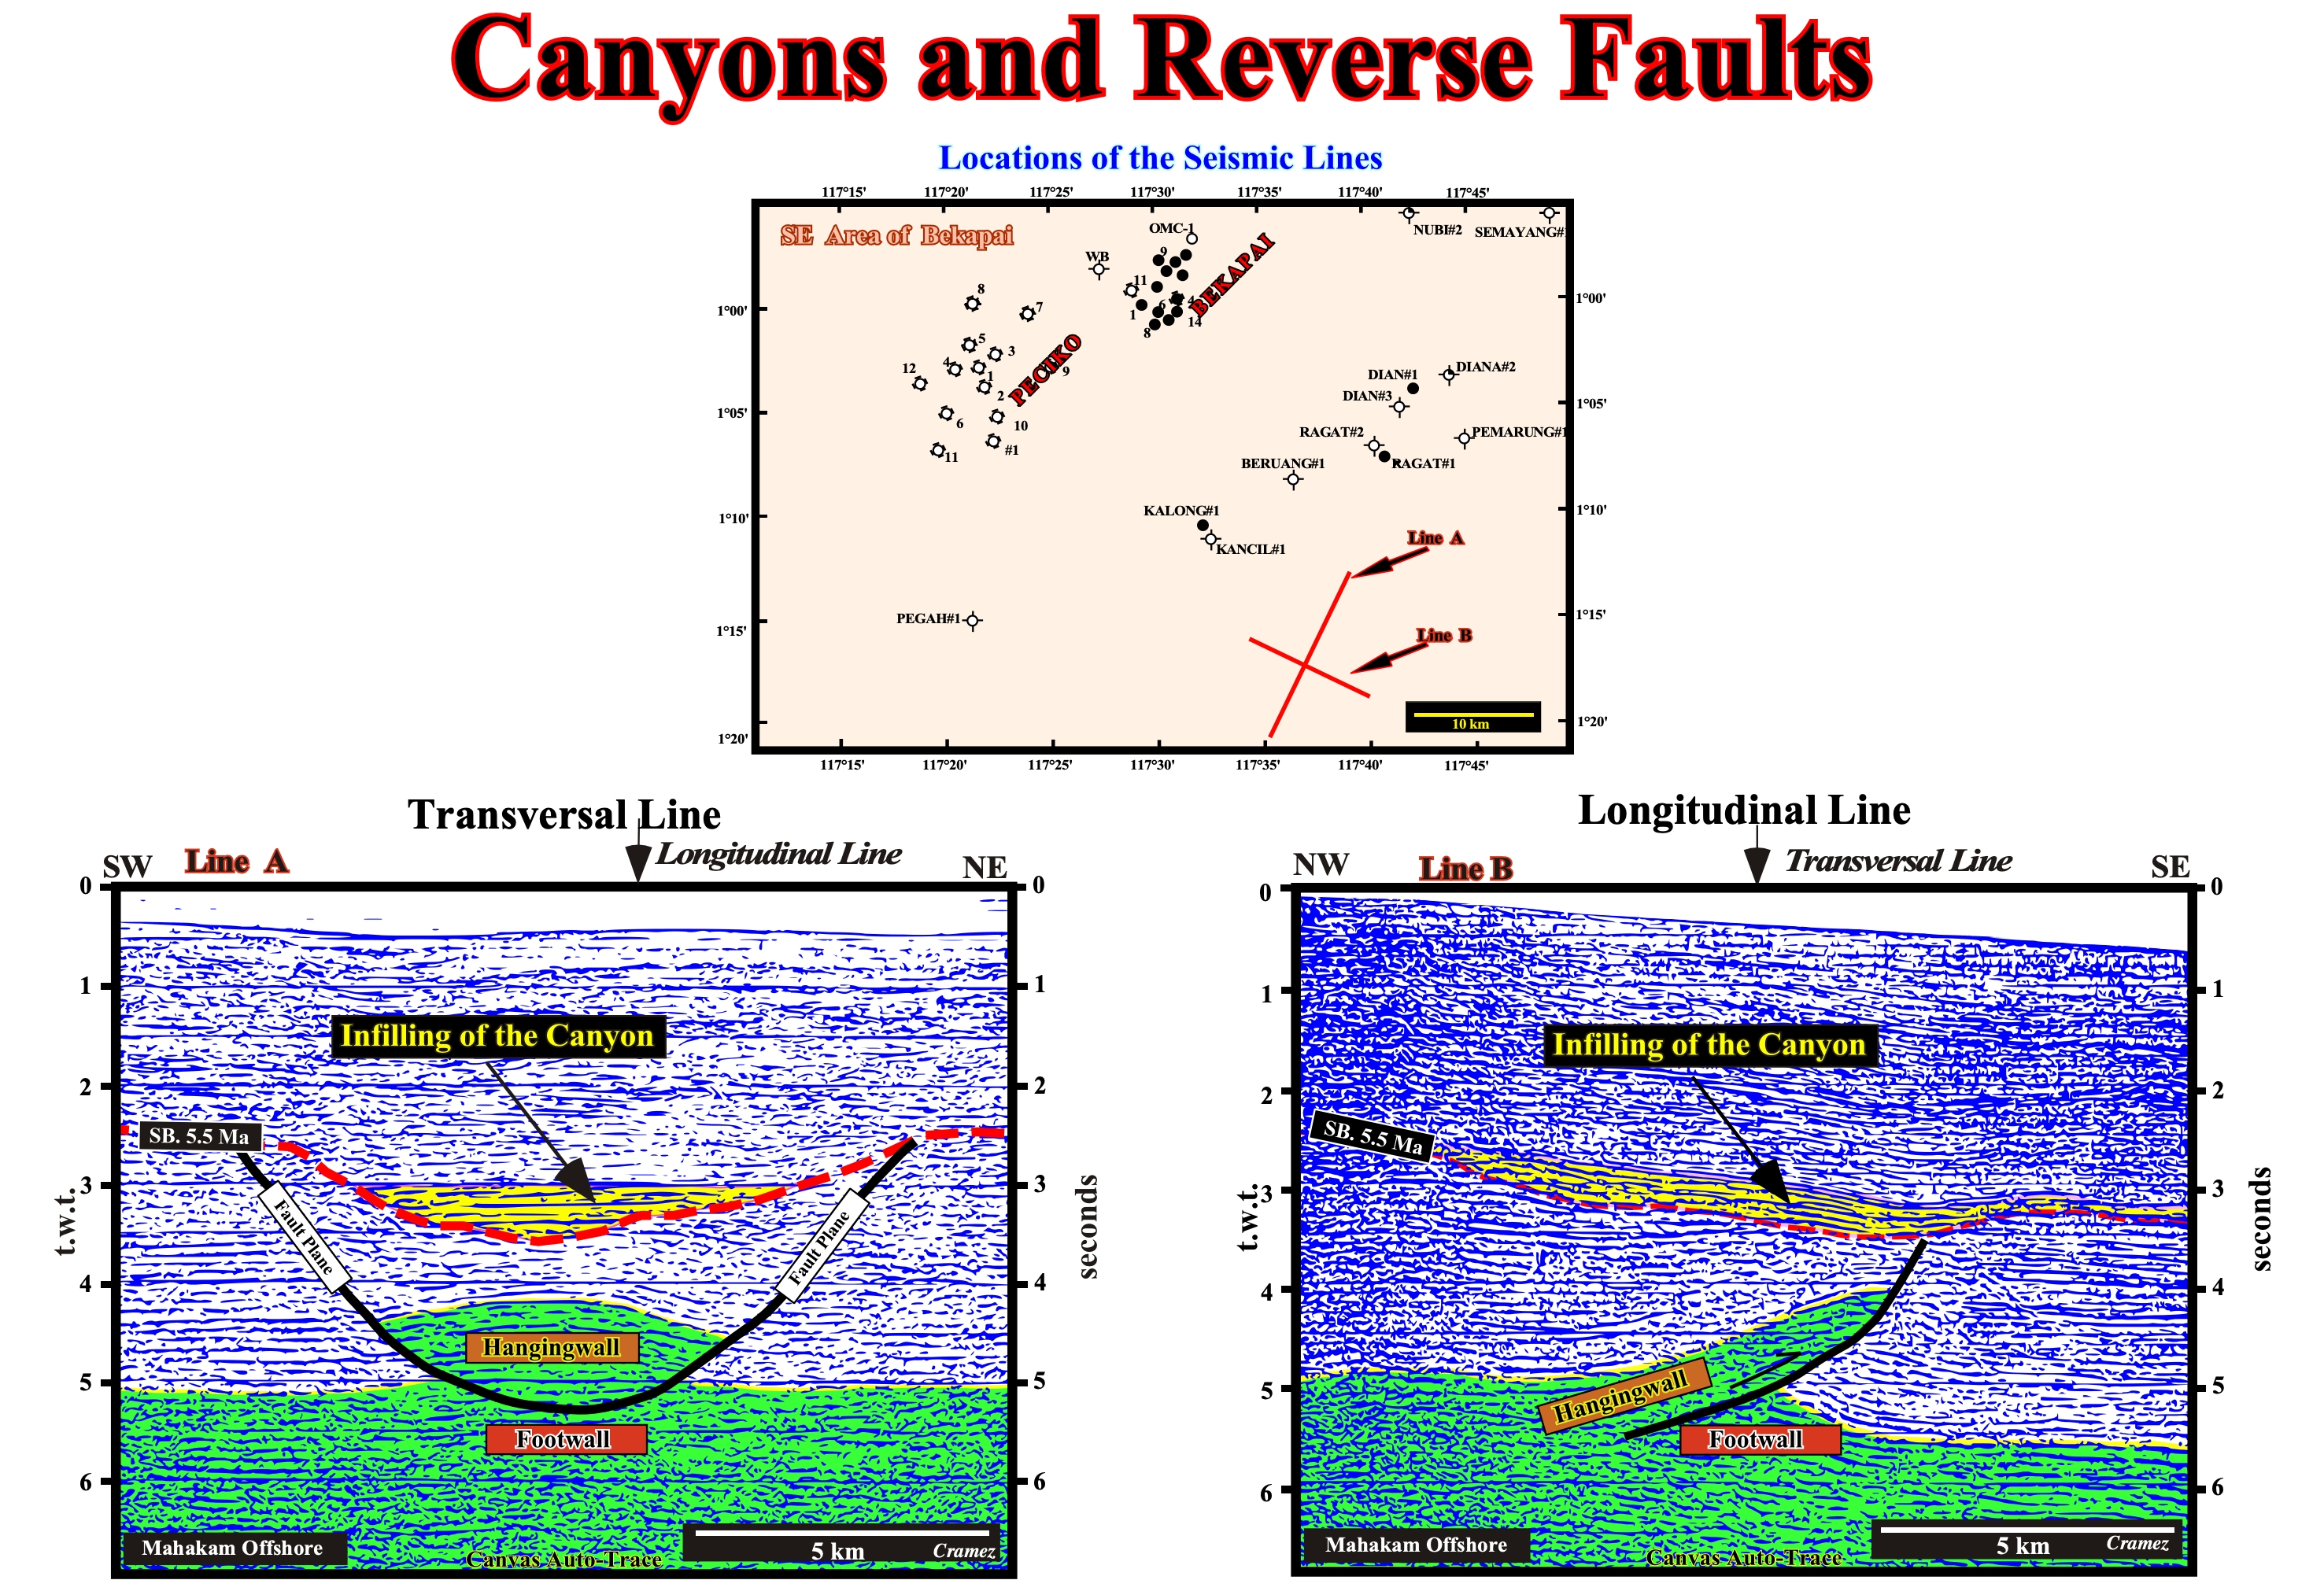
Figure 116- As illustrated in the location map (Indonesian offshore), the seismic lines, tentatively interpreted in this figure are perpendicular. Such orientation of the lines, often, prevents misinterpretations since the geological interpretation of one of the lines is a falsification test of the other and vice versa (falsification in the sense of K. Popper). In seismic line A, oriented SW-NE, which is the longitudinal to the tectonic structures of the area, it is easy to pick a tectonically enhanced unconformity (SB. 5.5 Ma, red). This unconformity is characterized by the presence of onlaps above it and toplaps below. This unconformity is nothing else that the erosional surface resulting from the uplift of the shortened sediments by folds and reverse faults, that exposed some of them to the erosive agents. In fact, the sediments were, deeply, eroded, since a submarine canyon was formed and later filled, probably the upper sediment of the lowstand prograding wedge (yellow) of the next sequence-cycle whose lower boundary is unconformity. The sediments predating the unconformity were, locally, shortened by a reverse fault that is, more or less, evident. As the reverse fault fault is cut, longitudinally, by the seismic line, the fault plane is concave upward with the hangingwall occupying the concavity. The hangingwall is, of course (Theory precedes Observation), much more deformed than the footwall. The tentative geological interpretation of the seismic line B, oriented NW-SE, i.e., perpendicular to line A, supports fully, the tentative interpretation of the line A. In fact : (i) The unconformity SB. 5.5 Ma (dated by the nearby exploration wells) is well marked by downlaps of the sediments postdating the unconformity which in-filled the old canyon and by the toplaps (truncation) of the sediments pre-unconformity ; (ii) The sediments of the hangingwall are shorter than those of the footwall ; (iii) The erosional surface (SB. 5.5 Ma) truncates, significantly (± 500 milliseconds t.w.t.), the sediments pre-unconformity forming a submarine canyon ; (iv) After a hiatus, more or less, importantly, during which it were deposited, in the deep part of the basin (SE of this line), basin floor fans, slope fans and the lower part of the lowstand prograding wedge. The submarine canyon was filled by the upper sediments of lowstand prograding wedge, which were fossilized either by the upper sediments of lowstand prograding wedge or by the onlapping of the sediments of the transgressive systems tract.
3) Faulting, Salt Evacuation, Tectonic Inversion
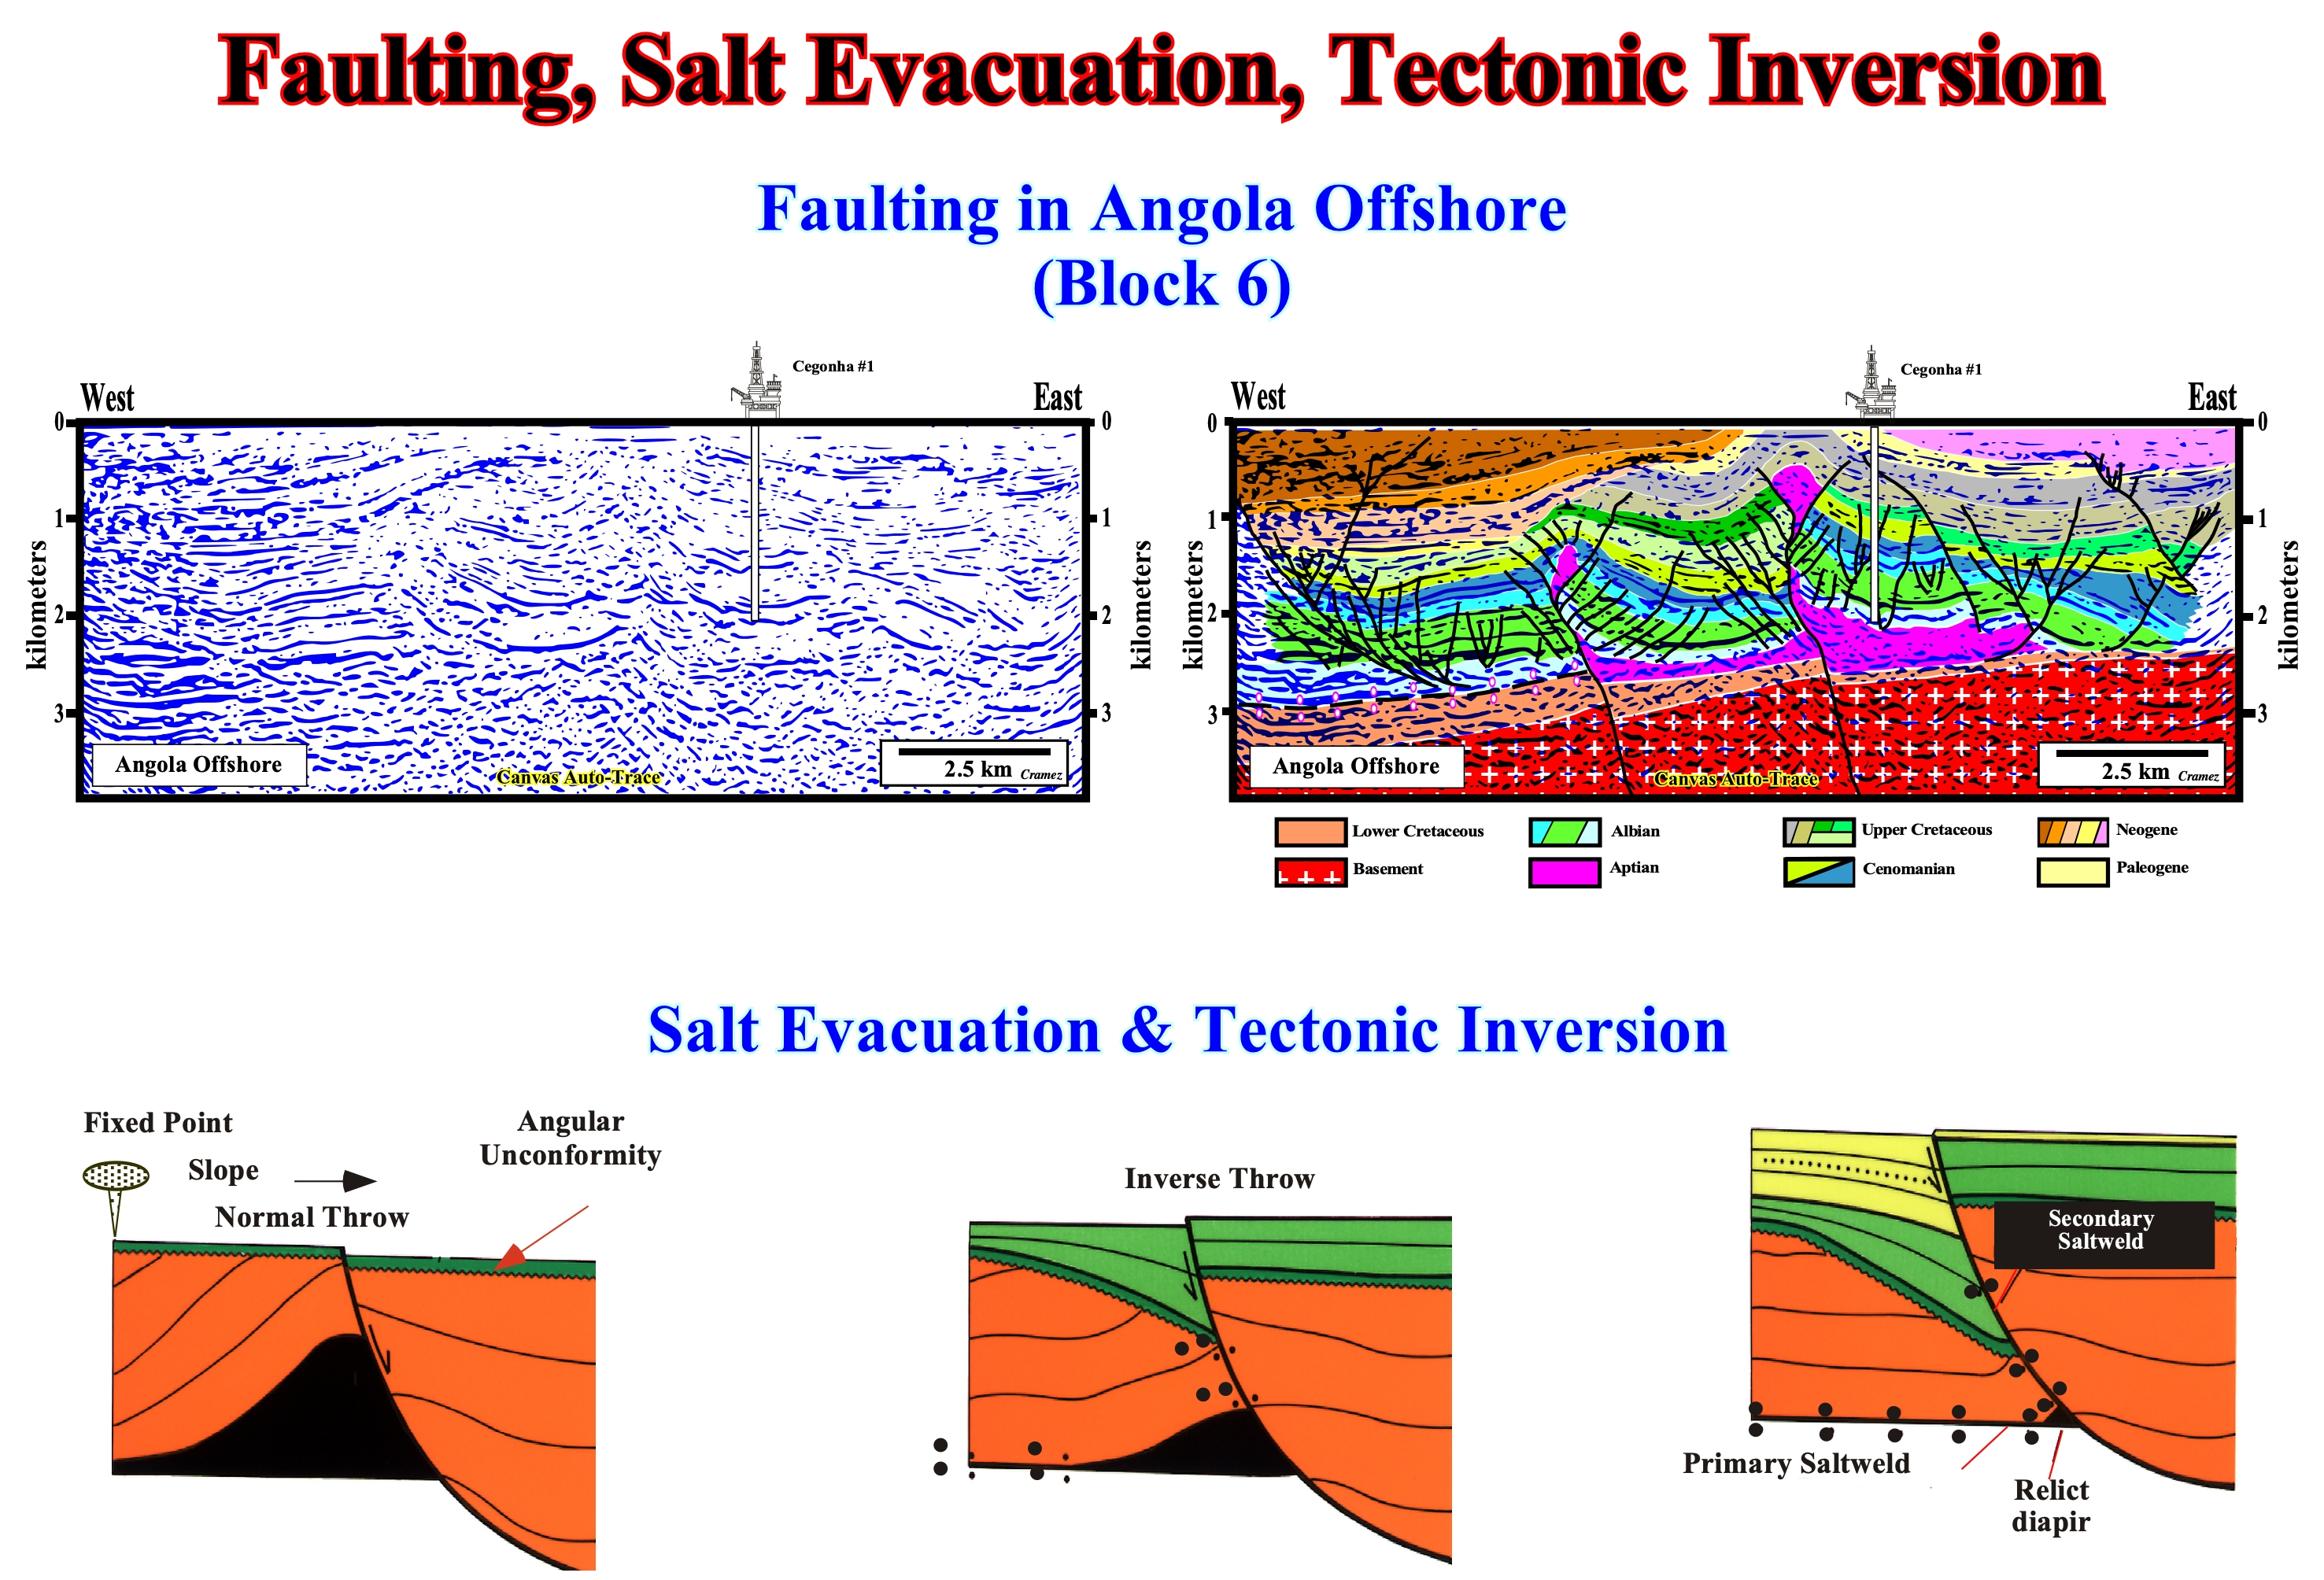
Figure 117- The depth migrated version of an old 2D line of the Kwanza offshore (block 6) allows tentative geological interpretations that have little to do with the proposed interpretations, in the 80s, to locate the well Cegonha-1. In fact, the quality of the reprocessed seismic line, shown above, allows not only to notice, that in all tentative interpretations of old data, interpreters put, always, too most salt (do not forget that the Cegonha-1 well was drilled to test the reflection terminations against a salt dome with vertical walls), but, also, corroborates certain halokinetic geological models (proposed to explain evacuation structures and tectonic inversion induced by salt movements. The geological model proposed above is very interesting. He explains not only how primary and secondary salt-welds are formed, but, above all, how an extensional tectonic regime (sigma 1vertical) can form normal faults with a reverse fault geometry (when a mobile evaporitic interval is present in the sedimentary column). In fact, from the sketch on the left, in which a normal curvilinear fault has a salt diapir at the base of the footwall, a partial evacuation of the salt creates a small salt-welds, while the overburden moves downward producing a reverse throw (geometry of a reverse fault) and a secondary salt weld. Finally, a salt evacuation, practically total, of the salt of the footwall increases, considerably, the reverse throw and the growth of the salt-welds.
4) Age of Faulting in Salt Basins
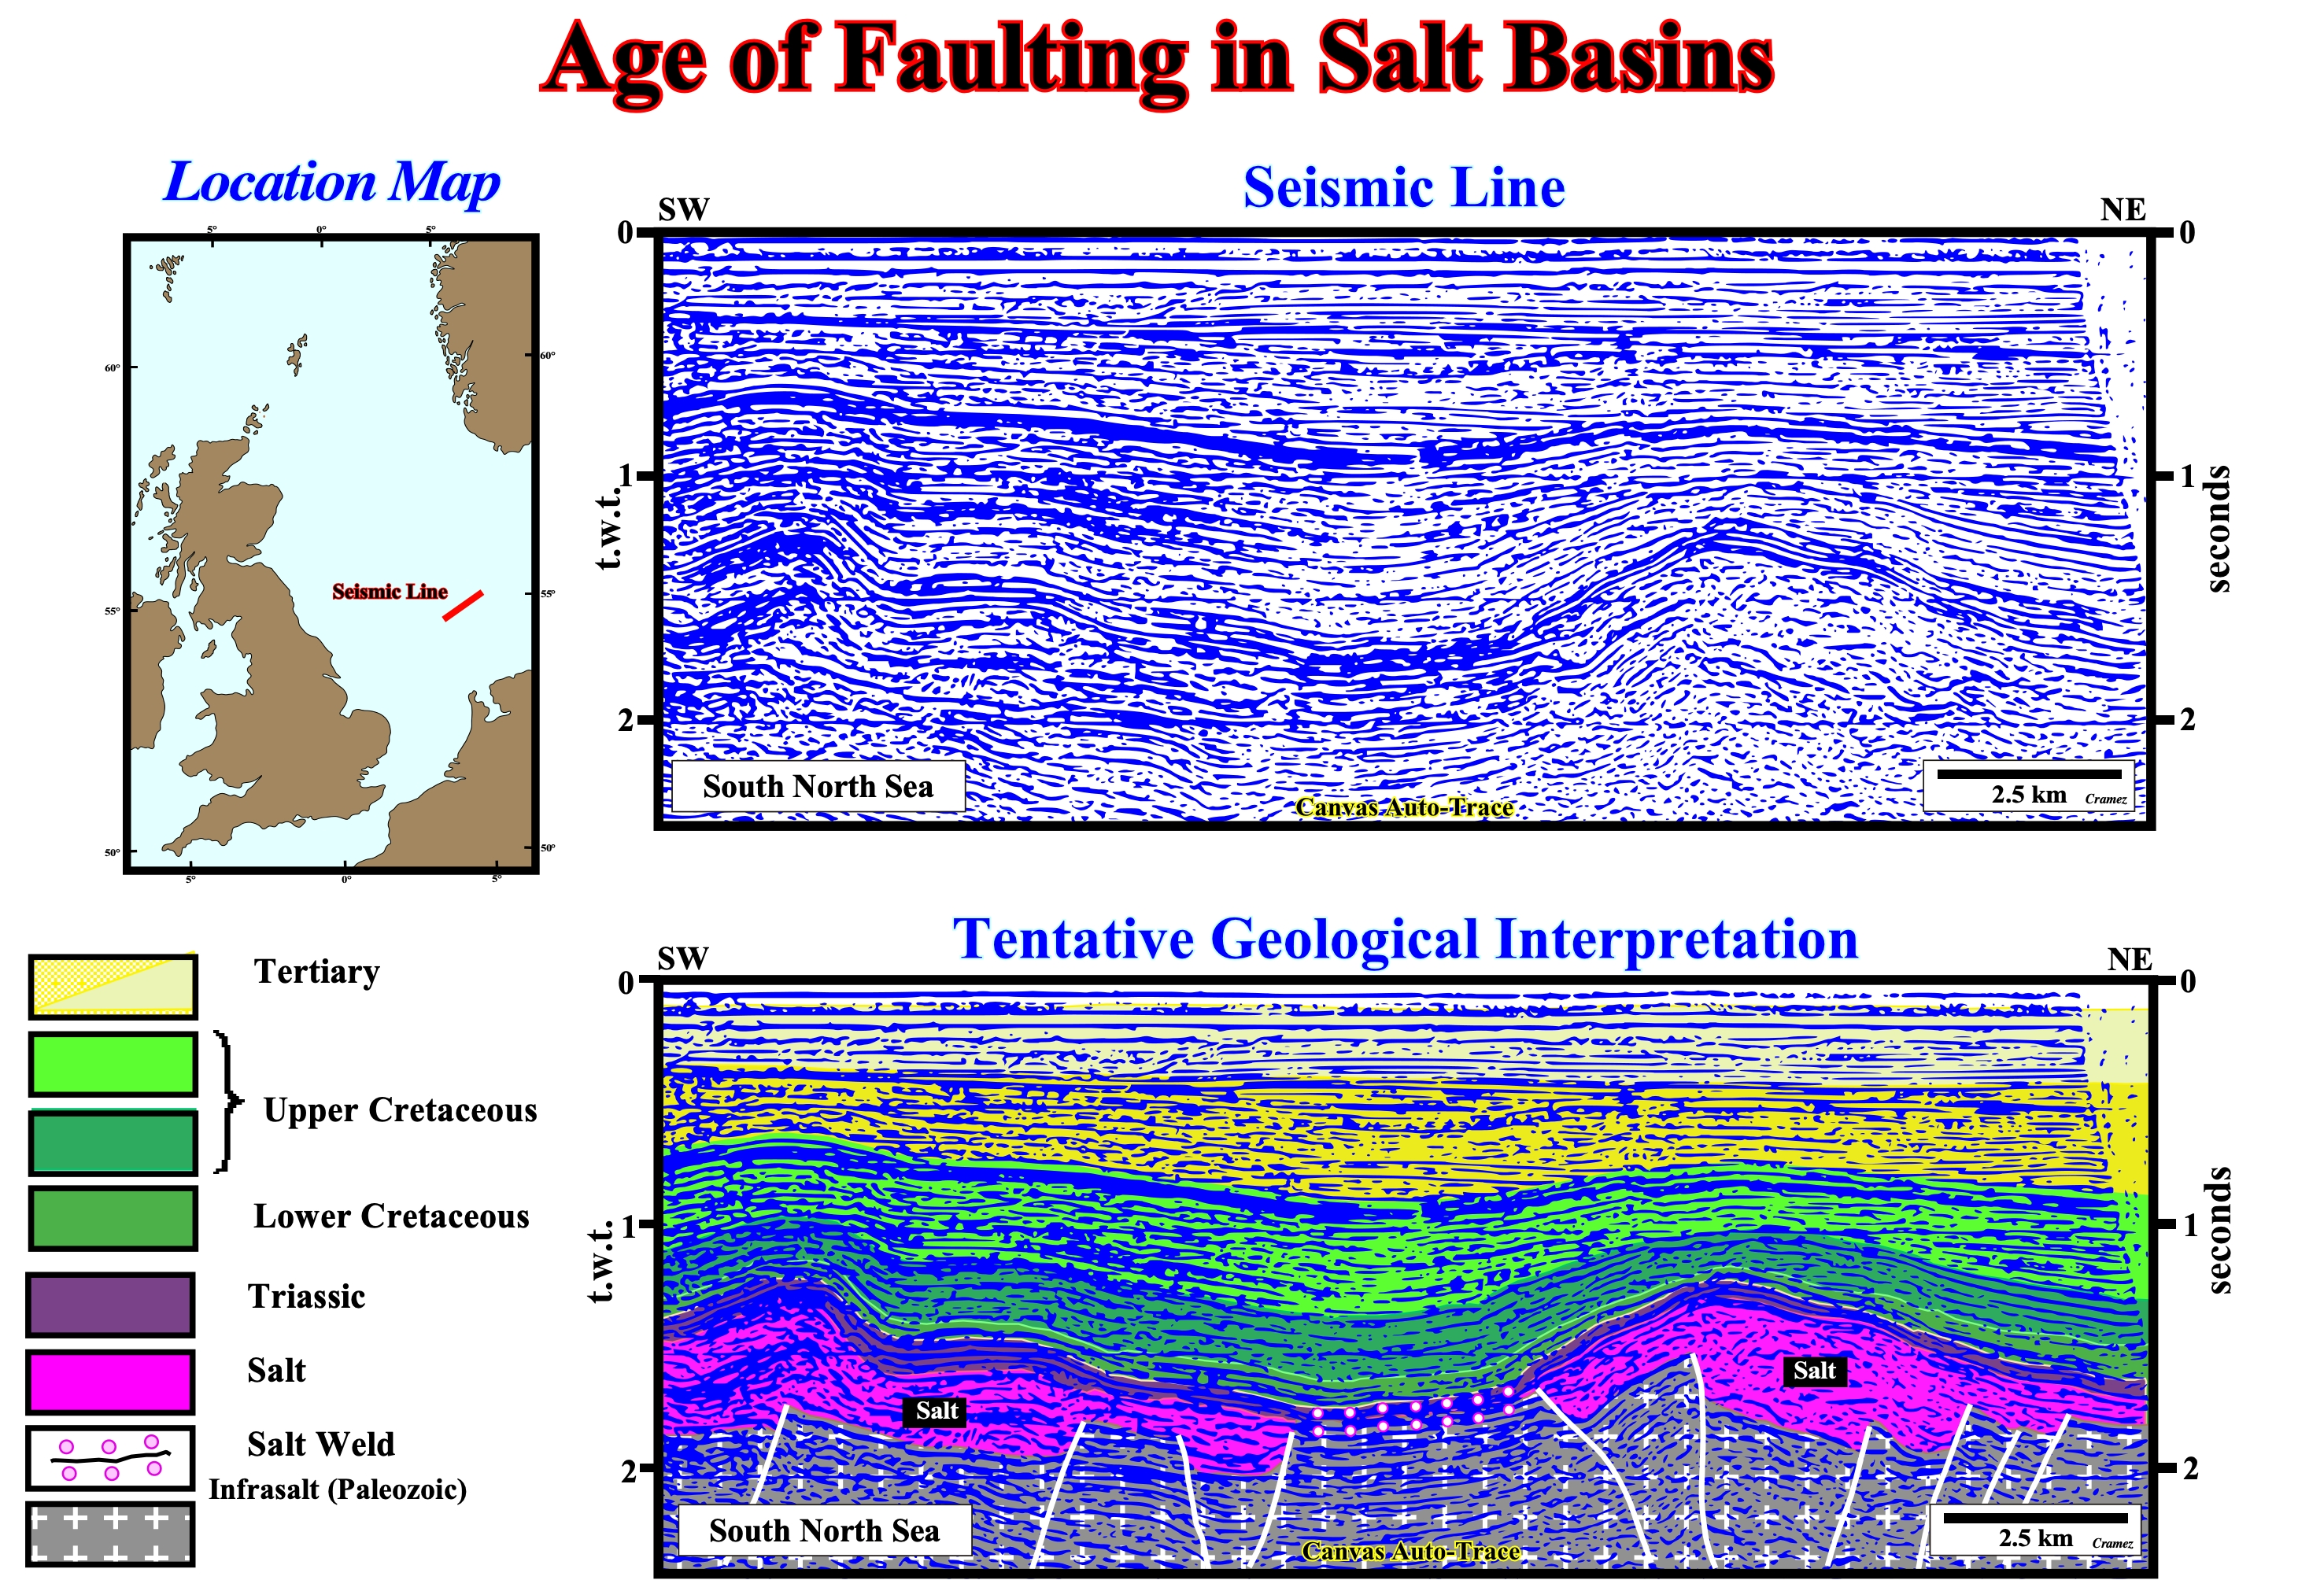
Figure118- In this tentative geological interpretation of a seismic line from the Southern North Sea, several questions are put to geoscientists : (i) Are the salt depocenters rift-type basins ? (ii) What is the age of faults ? (iii) Are the normal (lengthening) or reverse (shortening) ? (iii) How to explain the thickness variations of Upper Cretaceous green intervals ? The deformation postdates or predate salt deposition ? Taking into account that the shortening of sediment was quite late (no great interest for petroleum exploration), from all these questions the most important , which partly explains the others, is know if the length of the sediments was done before or after the deposit salt. These two hypotheses must be tested ( criticized), since they have very different consequences in oil exploration. Knowing that the basin, where this seismic line was shot, the hydrocarbon migration took place during the Late Cretaceous (during the deposition of top green intervals), geoscientists must recognize pre-Cretaceous traps to have a small probability of finding a hydrocarbon accumulation. Using this seismic line, geoscientists have to determine the age of the faulting, since the most likely infrasalt traps are no-structural, but rather morphological by juxtaposition.
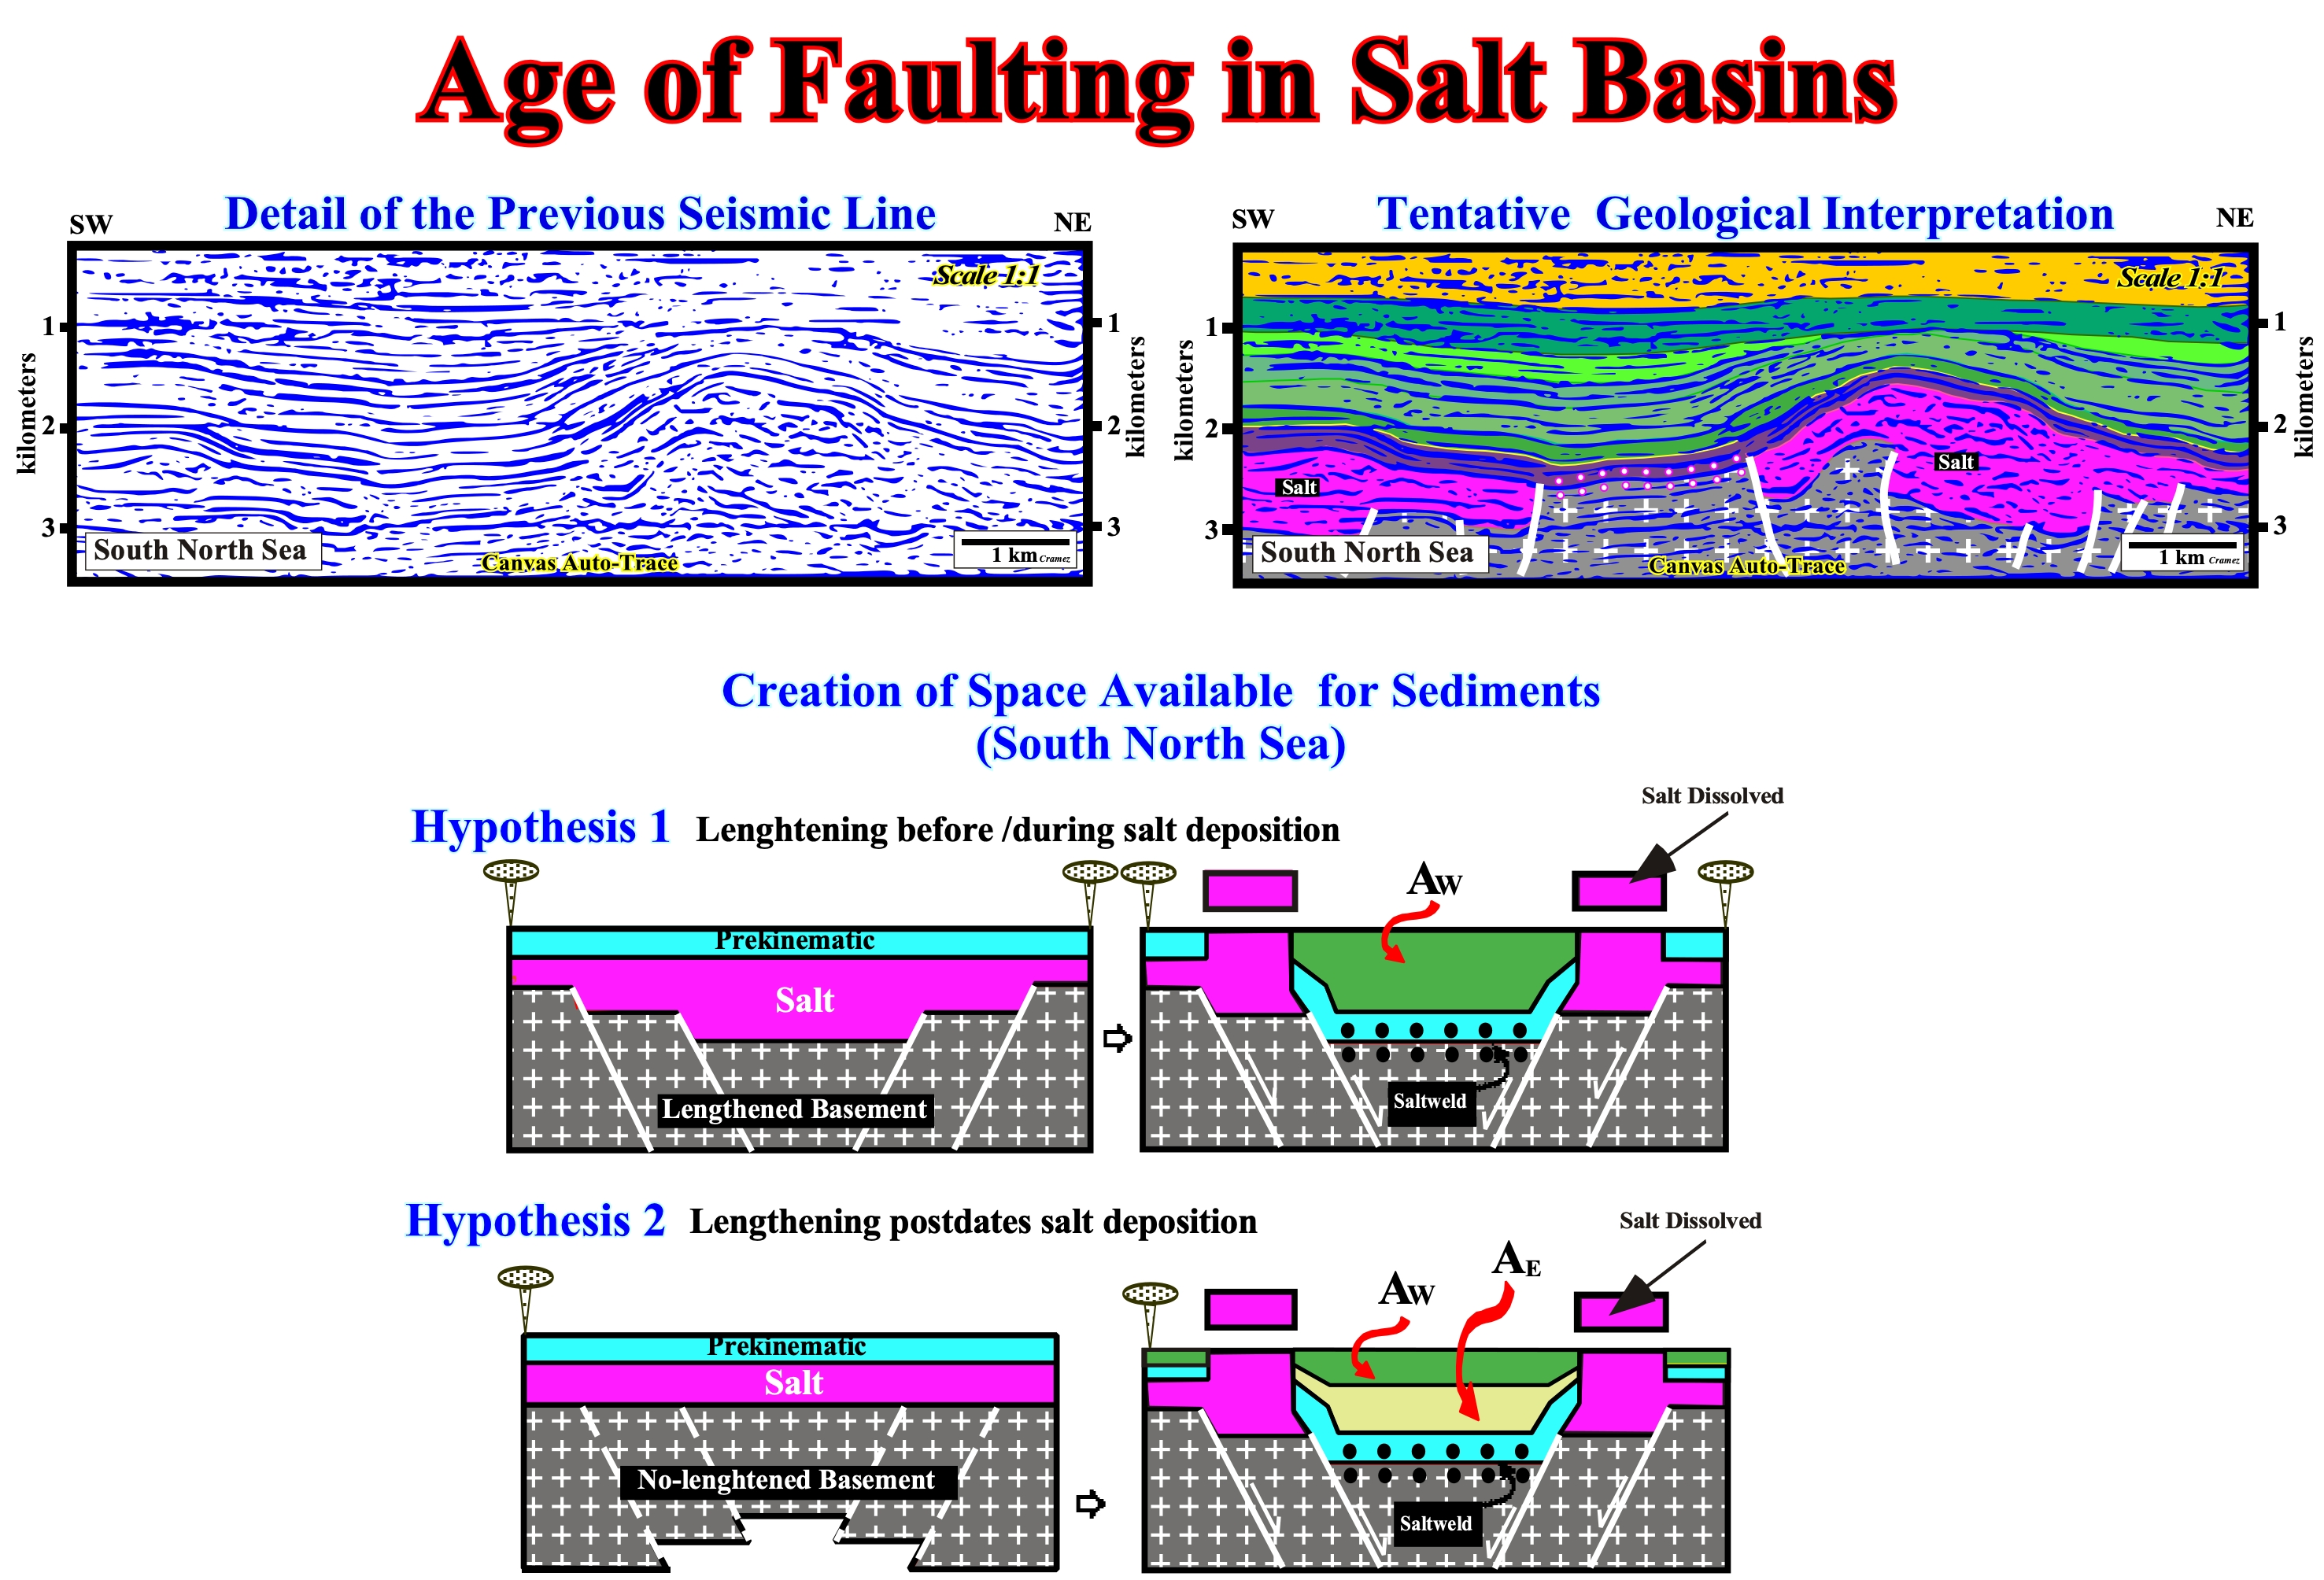
Figure 119- Above, a tentative geological interpretation of a depth migrated version of the seismic line illustrated in the previous figure, in which the geoscientist have to decide whether the morphological traps by juxtaposition have or not a potential petroleum interest. As said previously, two geological hypotheses are possible. In hypothesis 1, lengthening (extension or elongation) took place priori or during salt deposition ; The salt filled grabens or halfgrabens created by lengthening of infrasalt strata ; Then, compression occurred and salt flowage took place ; The overburden (salt cover) was shortened ; The overburden was, locally, elongated by halokinesis ; Faults predate salt deposition and the potential traps for hydrocarbons predate the HC migration time, which means, that they can trap hydrocarbons (potential traps) ; They are favorable for hydrocarbon exploration. In hypothesis 2, there is no lengthening before the salt deposition ; Lengthening (extension) occurred after salt deposition ; Later, the overburden and the salt infrastructure were shortened. The hypothesis 2 can be summarized as follows : (i) There was no extension before the salt deposition ; (ii) The salt was deposited on a stratigraphic layer, more or less, horizontal and continuous ; (iii) Above the salt, sediments deposited in isopachous intervals (prekinematic layers) ; (iv) A regional lengthening (extension) occurred and reactivated as normal faults, the pre-existing faults and fracture zones of infrasalt strata ; (v) The salt flowed laterally and downward filling the space created by lengthening ; (vi) The flow of the salt induced in the overburden (above prekinematic layers) a depocenter, as well as, a tectonic disharmony and da salt-weld ; (vii) A regional compressional tectonic regime occurred and shortened the overburden ; (viii) A shortening, locally, reactivated the salt layer initiating a halokinetic phase. More concisely : (A) The faults postdate salt deposition ; (B) The faults postdate prekinematic layers ; (C) The morphological traps by juxtaposition (infrasalt) postdate the migration of hydrocarbons, that is to say they do not have petroleum potential.
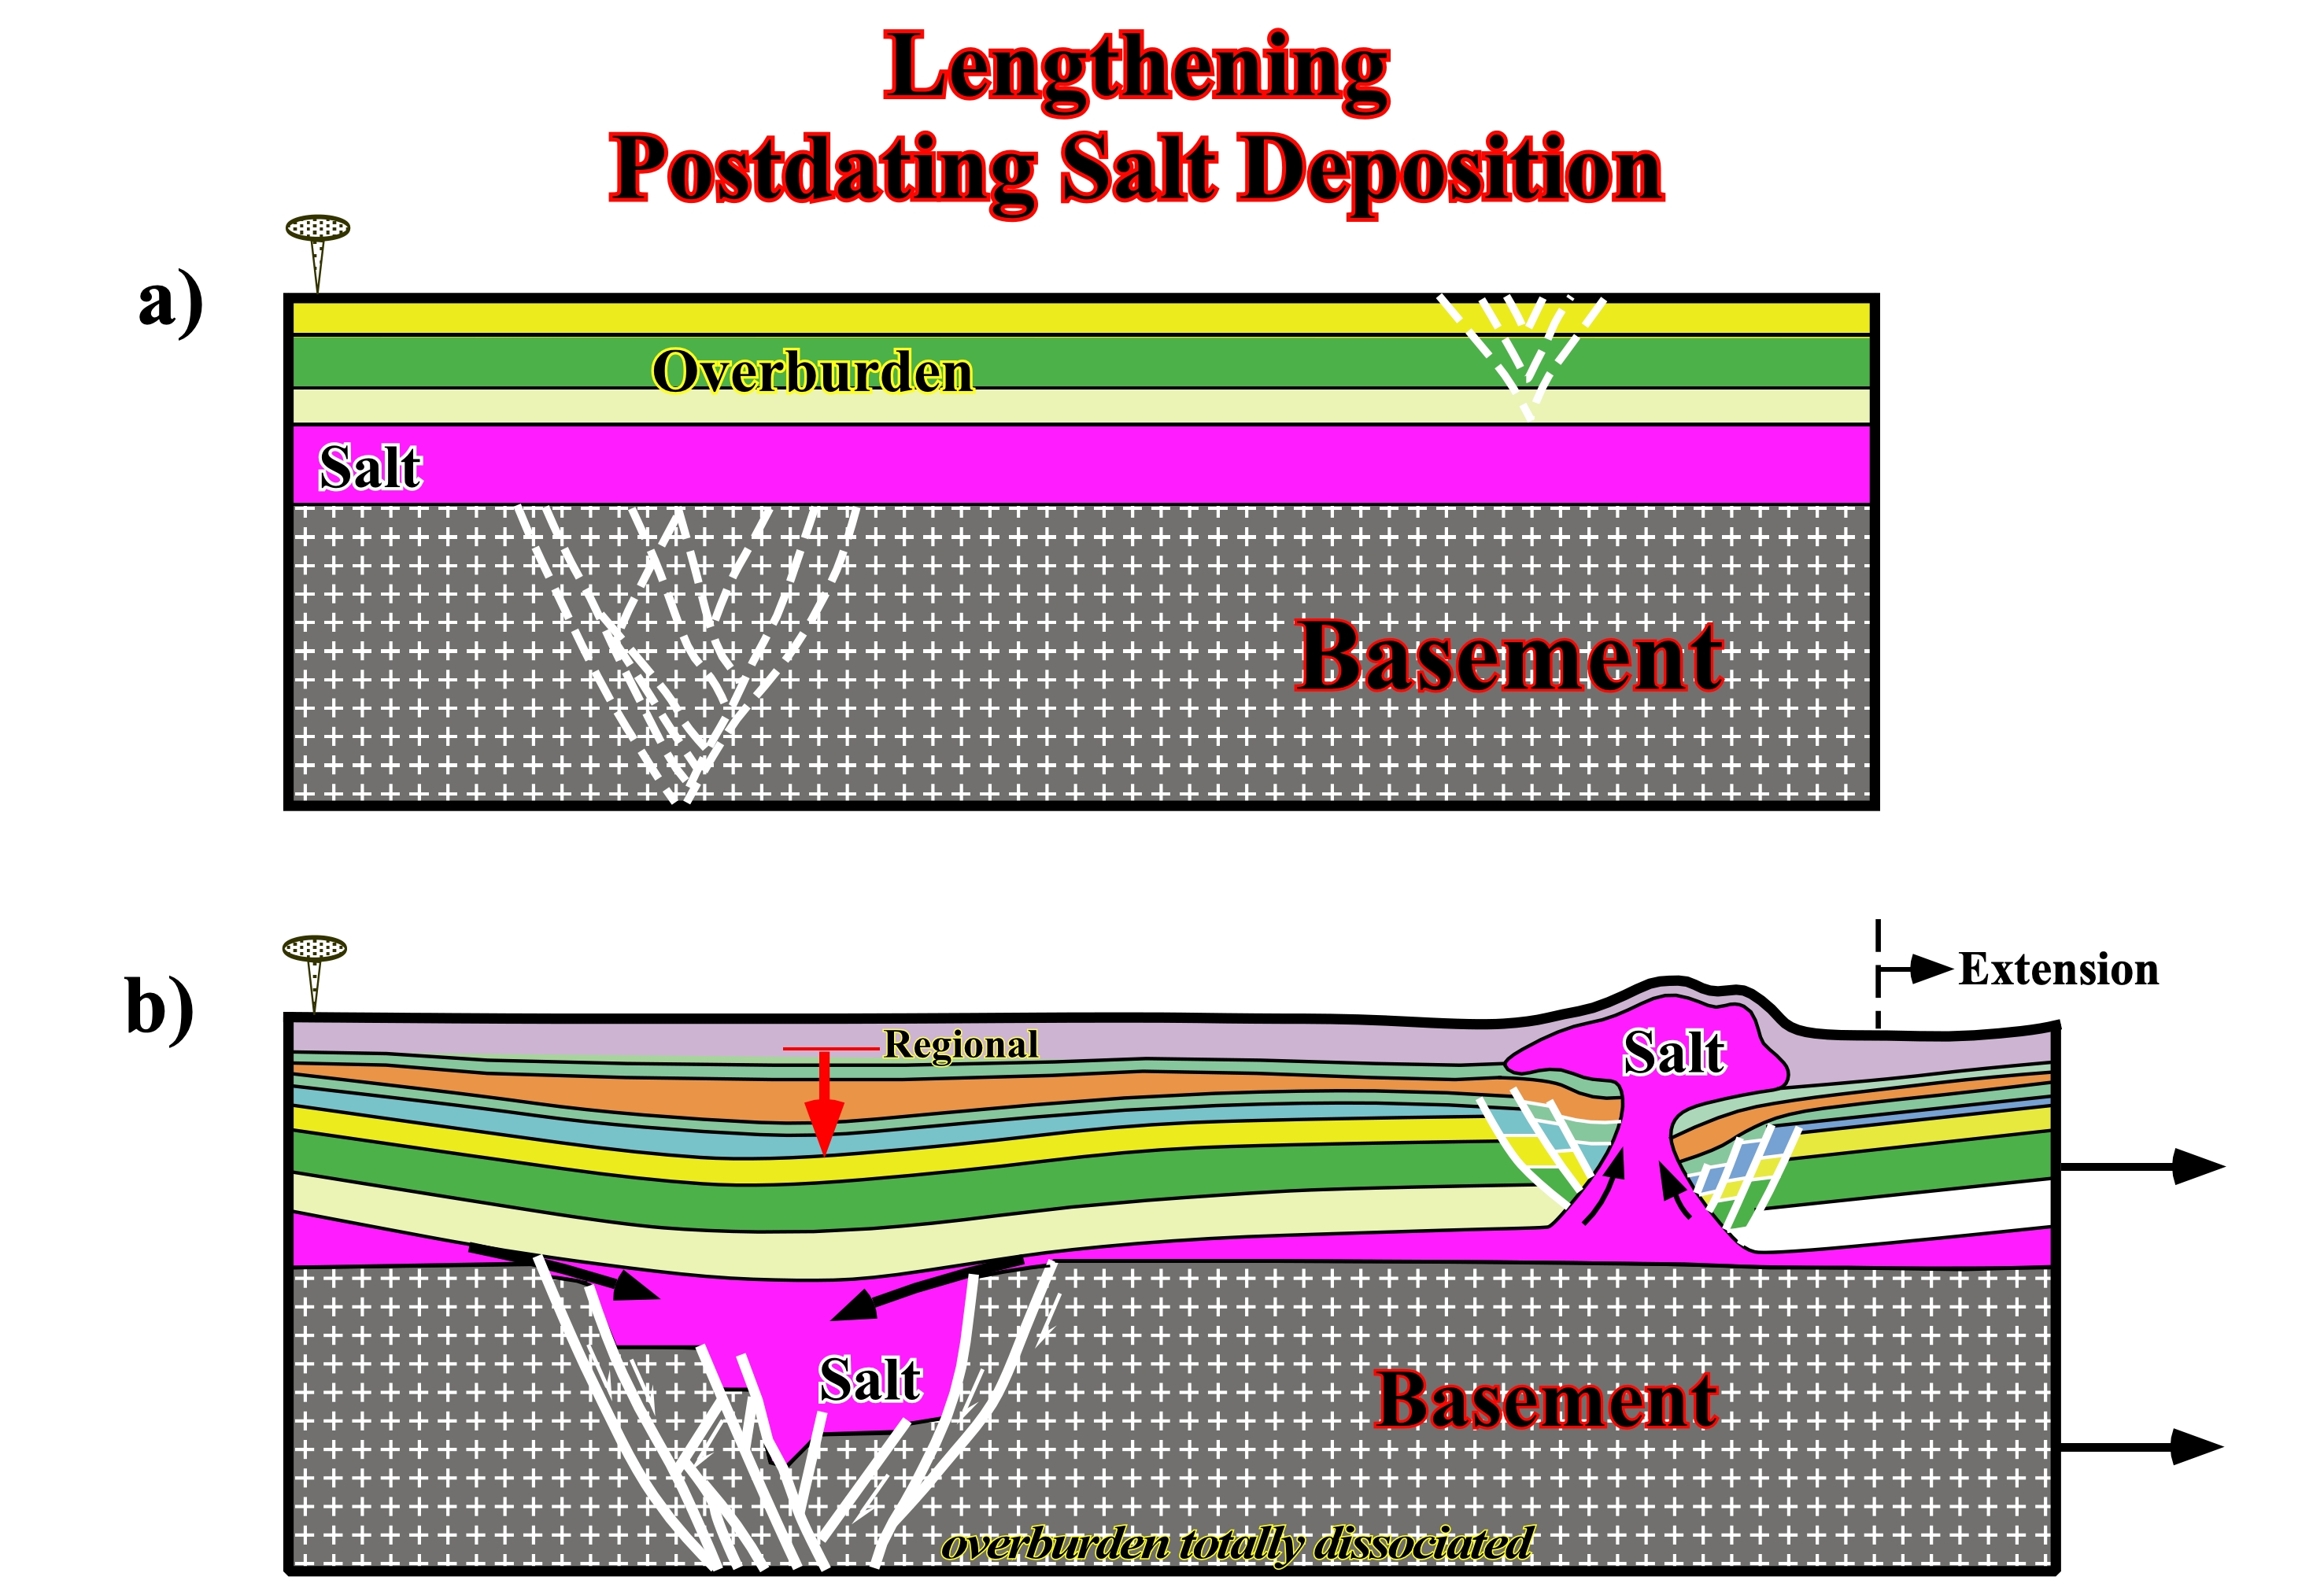
Figure 120- This geological model suggests that a post-salt extension fits better the data observed in previous seismic lines. The wavy geometry of the overburden (suprasalt intervals) is associated with a late compression (shortening). The depocenter overlying the isopach layers (prekinematic) dates lateral and downward flow of the salt as well as salt-welds. Moreover, it allows to subdivide the overburden in prekinematic and postkinematic. The geometry of the grabens is similar to that observed on seismic data. The salt diapir, formed in the overburden pre-faulted area fits with the salt structures found on the seismic lines of the region.
5) Auto-Similarity of Geological Records
Geological and seismic records are invariant with the scale, which means that tentative geological interpretation of seismic lines are dependent on the scale (Figure 121 & 122). The natural scale is 1: 1. The original geometric relationships are often deformed.
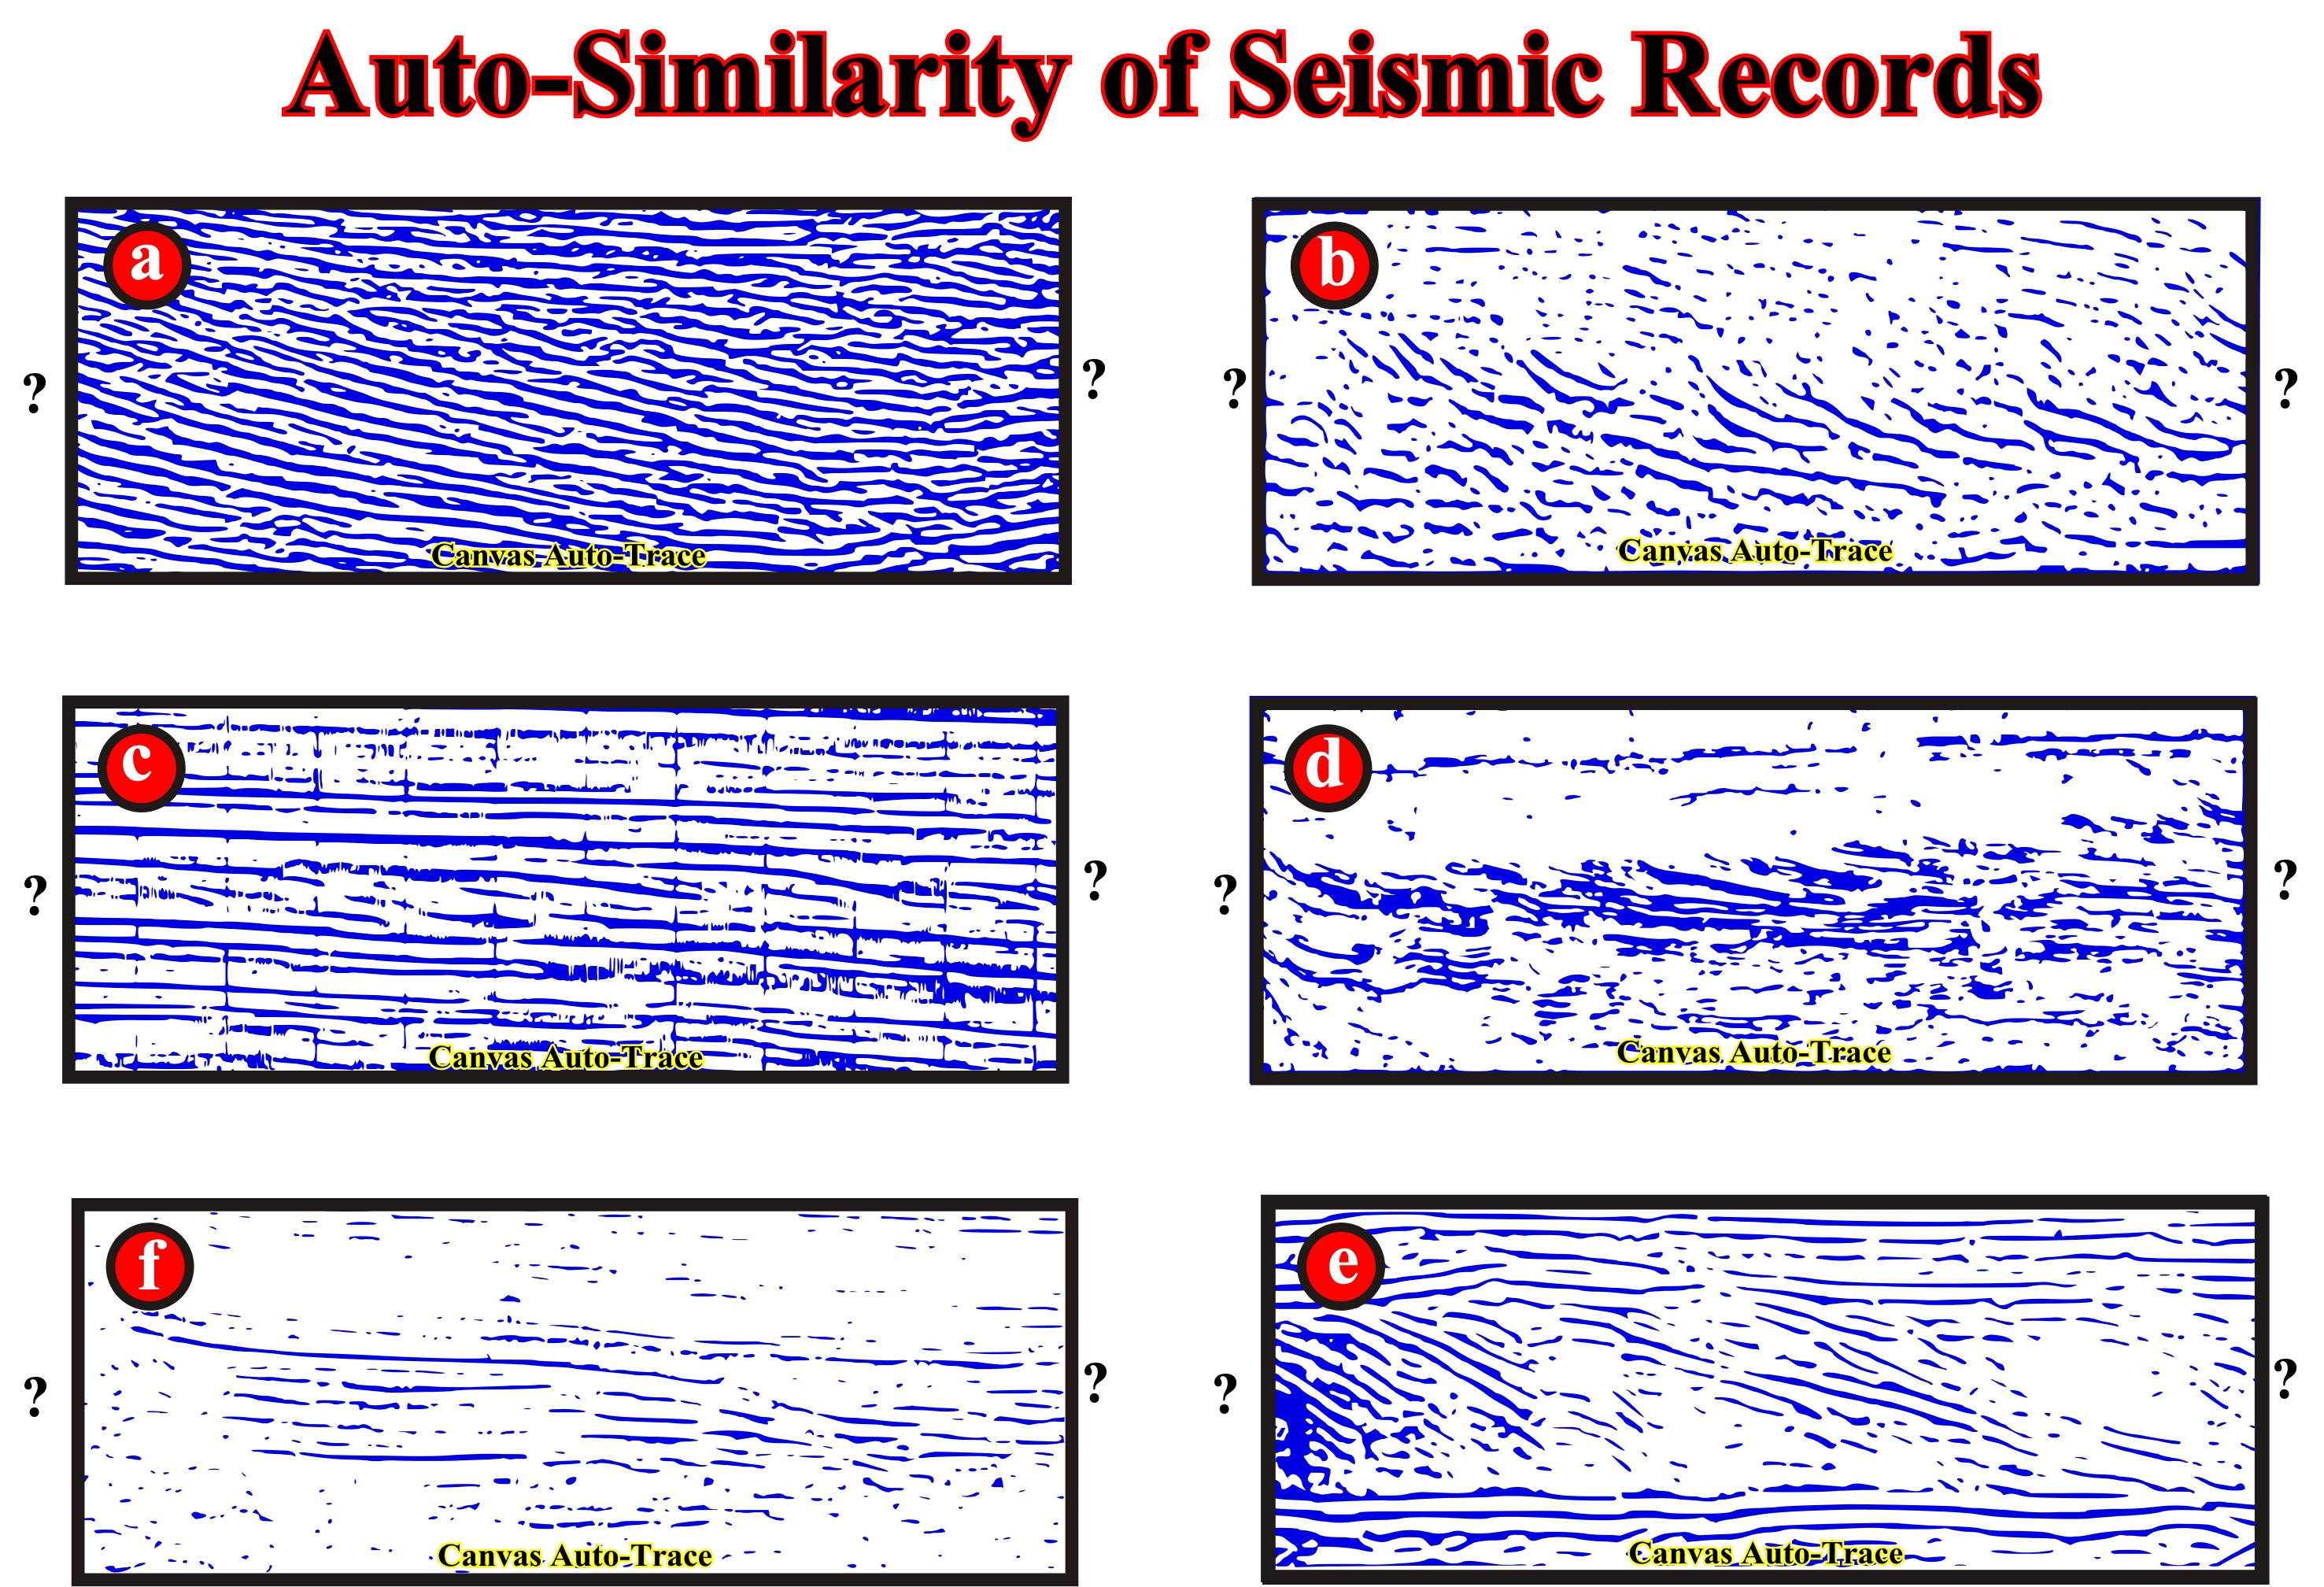
Figure 121- Any geoscientist can tentatively interpreted, in geological terms, seismic lines without scales (vertical and horizontal) and, hardly, without their location. In the past, that is, in my time, most of the manger exploration (naive or inductivists) of oil companies, for confidentiality reasons (according to them) hid or erased the location of seismic lines before the give them to the interpreters. The consequence of such a behaviour, besides to prove their incompetence, is that the interpreter, unknowing the geological context of the area where the seismic lines were shot, do not know what to observe on the lines, force them to make naive and inductive interpretations without any scientific interest. Fortunately, today is not the same thing (in most companies). For example, if the geoscientist in charge of the tentative geological interpretation of seismic lines know that they were shot in Angola offshore, he knows that, on a regional line, from top to bottom, it must recognize (Theory precedes Observation, K. Popper, 1934) : (i) The pre-rifting unconformity that limits upward the basement, which can be formed by granitic rocks, Precambrian sediments, Paleozoic folded belt or pre-break volcanics ; (ii) The rift-type basins developed in the Pangea (Gondwana) continental crust during the lengthening of the lithosphere and before the breakup ; (iii) The breakup unconformity that marks the end of the lengthening of the lithosphere (rift-type basins) and the onset a subaerial lateral volcanic accretion (subaerial) of the individualized lithospheric plates ; (iv) The infrasalt sediments of the continental margin that, locally, can form huge depocenters (lake or shallow sea) ; (v) The deposition of the Aptian salt layer ; (vi) The tectonic disharmony induced by the salt movements, which corresponds, more or less, to the base of the salt ; (vii) The transgressive phase (retrogradational geometry) of stratigraphic post-Pangea continental encroachment cycle ; (viii) The major Cretaceous downlap surface (MFS. 91,5 Ma), which limits the top of the transgressive phase ; (ix) The regressive phase (progradational geometry) of post-Pangea continental encroachment cycle, in which he must recognize the Oligocene dun conformity (SB. 30 Ma), induced by the formation of Antarctic ice cap. Seismic line without scales cannot be interpreted by the scientific method. Any advanced hypothesis can be tested (falsified) by the interpreter. For example, on the seismic line (a), illustrated above, if the interpreter says that the reflectors inclined rightward correspond to deltaic slope, theoretically, it is not making a scientific statement, but metaphysical, since it can not falsify it (is like saying that all bachelors are unmarried, or that tomorrow is sunny or not depends on the weather). The same applies to the other lines. The seismic line (e) was shown to several geoscientists asking the question : What is the more likely geological interpretation for the reflectors inclined to the right ? None said that the question was stupid. They all give different answers. However, when it was said that the vertical scale was in nanoseconds (10-9 second) and the vertical equidistance of the horizontal time was 50 nanoseconds, all answered correctly : They correspond to oblique stratifications of a sandy horizon with a thickness between 10 and 15 meters. In fact, the line (e) is a georadar line, made by a geophysical device that uses the principle of a radar (microwave band and waves VHF / UHF), and that pointing to the ground, allows to study studies its composition.
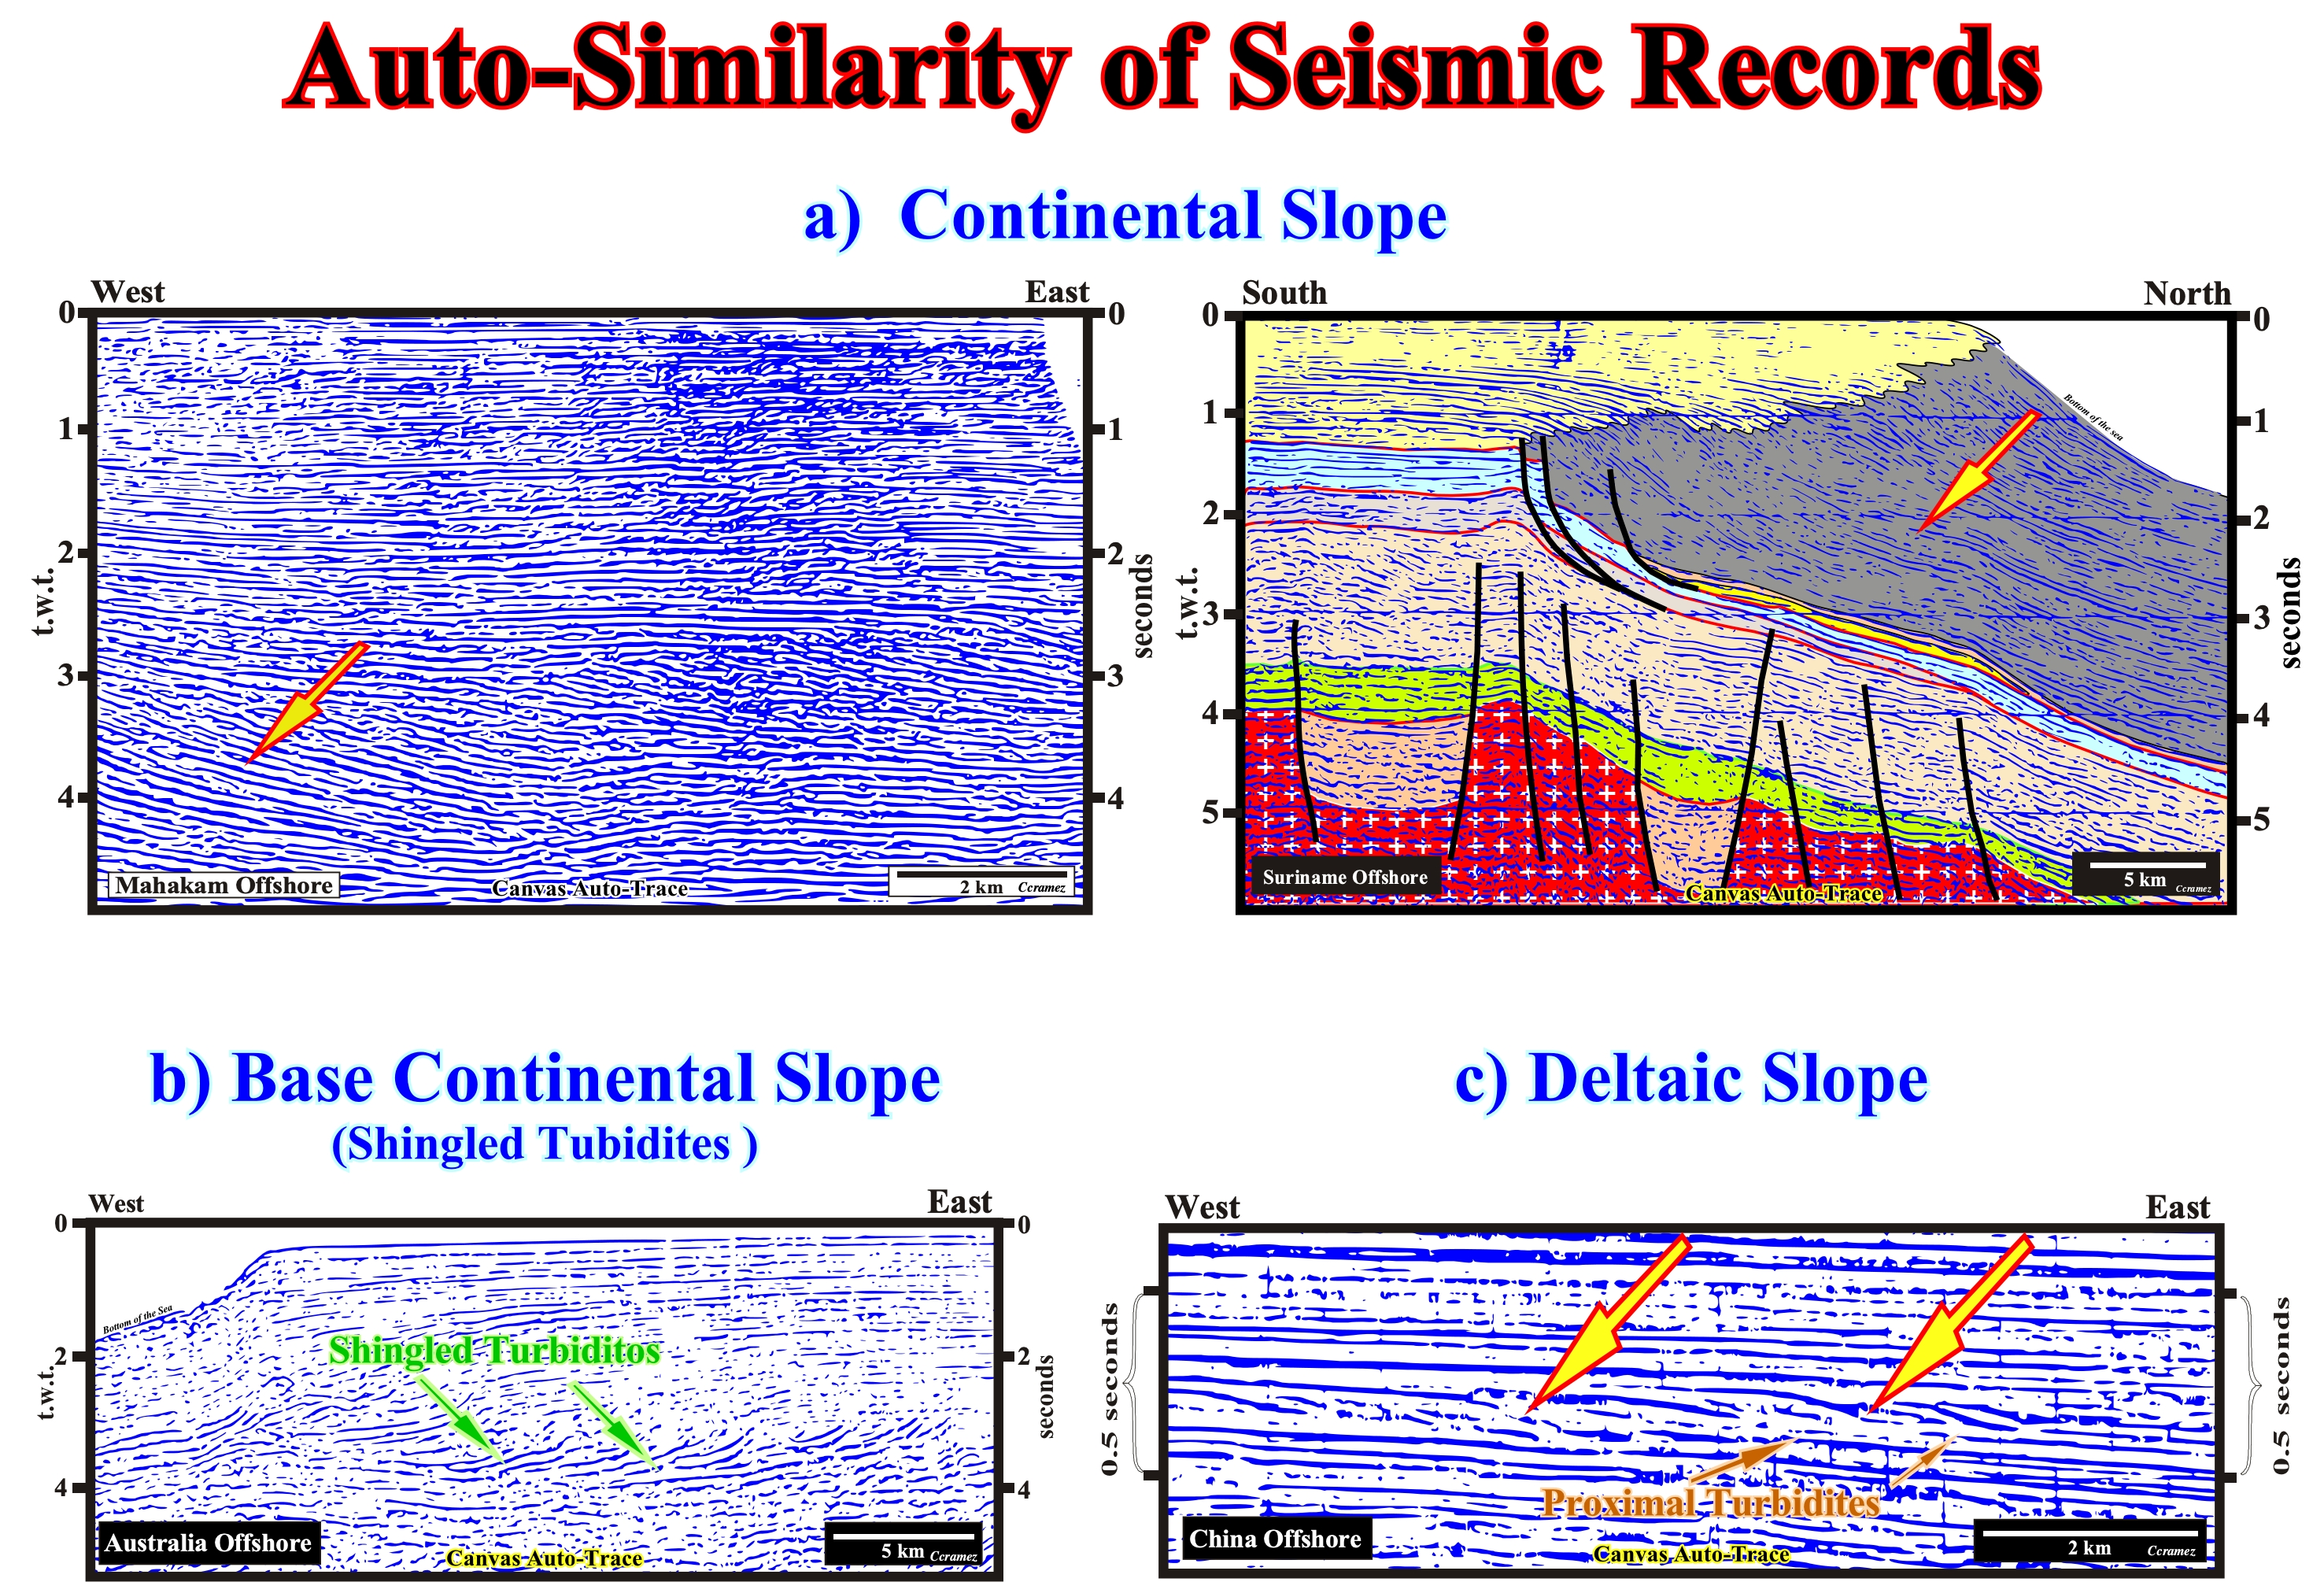
Figure 122- These seismic lines show the difference between a continental slope and deltaic slope. The progradations of a continental slope have a height (difference between the toplap and downlap on the same chronostratigraphic line) greater than 200 meters. The deltaic progradations, rarely, reach 100 meters. In my time (in the 60's) , when a geoscientist recognized deltaic progradation on the old seismic lines, he was, certainly, taking a continental slope as a deltaic slope. In fact, as discussed below, the thickness of a delta, rarely, exceeds 50-60 meters, i.e., more or less, the limit of resolution of conventional seismic lines. As illustrated on the seismic line of the Australia offshore, often at the base of the progradations of continental slope there are shingled turbidites, which should not be confused with the proximal turbidites deposited at the baser of a deltaic base slope, as illustrated on the seismic line of the China offshore. This seismic line (c), the first thing to note is the vertical scale, which in relation to the scale of the other lines is much less exaggerated. Secondly, the height of the progradations does not exceed 100 milliseconds (t.w.t.), which means that, most likely, they correspond to prodelta (deltaic slope) and the anomalies at the bottom of the progradations are proximal turbidites.
6) Deltas (sensu lato)
The characteristics of a fan delta are summarized in figure below:
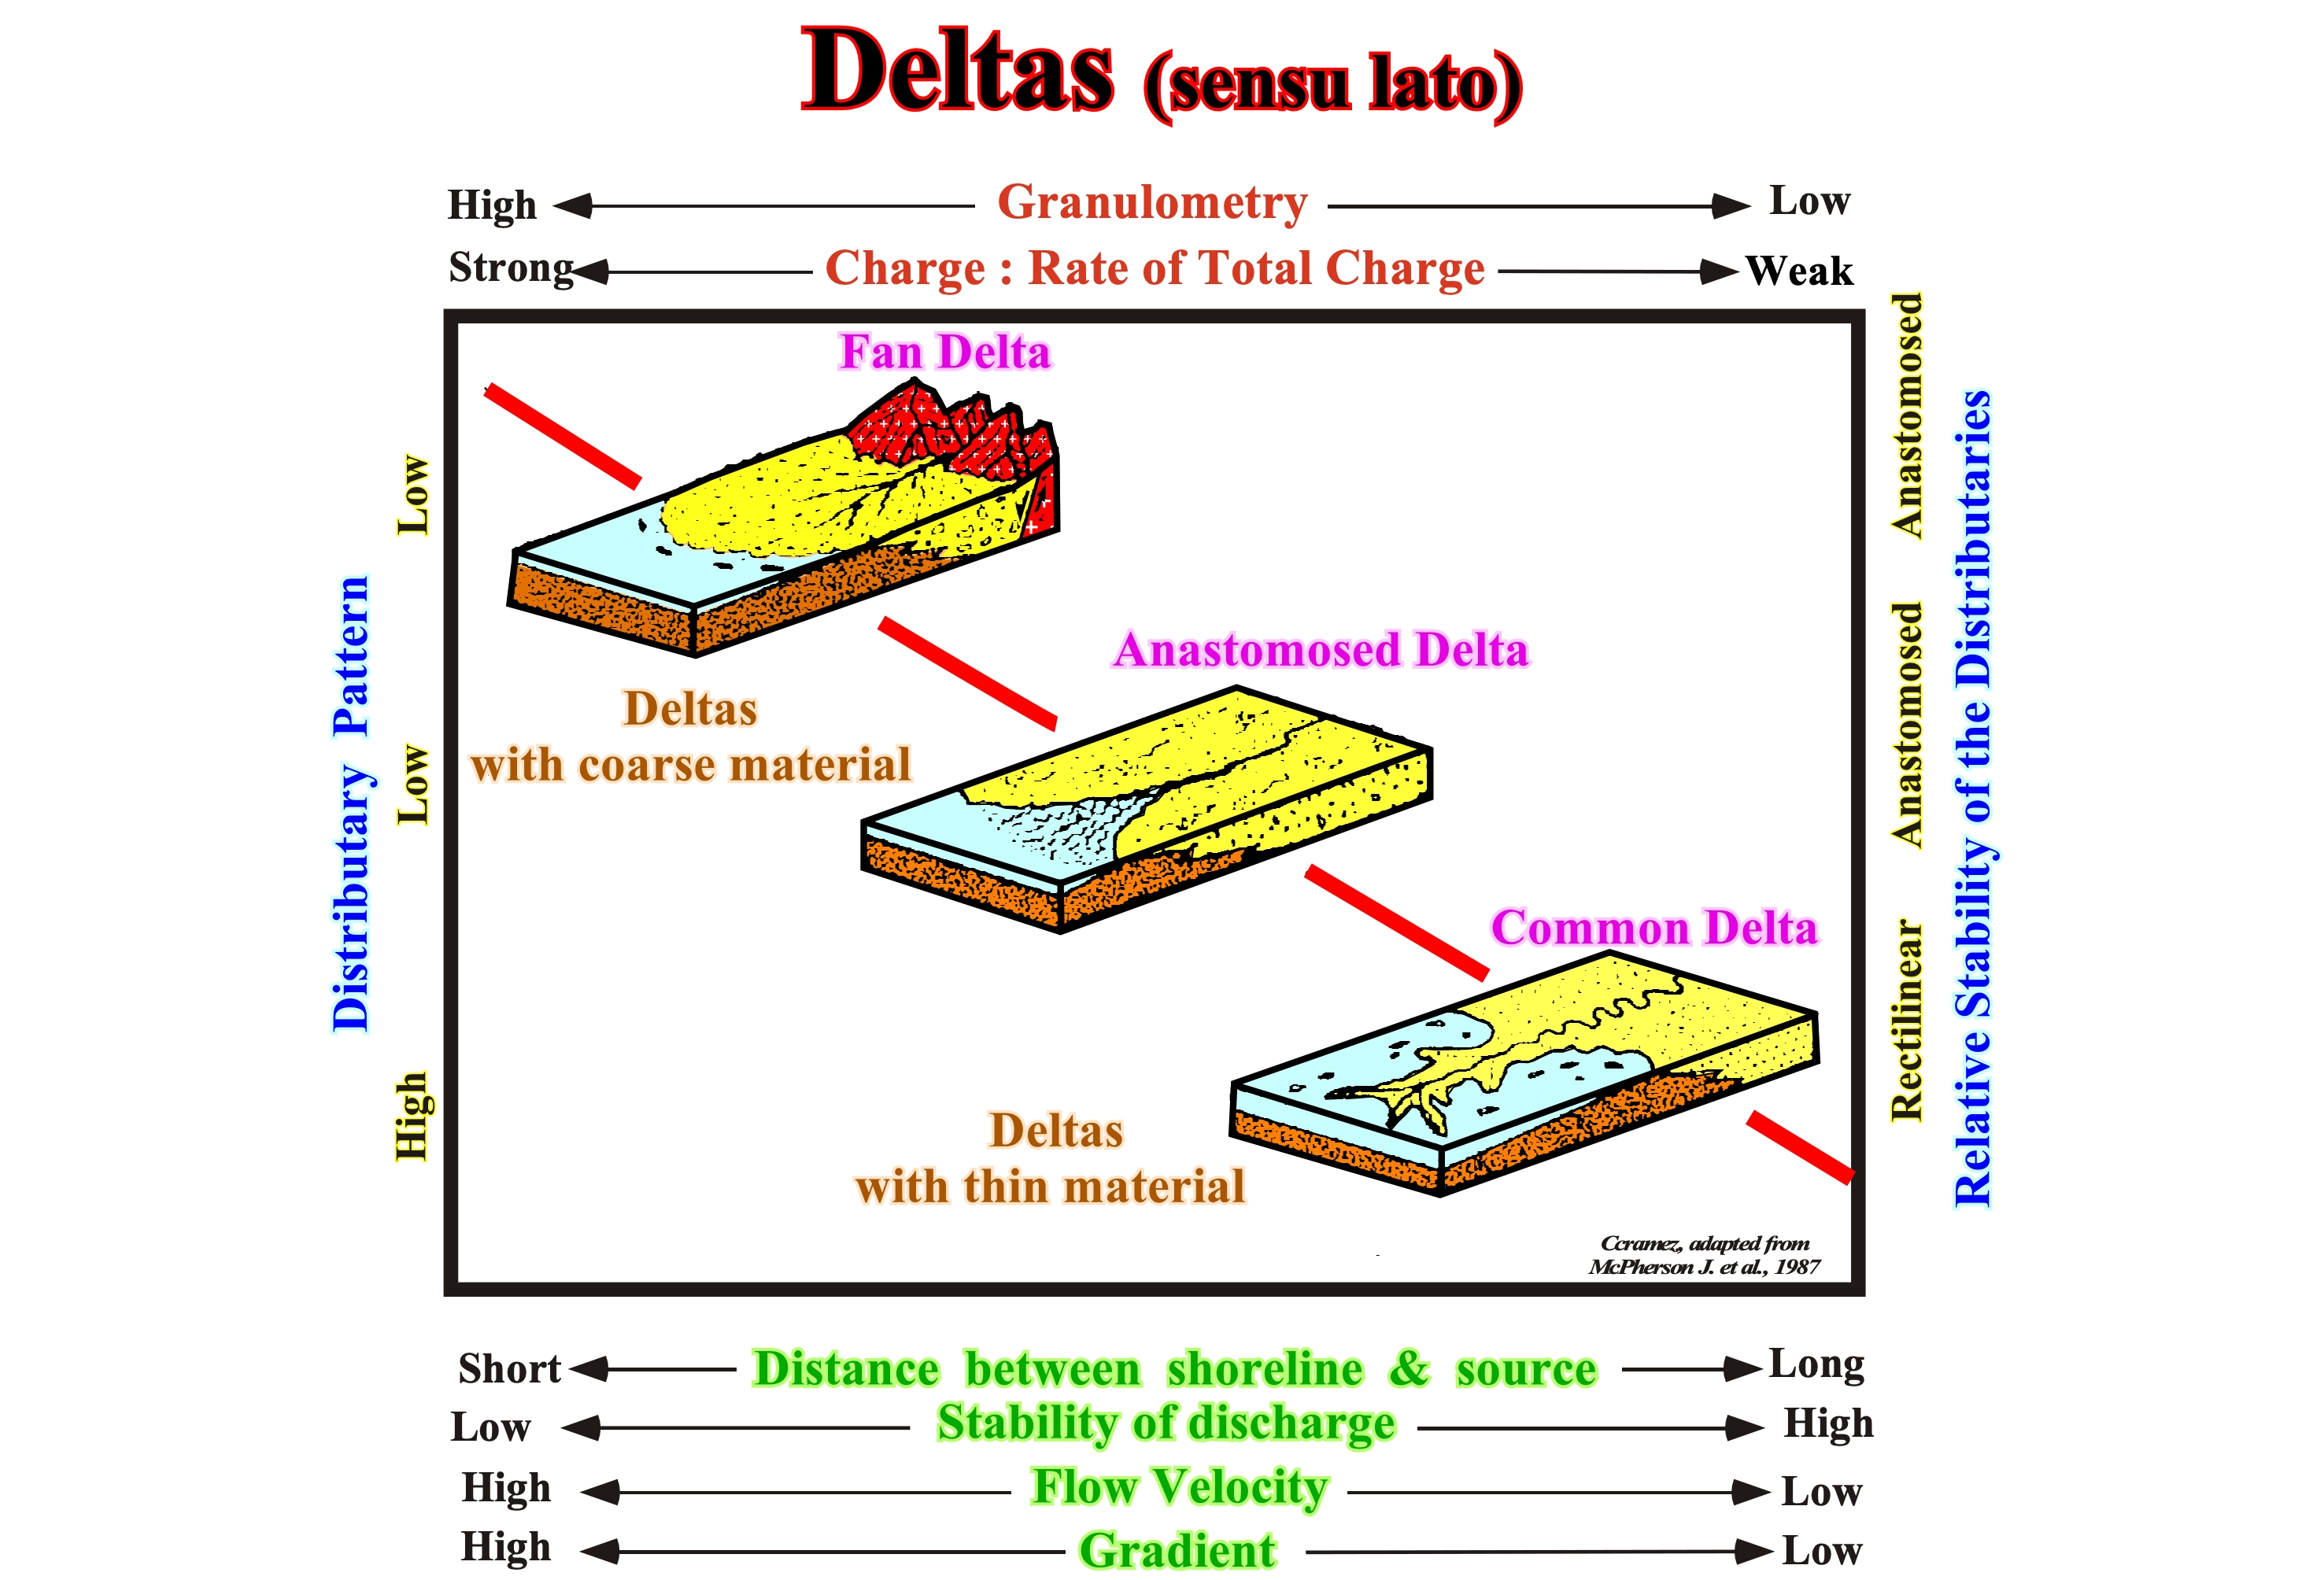
Figure 123- Anastomosed (braided) delta and common delta. The first two are formed by coarse material, while the common delta is, generally, fine material. The morphology of the distributary is, more or less, rectilinear in a common delta, while in braided deltas and fan delta fan it is anastomosed. The charge, as well as, the particle size, is large in fans delta , medium and small in braided and common deltas. The distance between the coastline and the source of the associated river, is short in fan deltas fan, medium and large deltas in plaited in common deltas. The flow velocity and the gradient are great fan deltas, medium braided deltas and low in common deltas. The thickness of all these deltas, rarely, exceed 50-60 meters, which allows to differentiate the associated deltaic progradation from the continental slope, unless the geoscientist does not know the difference between a delta and a deltaic building complex, what is illustrated in the following figures.
7) Continental & Delta Slopes
The difference between a delta and deltaic building complex are illustrated in figure 124.
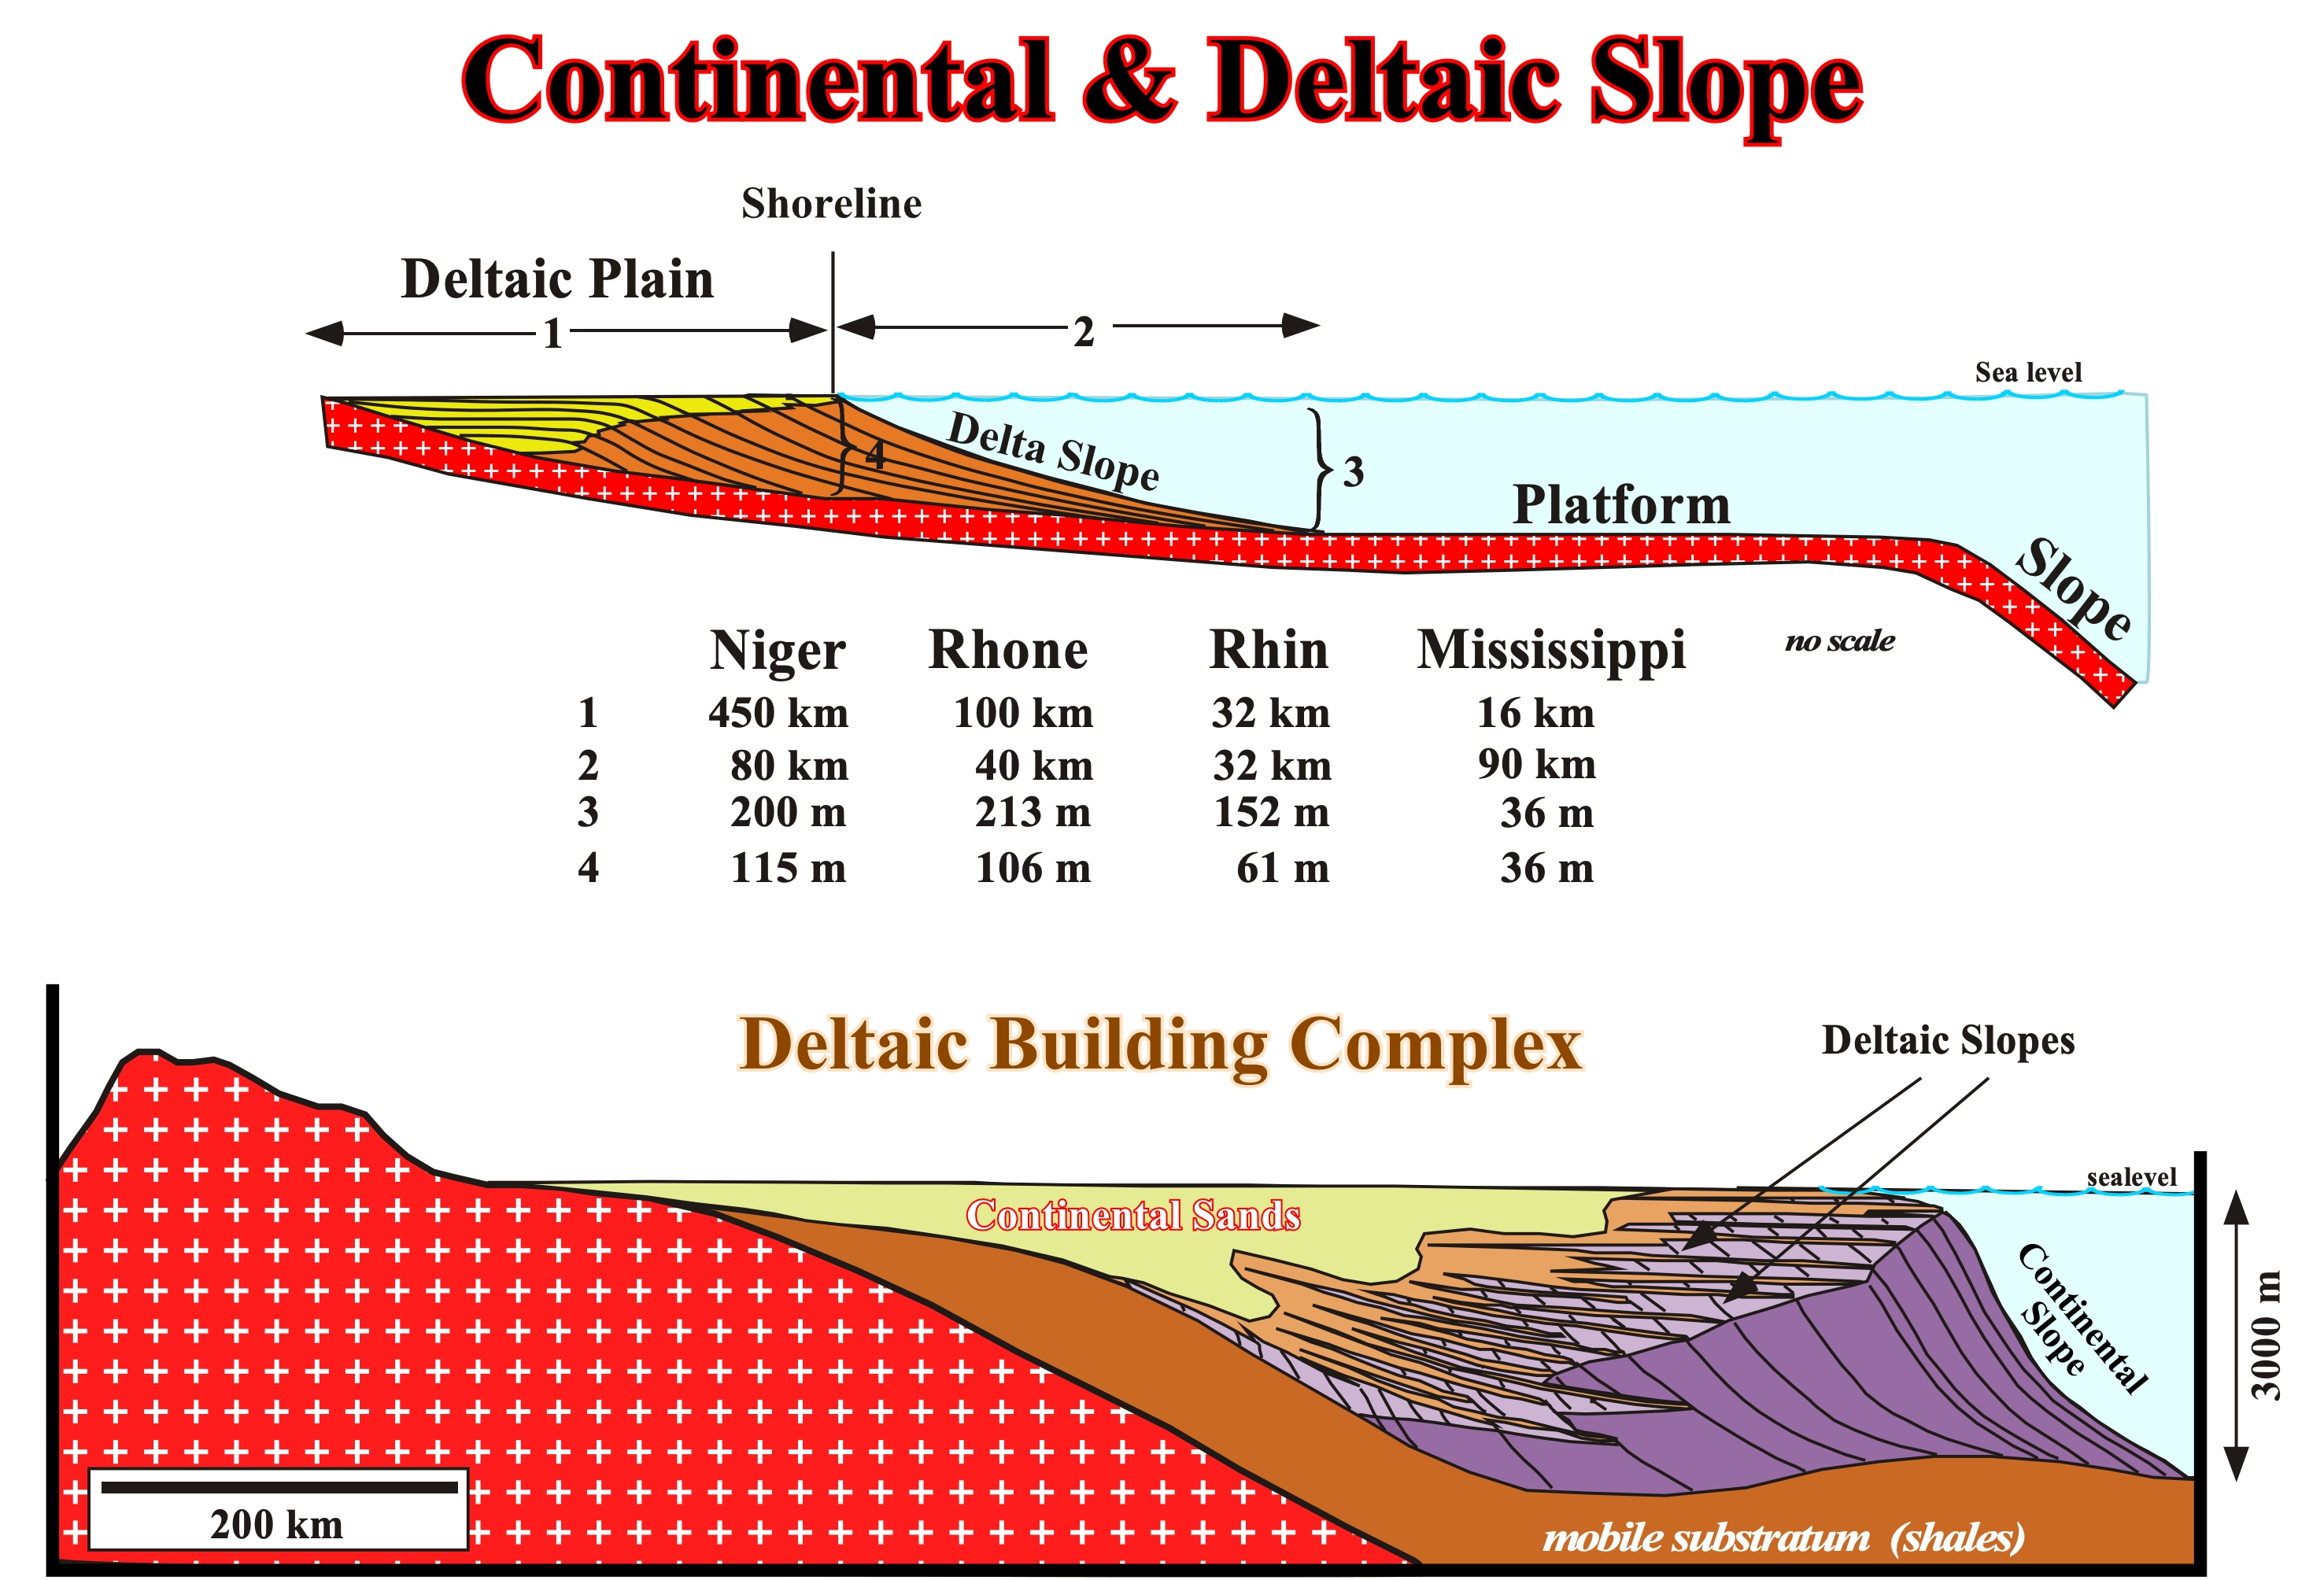
Figure 124- How many times, geoscientists said : "Niger and Mississippi deltas have more than 4000 meters of thickness". To say that, is like saying that the height of my apartment floor is is 50 meters. Everyone knows that floors of modern buildings have, in average, less than 3 meters of height, and that a building can have multiple floors. One floor is one thing, a building is another. In geology is the same, a delta (floor) is one thing, a deltaic building complex (building) is another. A delta, which thickness is less than 100 meters, is induced by an eustatic paracycle and is formed by three synchronous and genetically linked depositional systems : (i) Delta Plain; (ii) Delta Front and (iii) Prodelta. The Niger Delta has a thickness of ± 115 meters. The Rhone Delta has ± 106 meters of thickness and the Delta Reno has, more or less, ± 61 meters. The Mississippi Delta has ± 36 meters meters of thickness. However, as illustrated above, a unique delta does not exist. Generally, they are stacked forming thick deltaic buildings, mainly. in progradational sedimentary intervals (lowstand and highstand prograding wedges). This is why, often, when the basin has no shelf (depositional coastal break coincident deposition with shelf break), a deltaic slope forms the upper part of the continental slope.
8) Delta Progradations
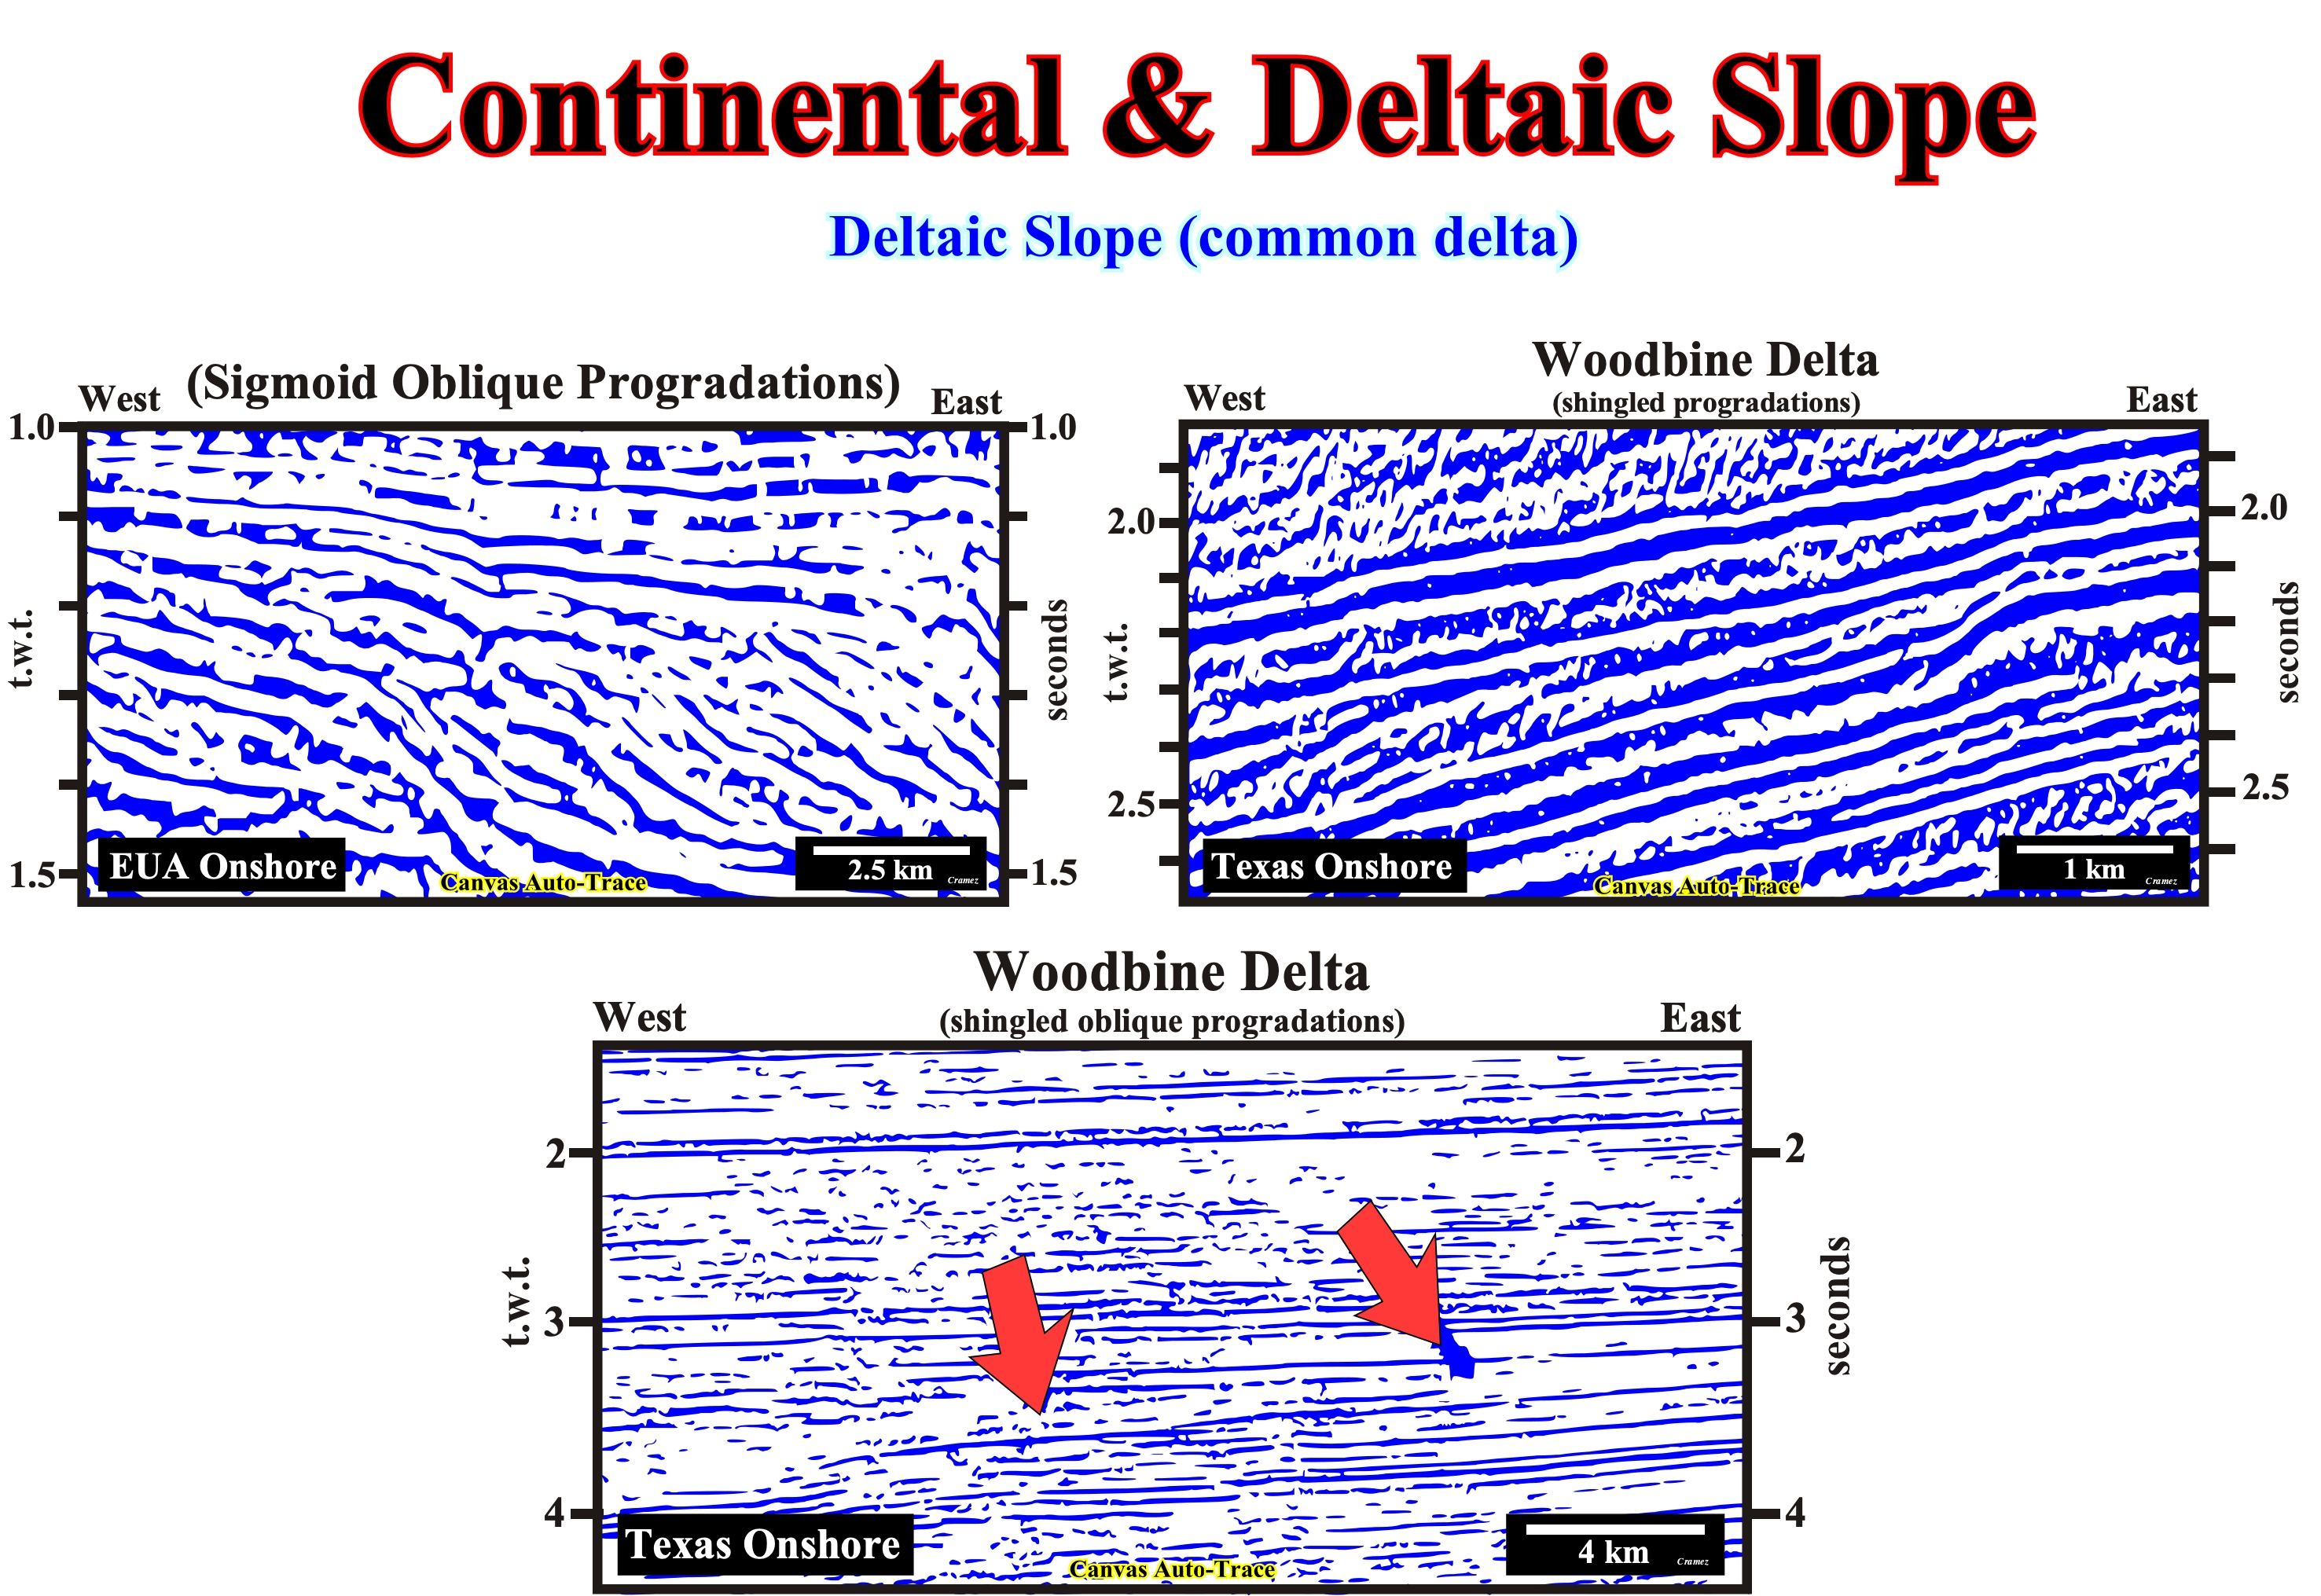
Figure 125- In this figure are illustrated deltaic progradations (observe carefully the vertical scale of seismic lines). Two types of progradations : (i) Sigmoidal progradations and (ii) Shingled progradations. They are easily recognized. The sigmoidal progradations emphasize prodelta (deltaic slope), while the shingled progradations emphasize barrier-islands, shoals, beach sandstones and coastal strands of the deltas formed under the influence of the waves. The East Texas Oil Field is associated with this type of shingled progradations (Woodbine Delta). It is the largest field in East Texas. It covers over 500 km2 and more than 30,000 wells have been drilled. It is the second largest US oil field (Alaska not included) and the first in volume of recovered oil, since 1930 (the year of its discovery). More than 5 Gb have been produced to date (2012).
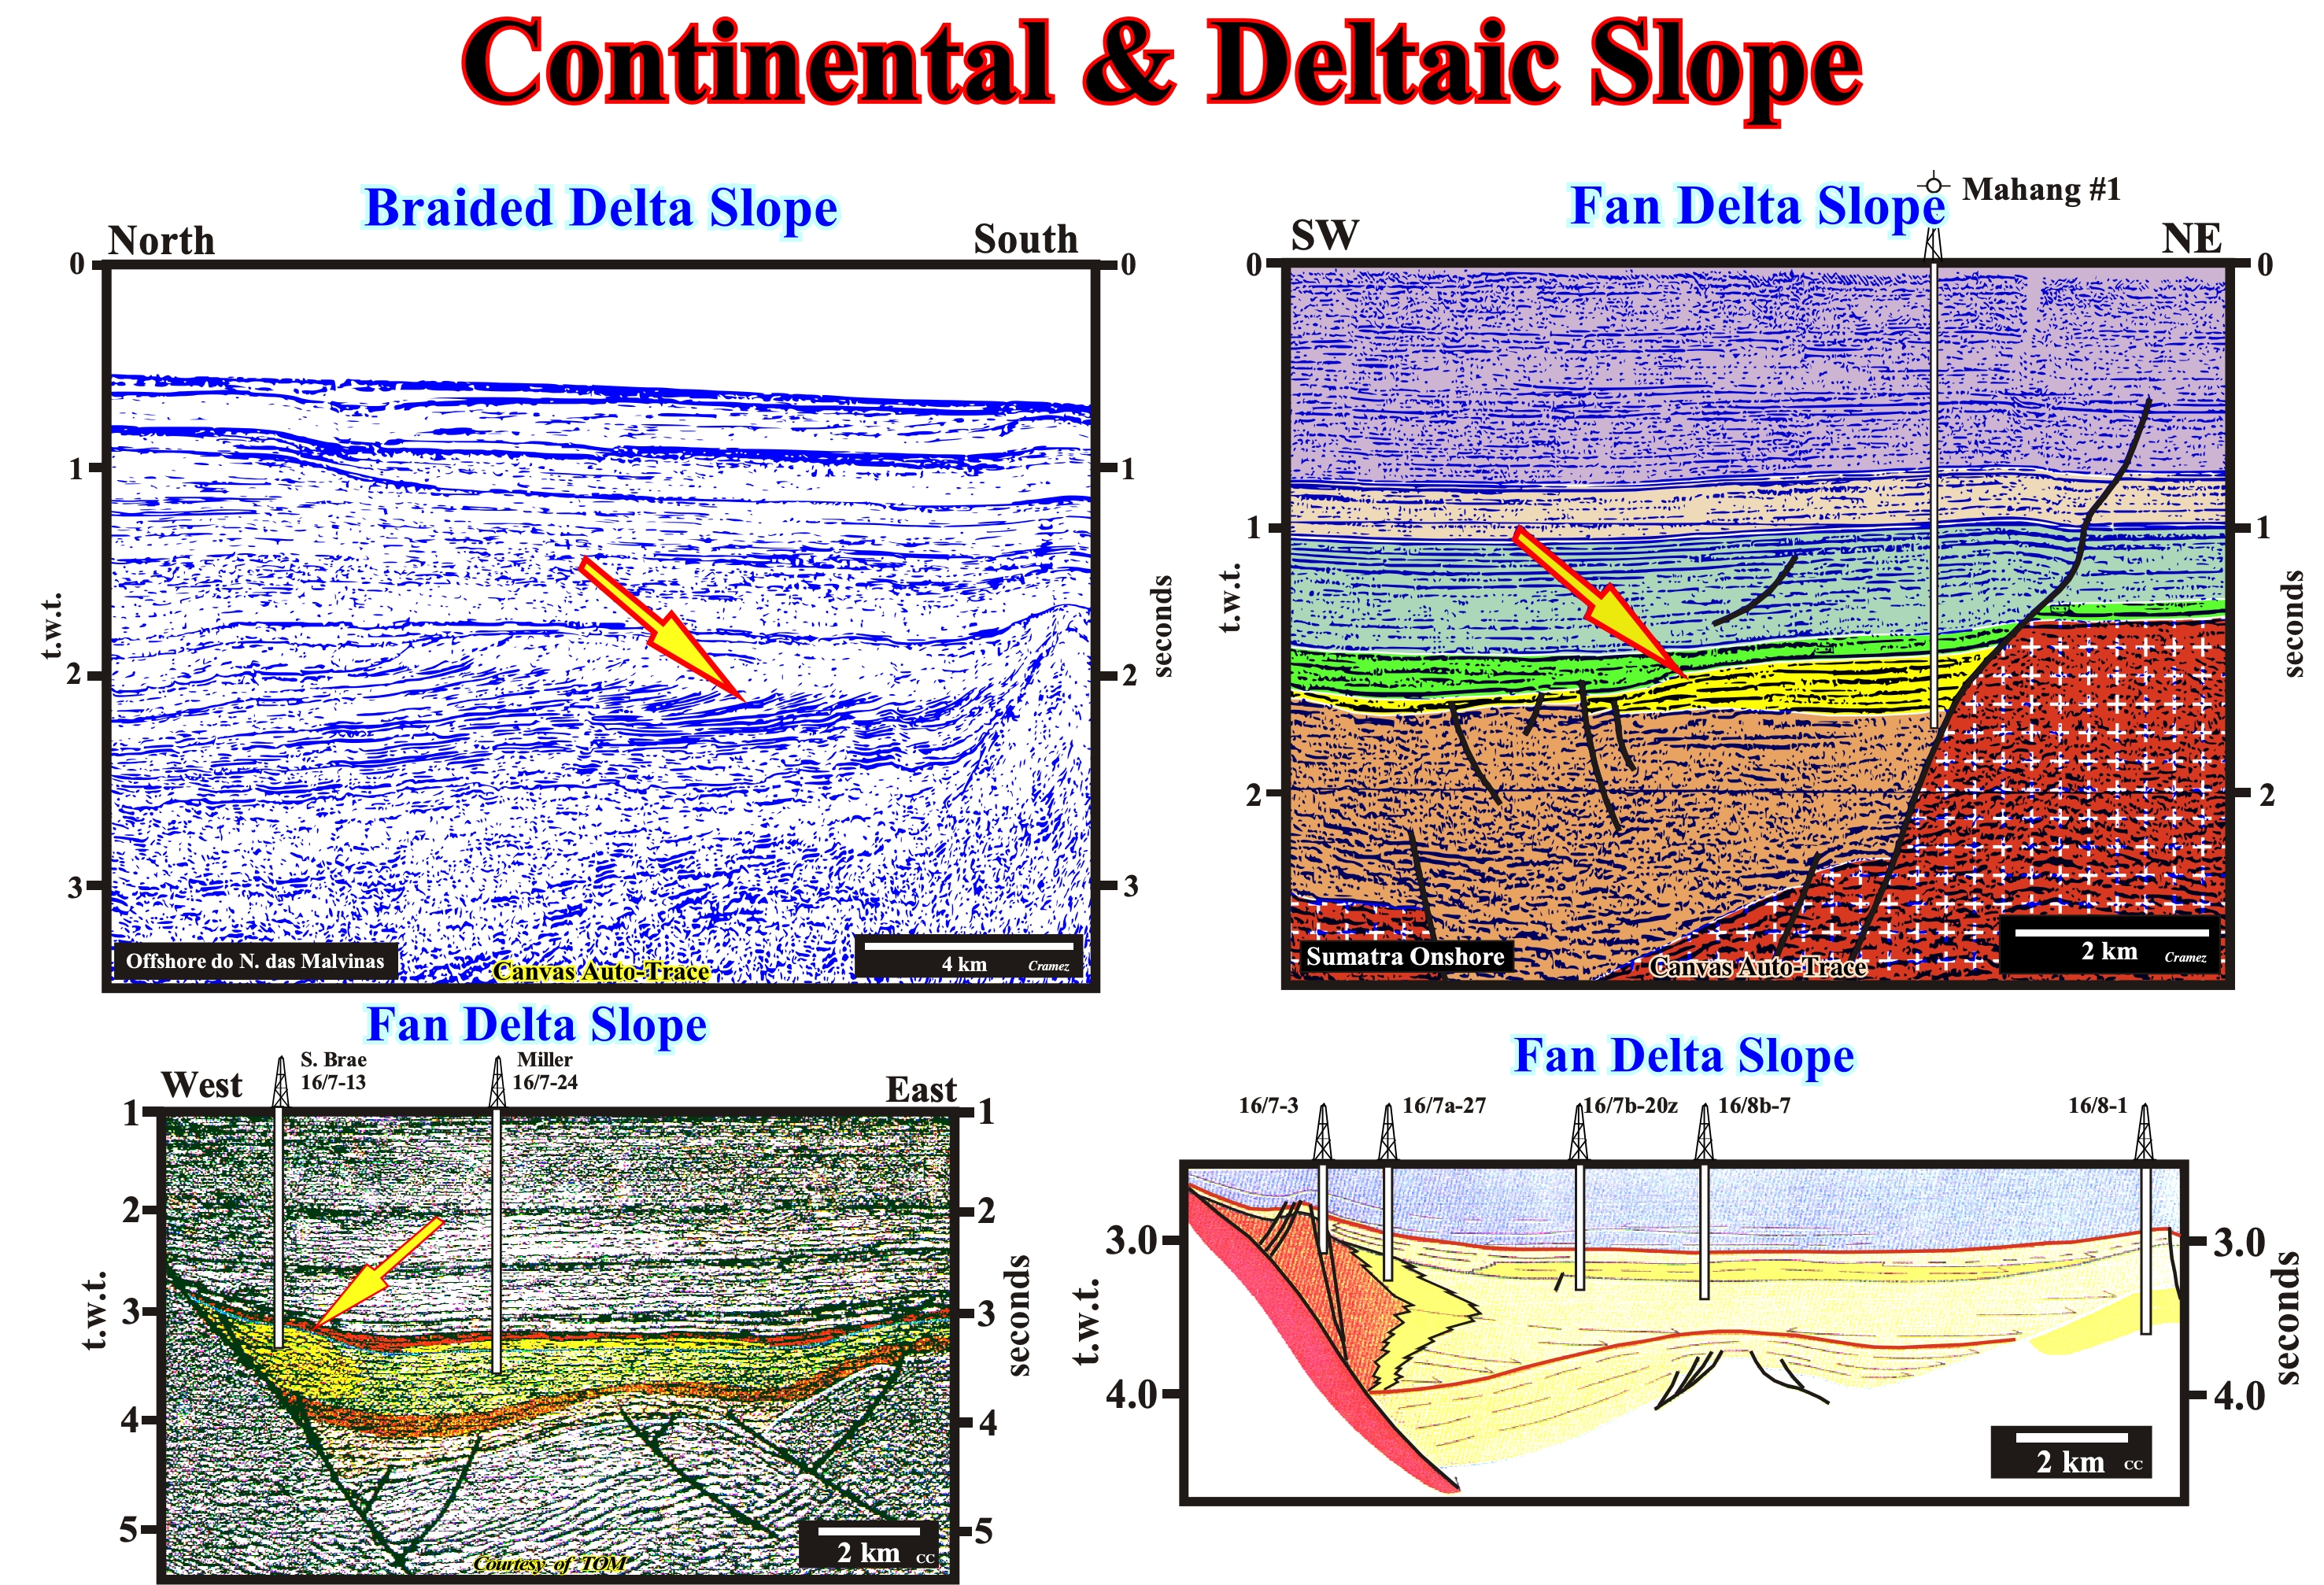
Figure 126- In this figure are illustrated examples of prodeltas (deltaic slopes) of the braided deltas and fan delta fans (type Gibert), which are characterized by : (i) A flow essentially homopicnal of mountain streams with strong gradient, directly in deep water deep a lake or ocean ; (ii) Occasional hiperpicnal turbidite flows (mud flows) ; (iii) Coarse gravel is dominant in progradational beds ; (iv) Fine sands and silts in the basal layers, prograding, locally, in lakes with a descending water level. On seismic line of south Maldives (Maluinas or Falkland Islands), the observed slopes are considered tentatively as slopes of braided deltas with a major lateral accretion. In the tentative geological interpretation of the seismic line from Sumatra onshore, the slopes (yellow interval), corresponding, probably, to fan-deltas Gilbert-type, which developed over of rift-type basin (rifting phase of a back-arc basin), that is, on the bottom of the sag phase near a paleo-high of the basement. Laterally, the deltaic building complex becomes transgressive marine shales which, over time, the fossilise it completely. In this case, as in the examples illustrated in the lower part of this figure (North Sea line on the left and China offshore on the right), the normal fault bordering the rift-type basin (usually with a half-graben geometry) seems continued to play during the sag phase (at least at the beginning), that later, during a compressional tectonic regime, was reactivated as reverse fault. This reactivation, which is absent in the Falklands seismic line (continental margin type-Atlantic), is perfectly normal in the back-arc basins, as these are located within the Meso-Cenozoic megasuture. In the ten-tentative geological interpretation of the seismic line of China offshore (bottom right diagram), lengthening (extension) of the sediments of rifting phase (rift-type basin, differential subsidence) is underlined by the formation of an antiform structure. Later, the antiform structure (are the flanks that went down and not the top that rose) was fossilized by the onlaps of the sediments of the sag phase (thermal subsidence) that, later, due to late uplift (shortening), change false downlaps.
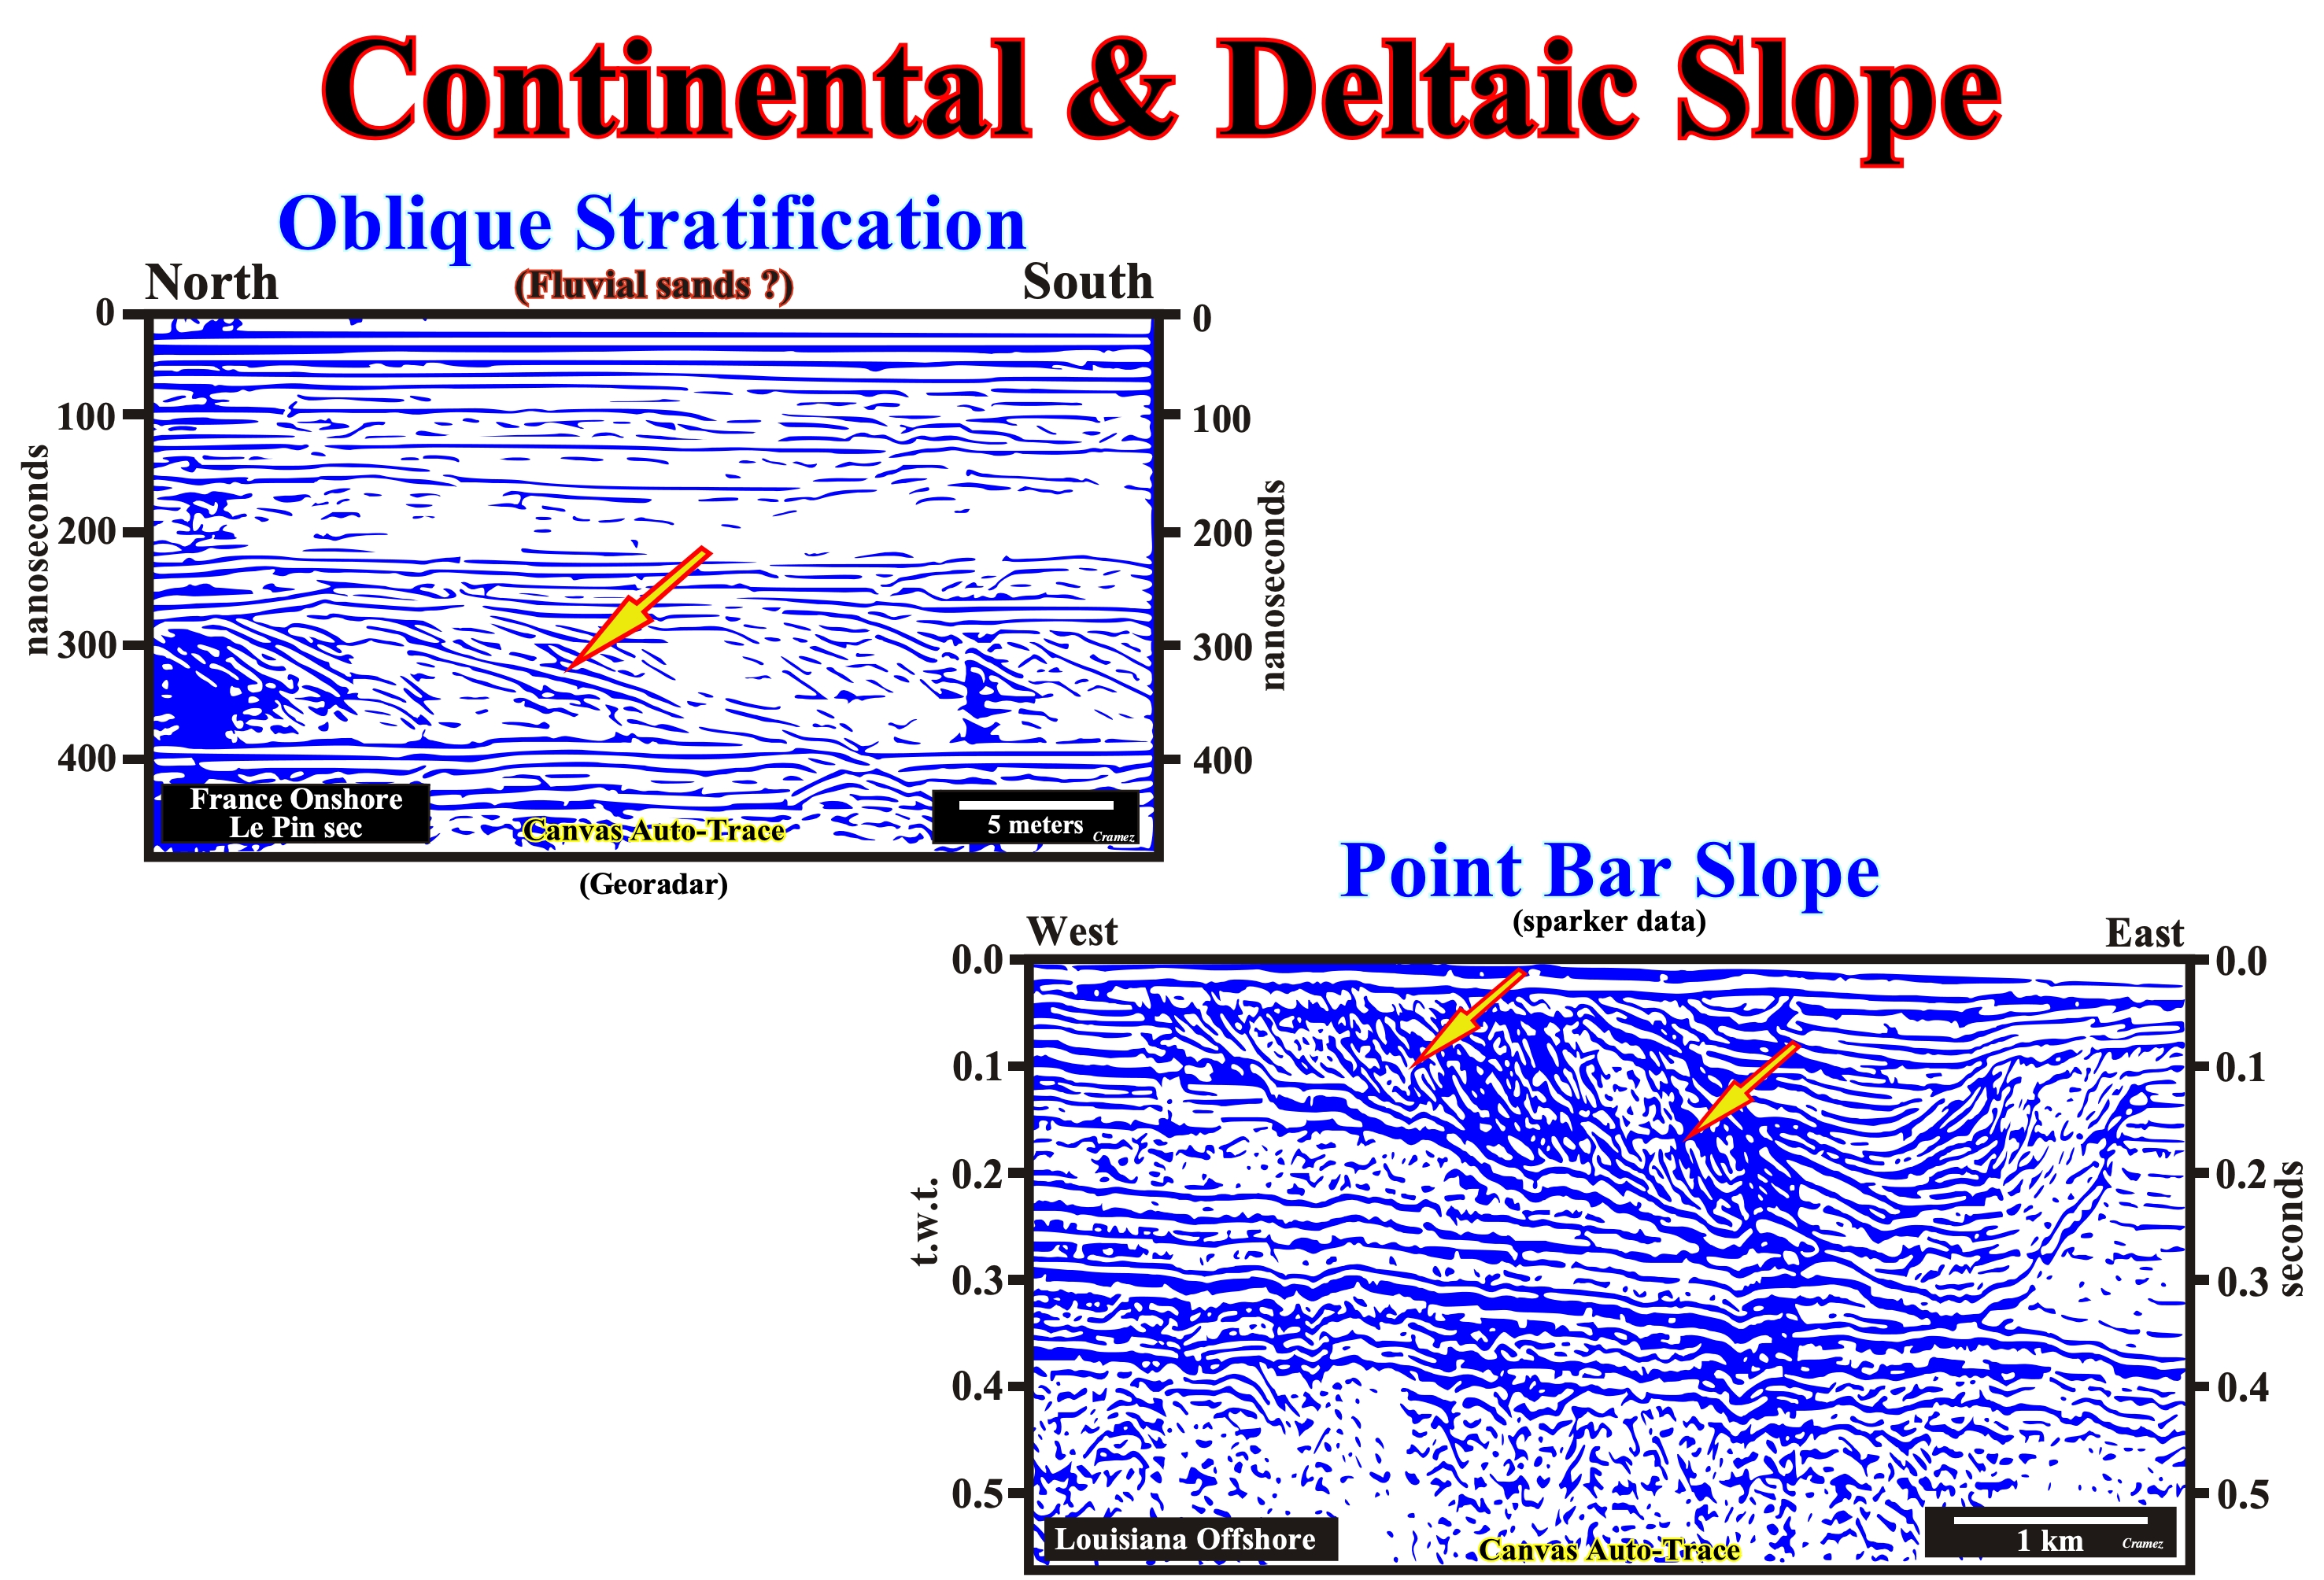
Figure 127- Obviously, the slopes visible on these seismic lines cannot be interpreted as deltaic slopes. The vertical scale of the top line, in nanoseconds, refutes the hypothesis of a deltaic slope and corroborates the hypothesis of an oblique stratification. Indeed, the thickness of progradational interval does not exceed 10-15 meters. On the other hand, a delta is a stratigraphic paracycle (systems tract) composed of three depositional systems (delta plain, delta front and prodelta) coeval and genetically linked, which means that cannot exist a delta represented just by one depositional system (taking into account of course the seismic resolution), in this case the prodelta. On the seismic line, illustrates at the bottom of this figure, the geometric relationships between the reflectors and the scales (vertical and horizontal), strongly, suggest that the best geological model to explains them is a fossil meander. The progradations dipping eastward correspond to a point bar, while the progradations, less marked, dipping westward correspond to clay plugs deposited during the abandonment periods of main fluvial channel.
9) Vertical Exaggeration
As an example, we need to consider the effect of the exaggeration of the vertical scale in the thickness and inclination of the layers of a unitary thickness of an anticline (Sitter, 1974).
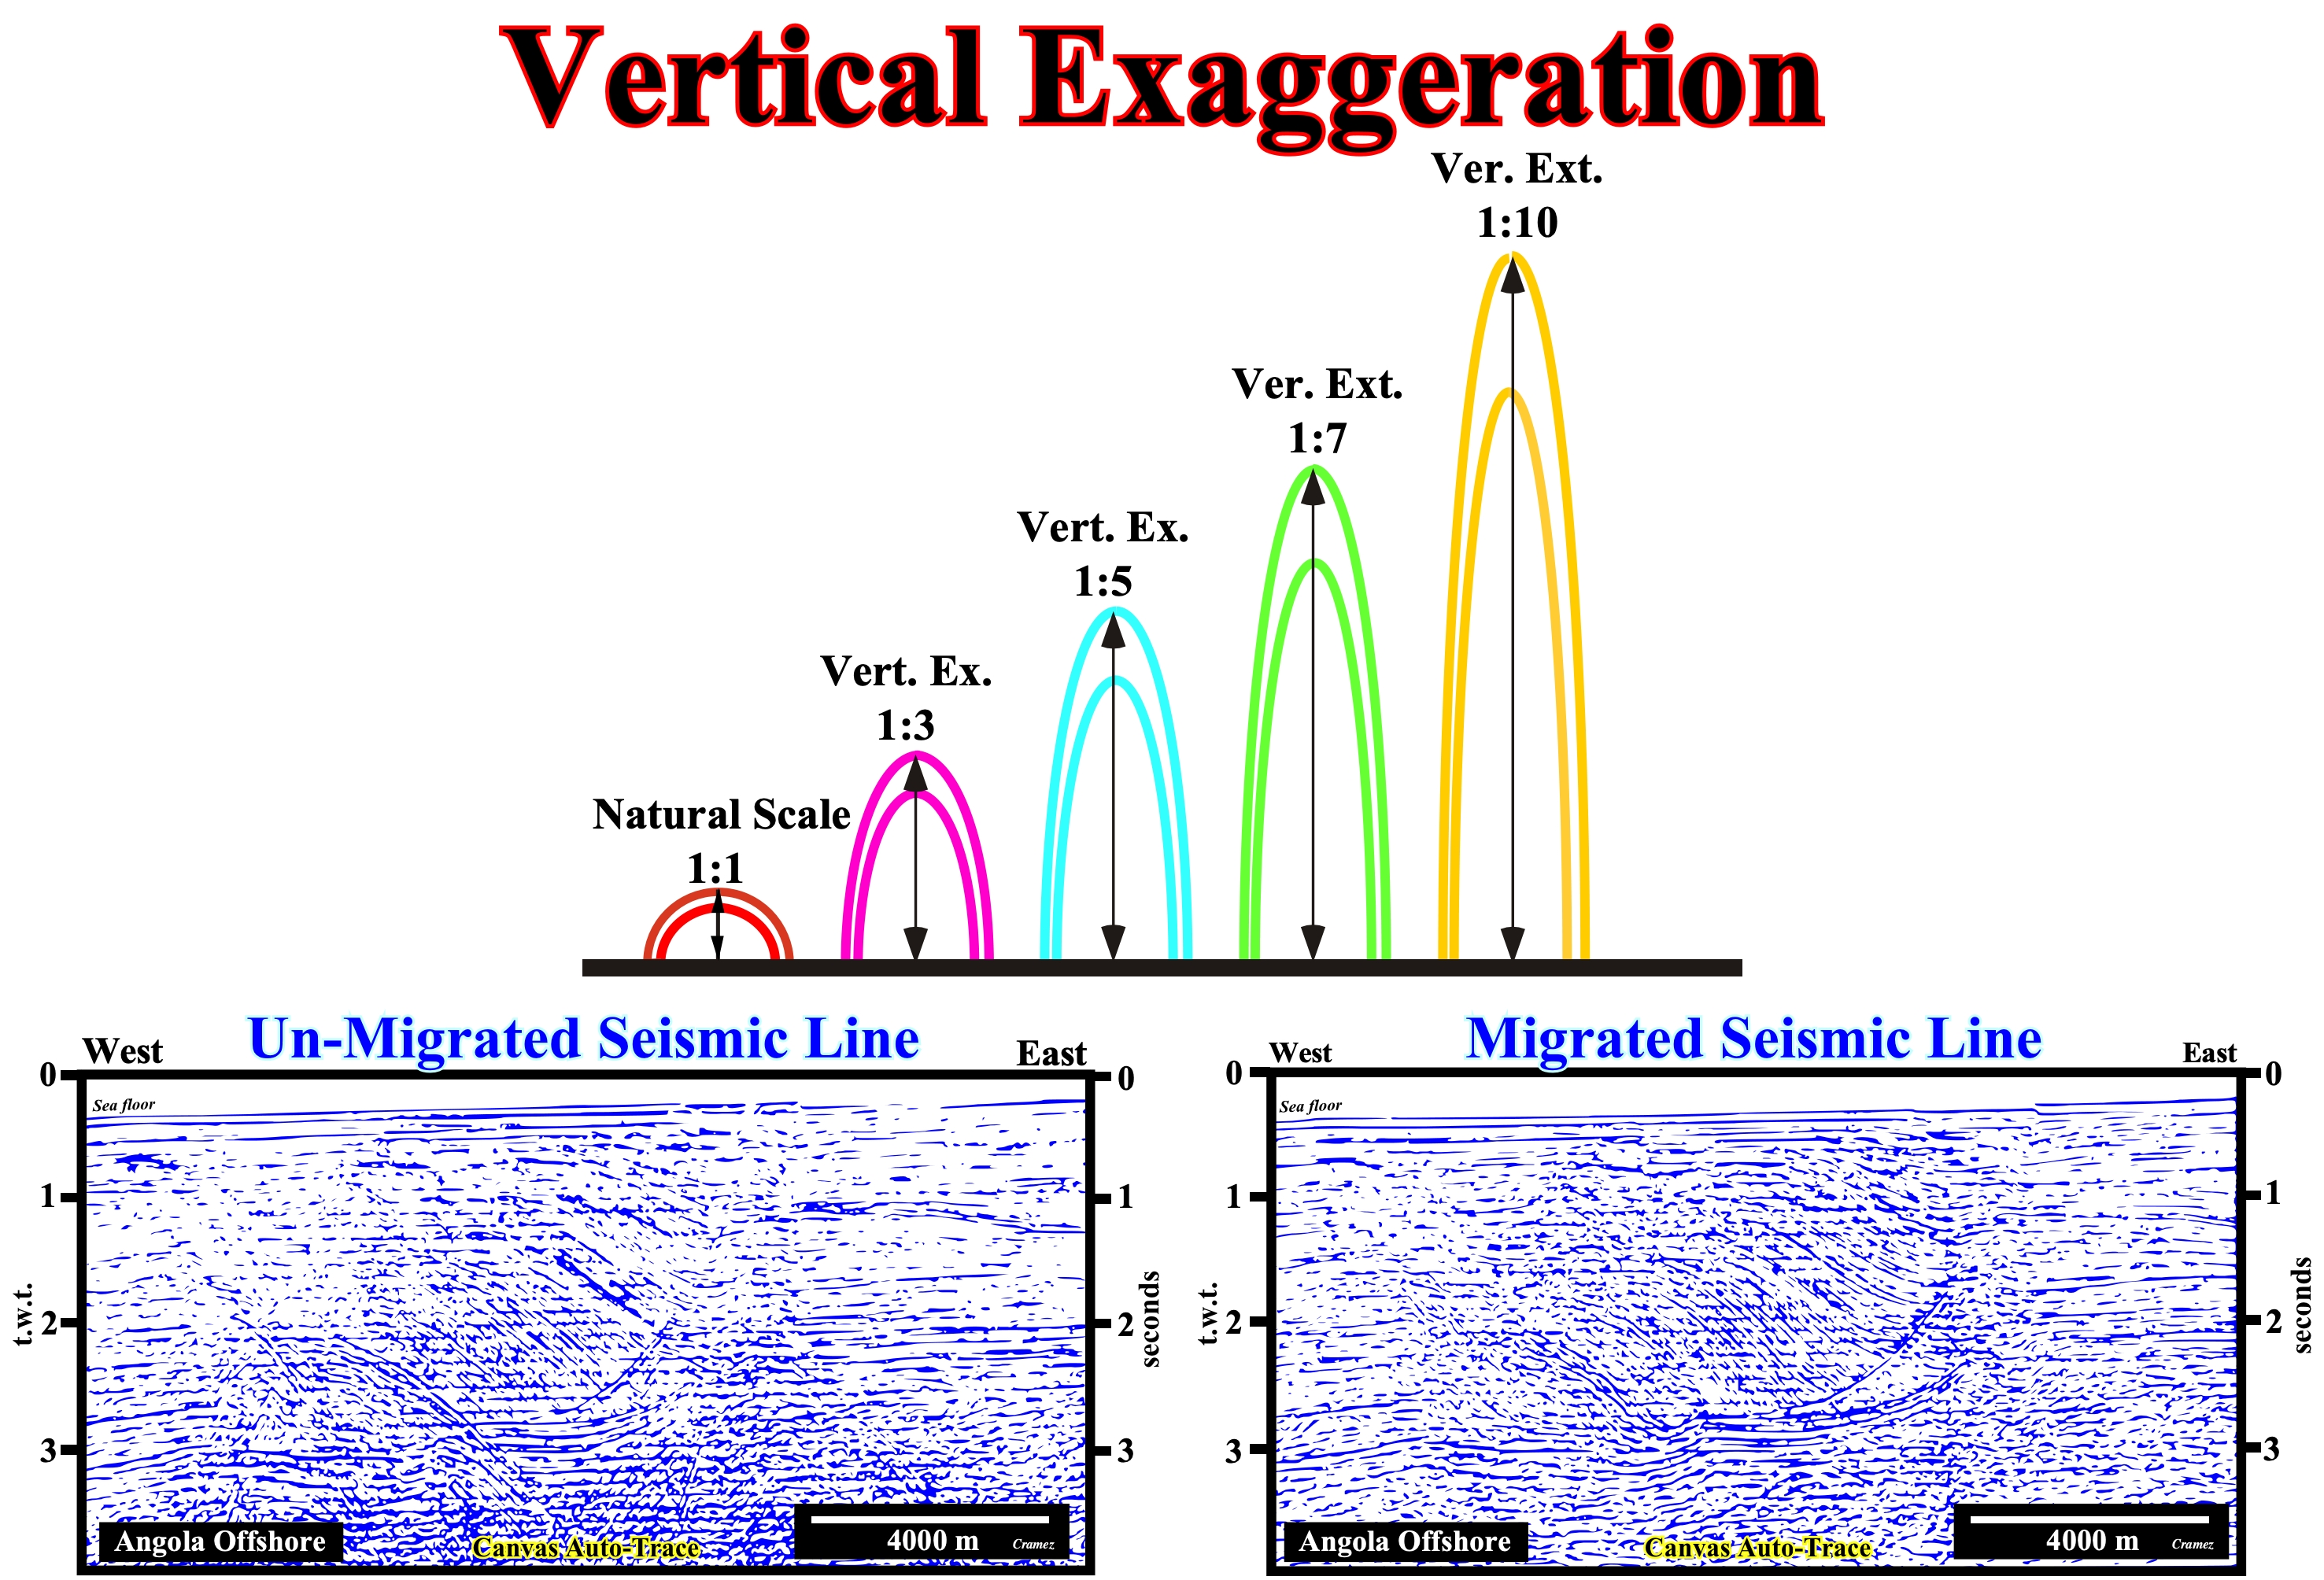
Figure 128- Assuming a sedimentary layer with constant thickness and deformed in anticline, with the distance between the flanks is half of the height, can be represented, at natural scale 1:1, for field-scale or scale (1: 1) by two equidistant half circles as illustrated. If the vertical scale is exaggerated by a factor 3, the thickness will appear not constant, since the apical zone will appear much thicker than in the flanks. The greater is the vertical exaggeration greater will be the difference in thickness between the apex zone and the flanks of the structures. In geological interpretation of seismic lines, this representation pitfall should be always present, in the mind of the interpreter, since all conventional seismic lines are vertically exaggerated by a factor ranging between 3 and 5 (taking into account that the vertical scale is in time). All this means that what interpreter retains in his brain (we do not not seen with the eyes but with the brain, the eyes are only an organ that take the light waves to the brain) when observed seismic lines here illustrated (un-migrated and migrated versions of the same seismic line) is not only in time but also exaggerated vertically, which has nothing to do with reality (see figure below).
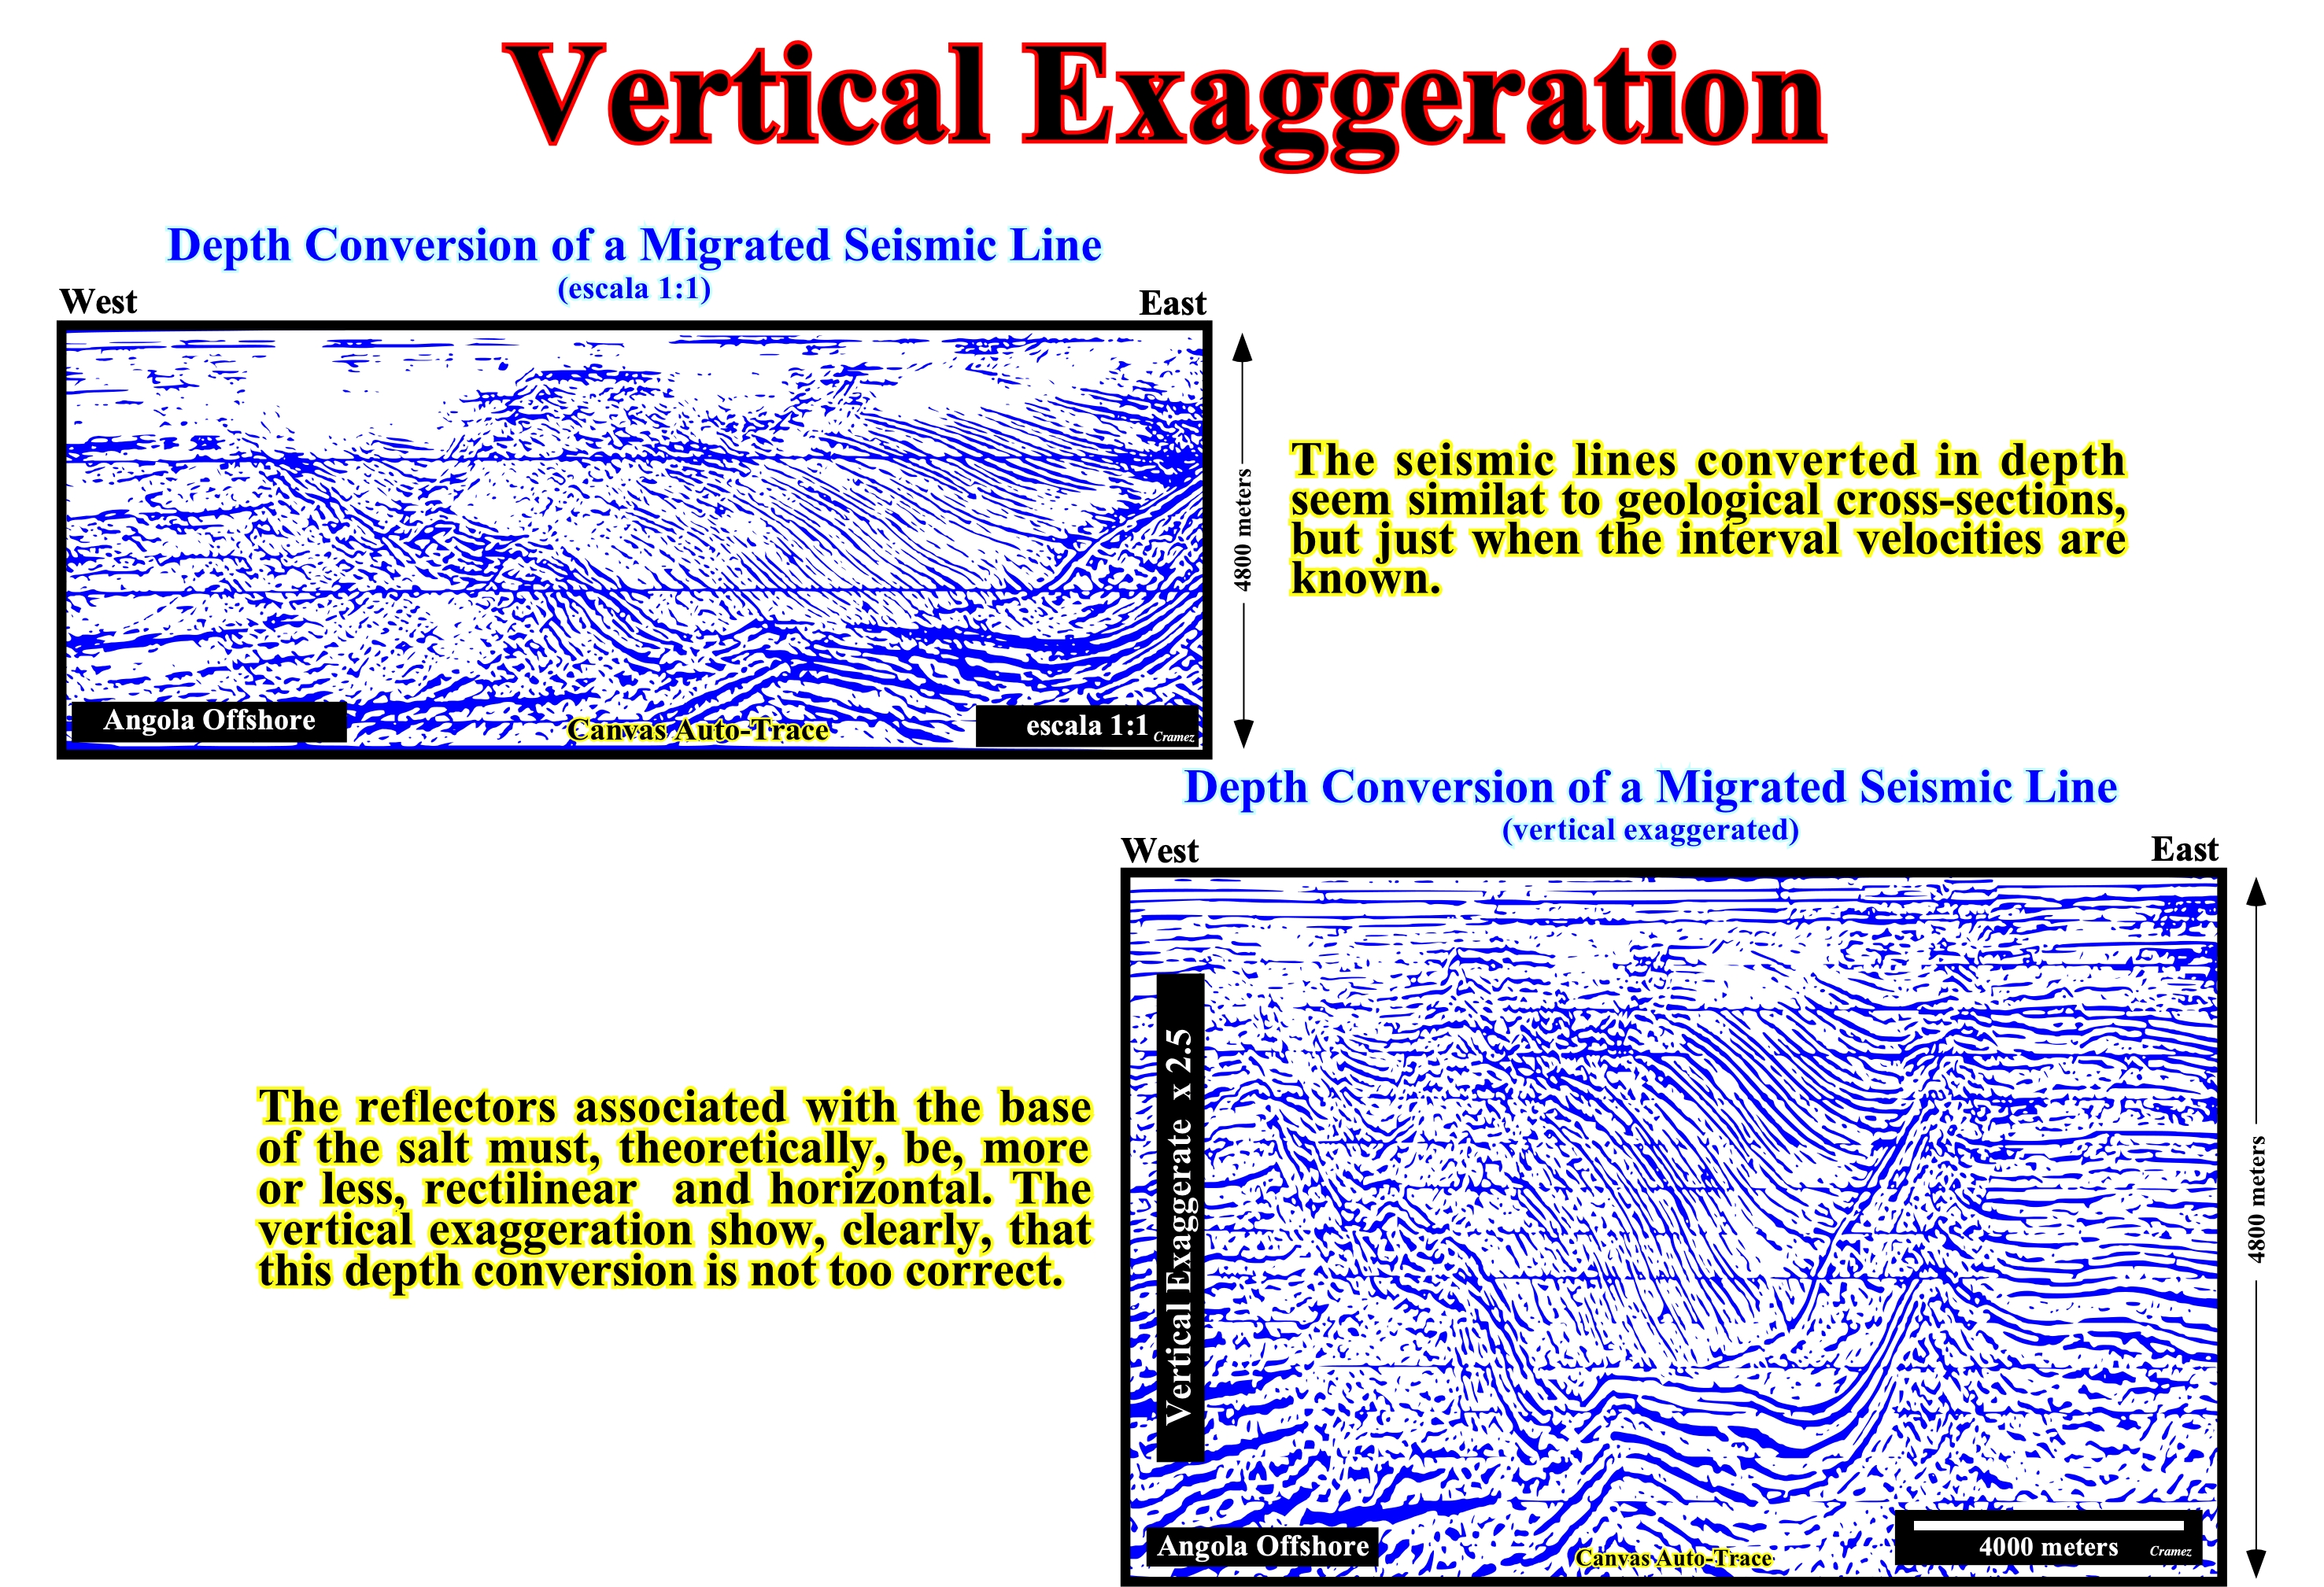
Figure 129- The image retained in the brain of an interpreter, when he observe, for instance, a seismic line migrated in depth with a 1: 1 scale, approaches much more to reality than, as previously, when he observed a seismic line migrated in time. However, it is important that the does not confuse "Being" and "Representing" (representation of Being". In other words, when a geoscientist observe a seismic line and says, that are basin floor fans, he is not watching basin floor fan ("Being"), but a representation of basin floor fans (Representation of the Being). Conversely, a depth conversion can just be made a posteriori, that is to say, when the interval velocities are known, what happen, almost always, after the drilling a well located not far from the seismic line.
10) Geometrical Relationships & Unconformities
The geometric relationships are significant at deposition time. The hiatus associated with an unconformity represents, simply, a prolongation of periods of subaerial exposures with minimal erosion, probably, with a local formation of an incised valley. Such a valley represents the period of uplift and subaerial erosion of older beds or an underwater erosion induced turbidite currents or submarine landslides.
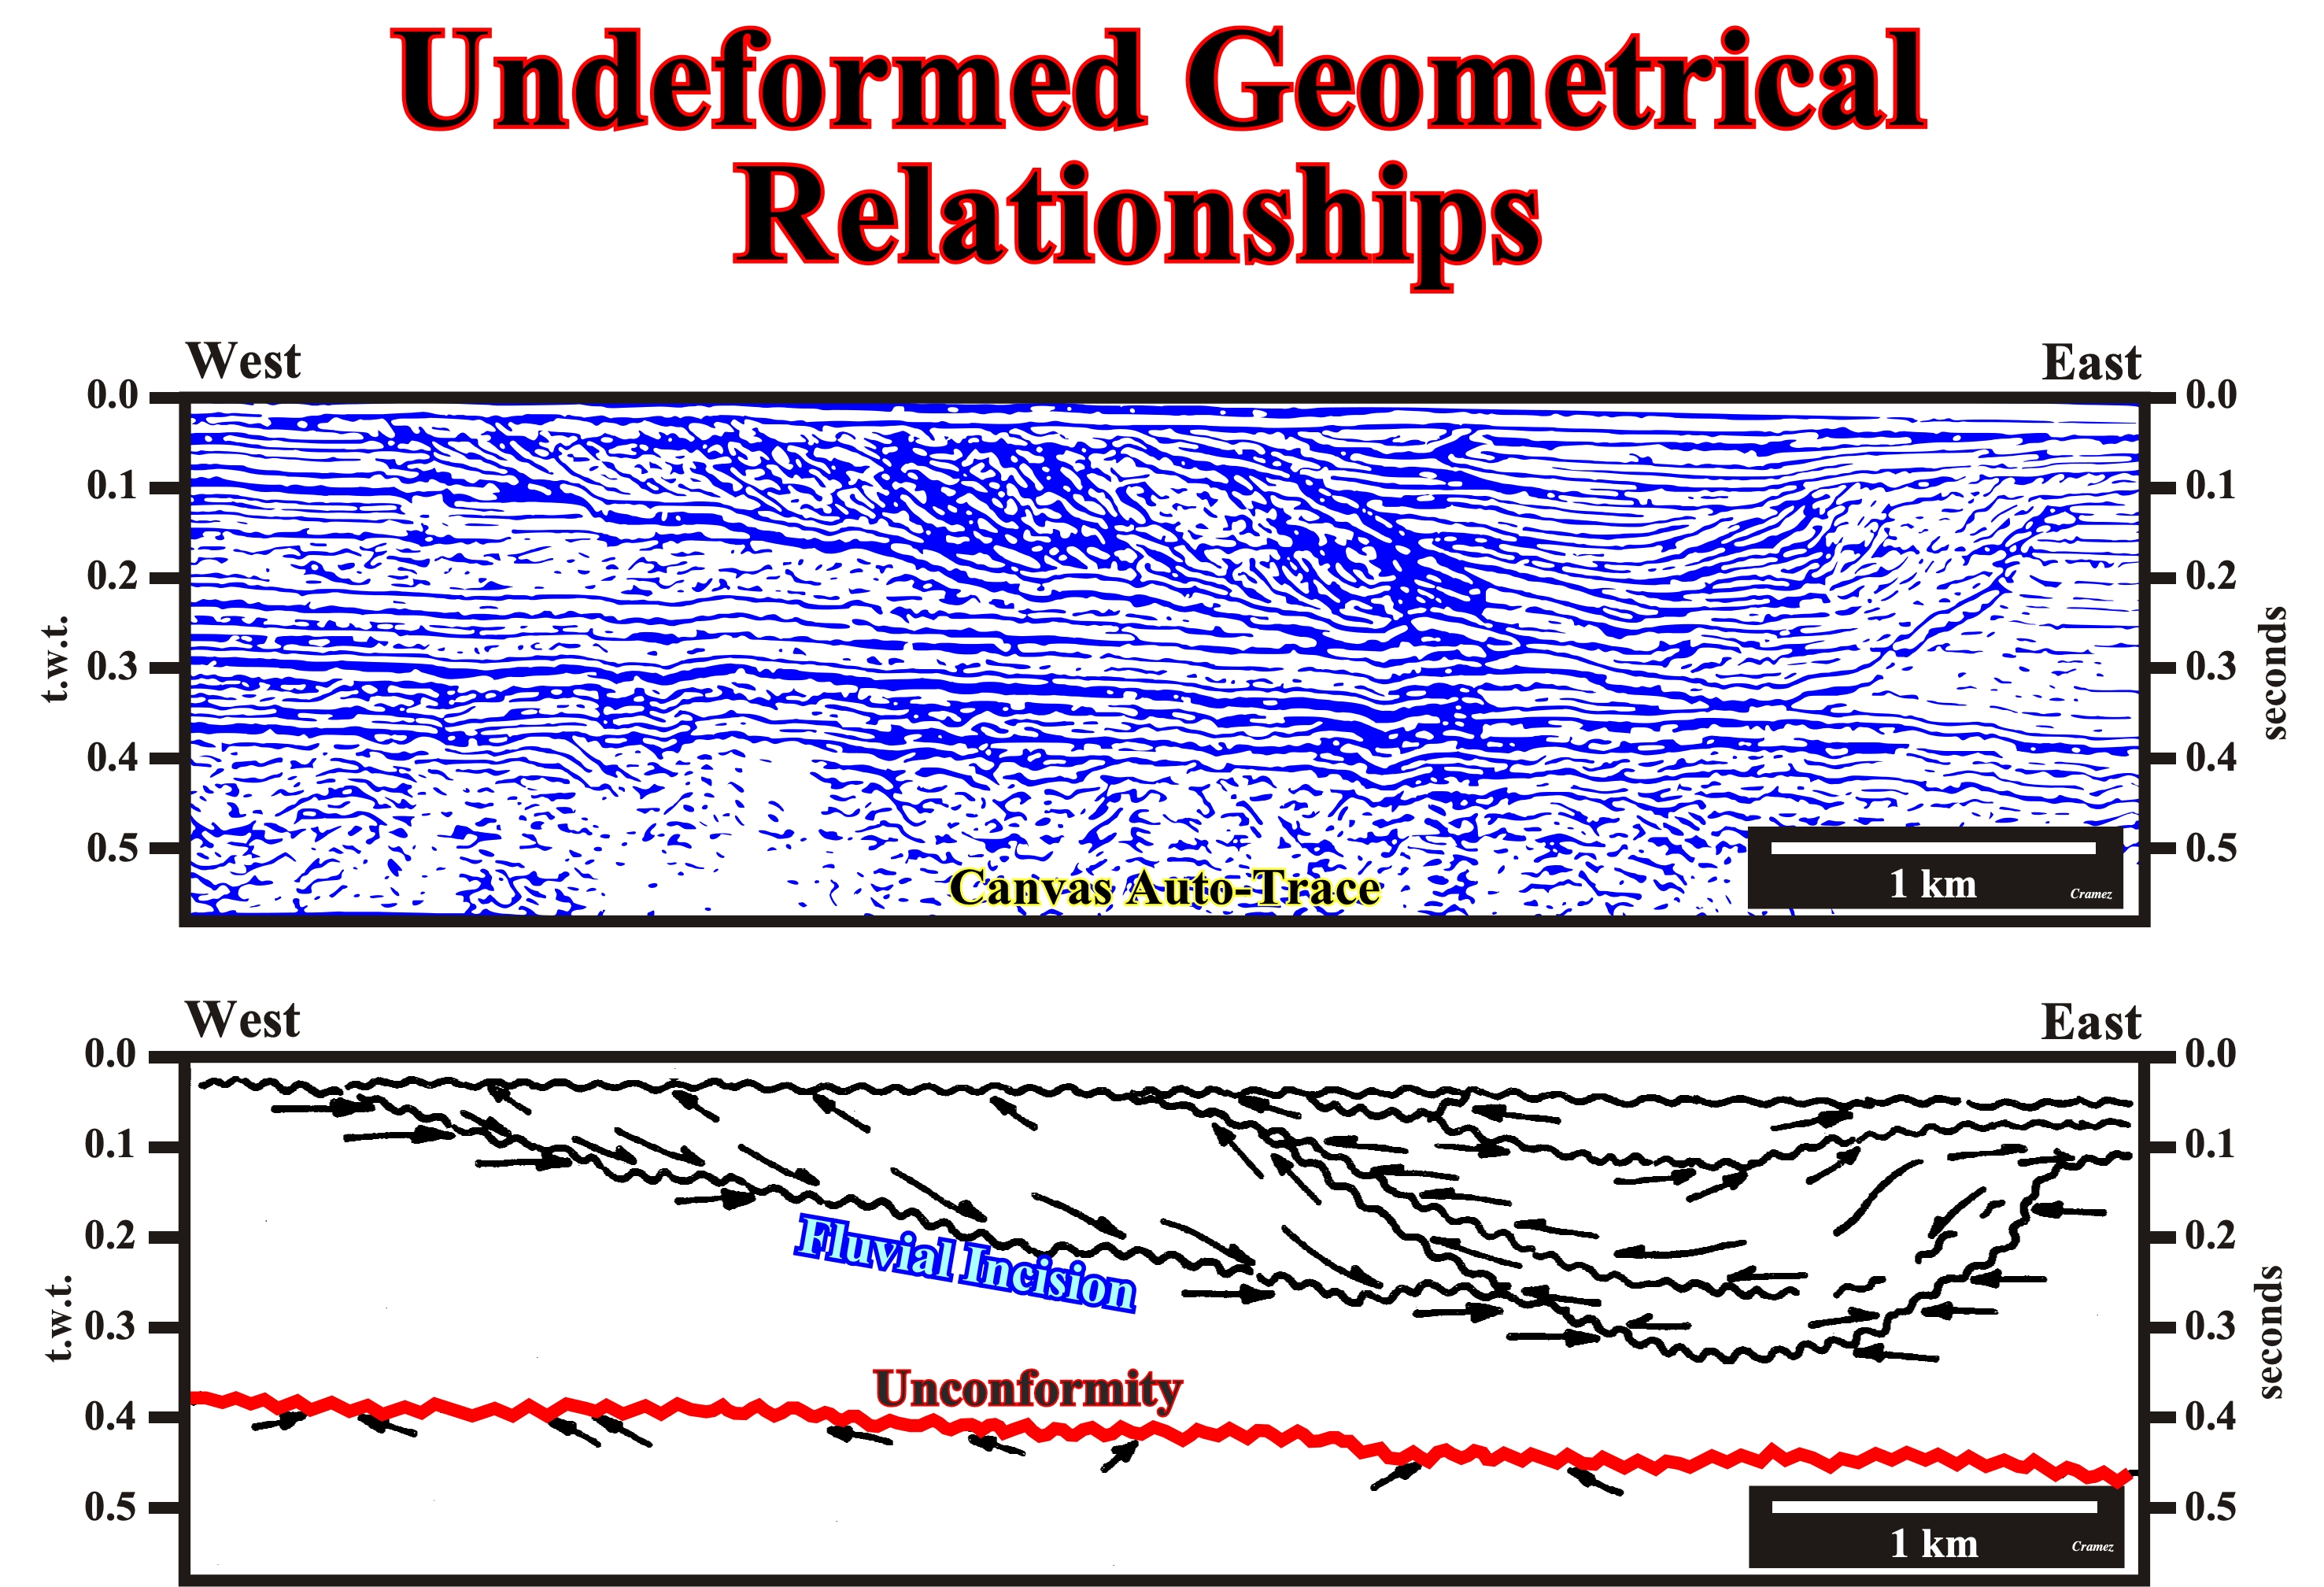
Fig130- In the tentative geological interpretation of seismic line are marked most of the reflector terminations. They define, mainly, onlaps, downlaps and toplaps by truncations. The lower toplaps by erosion define unconformities induced by a relative sea level falls . The other geometrical relationships in top of tentative interpretation, do not define unconformities, but discontinuities associated with the formation and evolution of a meander. The lower disconformity corresponds to a fluvial incision, while the others are induced by the variations of the stream flow velocity, which means that there is erosion and sedimentation at the same time and almost in the same place. As all geometric relationships are in their original position (they were not deformed) they retain intact their geological significance, which, usually, is not the case when they are deformed by tectonics.
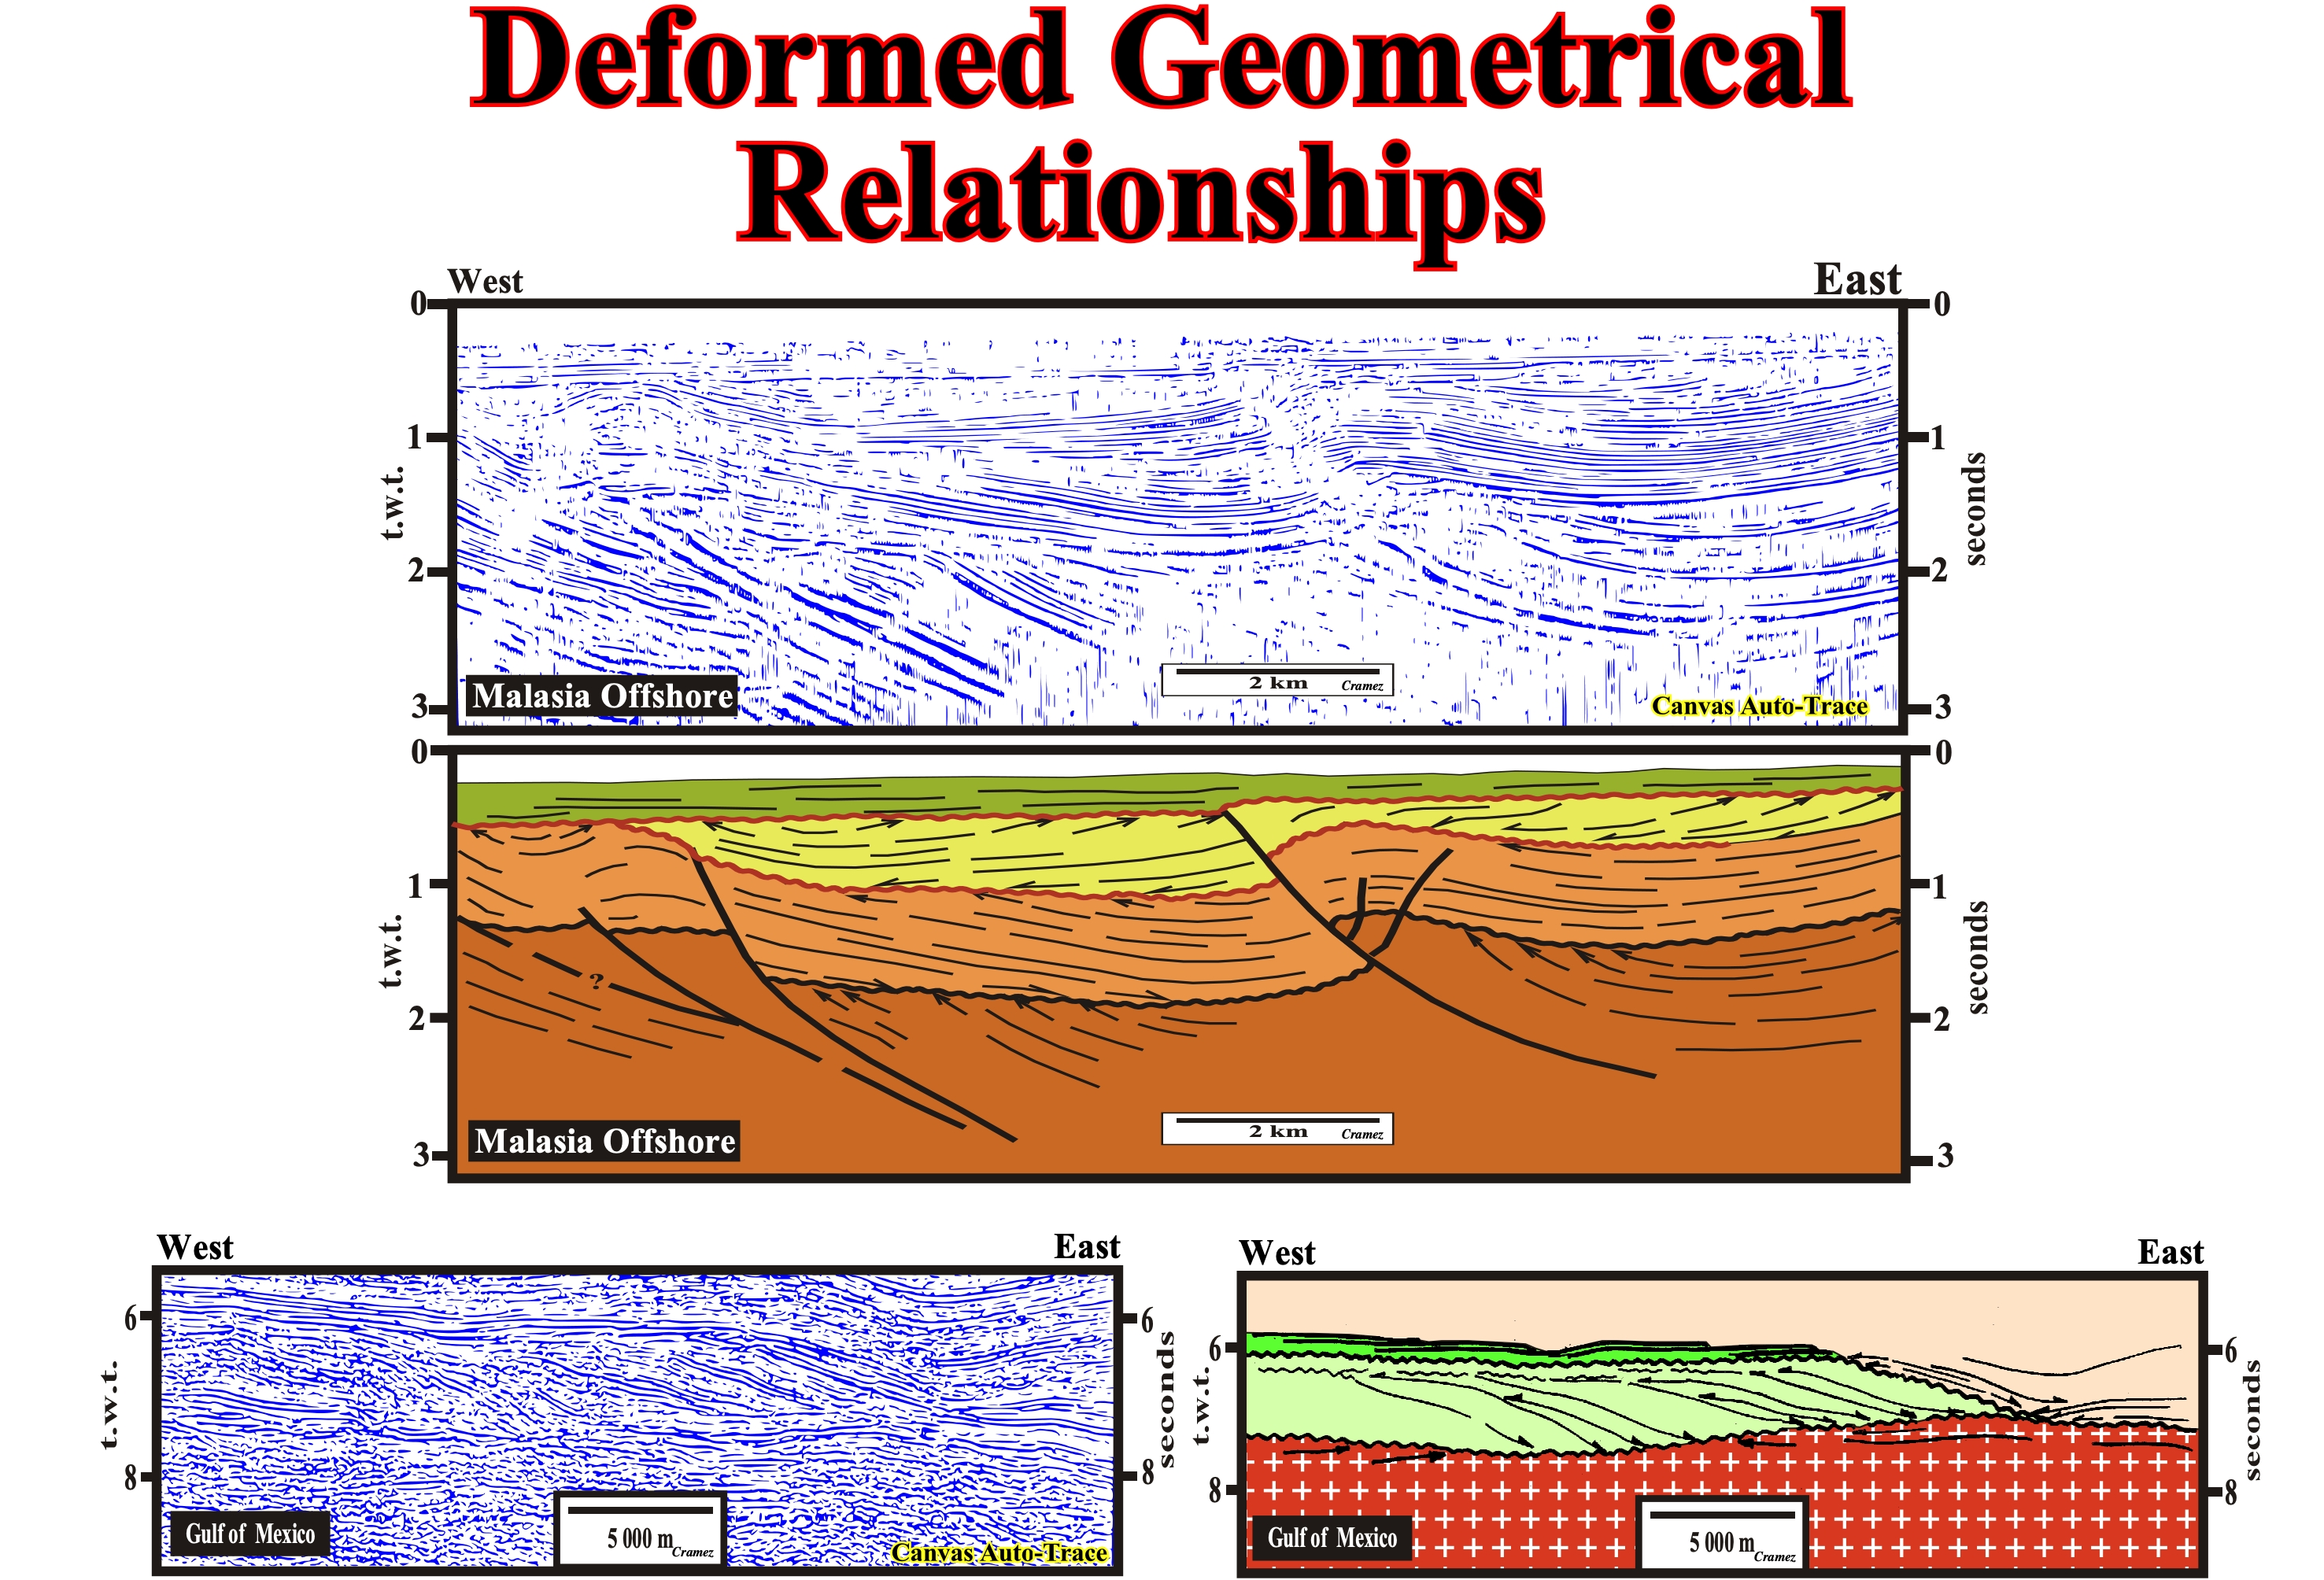
Figure 131- In the line above, the geometric relationships were slightly deformed and have not lost the original geological meaning. On the seismic line at bottom, as one can be on the tentative geological interpretation, the geometric relationships at bottom of yellow interval seem to be downlaps, but in reality are not. They are not in its original position. They were, totally, tilted eastward and downward as the salt, that support them, flowed laterally. They correspond to apparent downlaps, which are nothing else that onlaps, which by halokinesis took an oblique position. Thus, they do not give the direction of the terrigeneous influx as it is the case of the downlaps.
11) Overbank Deposits (fluvial & turbiditic)
Fluvial levees (overbanks, embankment) need a river, which to exist needs to have a bed (Figure 132). Turbiditic levees needs a gravity current, which does not requires any bed to flow downdip.
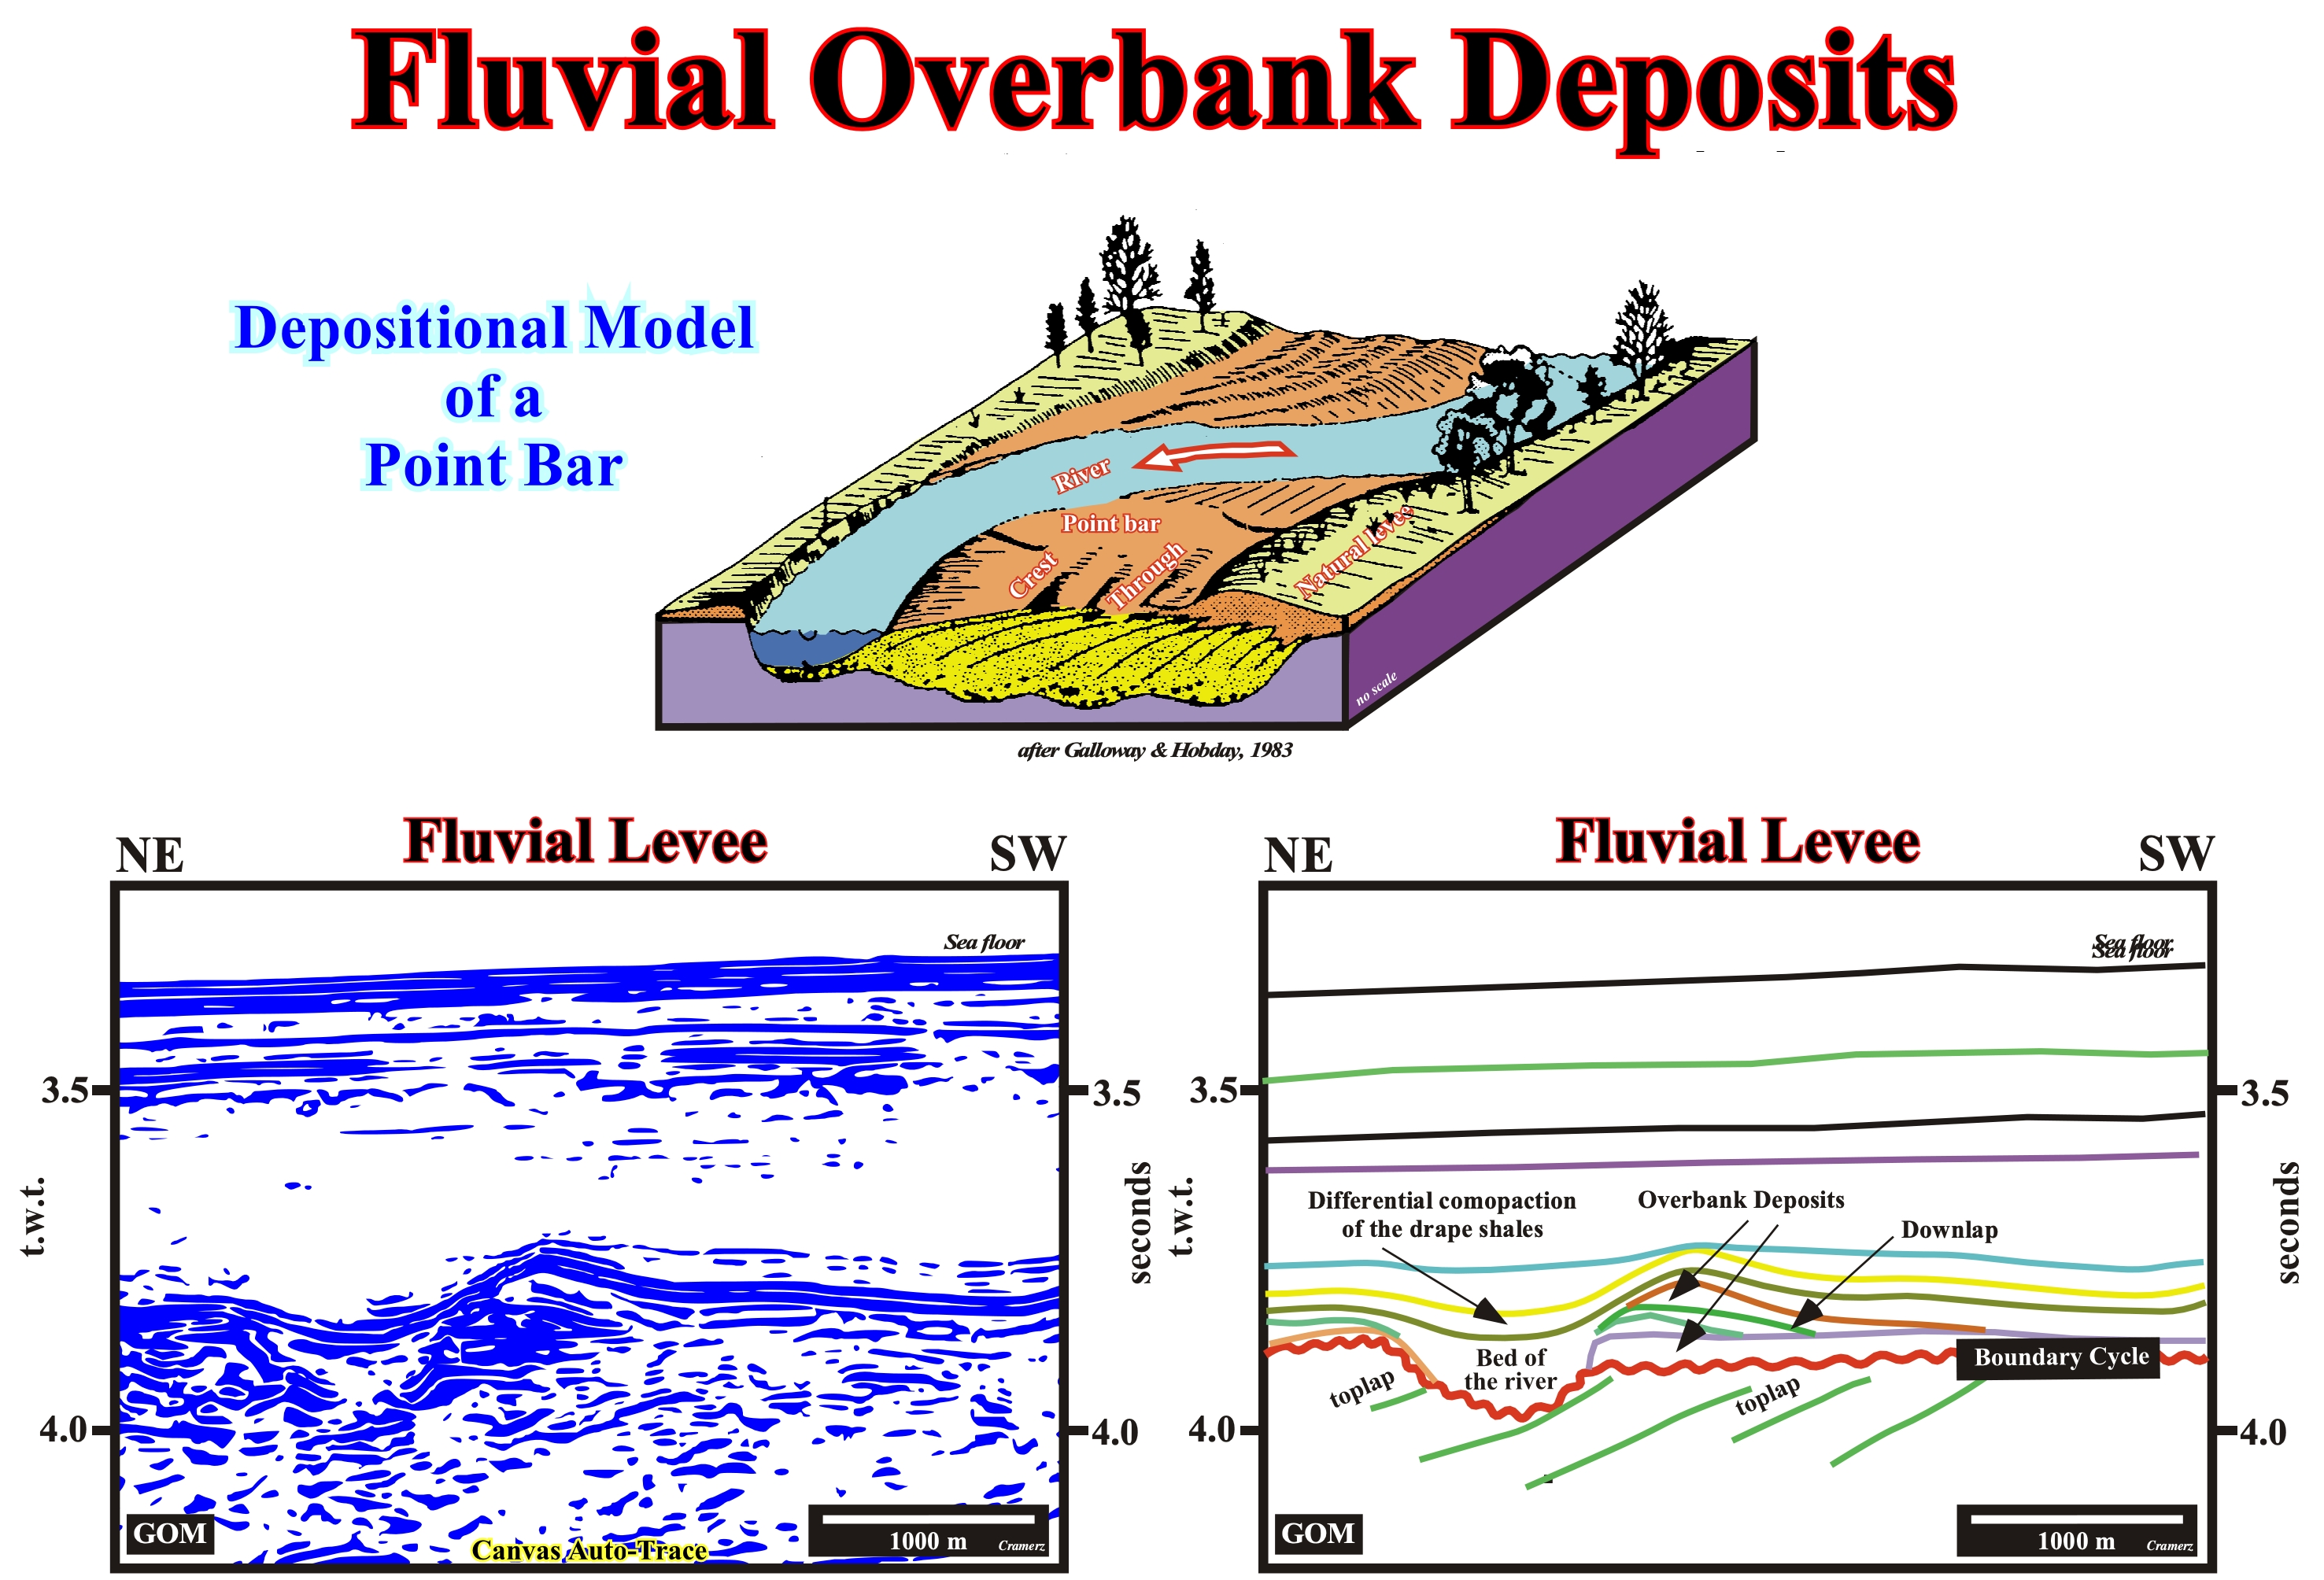
Figure 132- This seismic line from the Gulf of Mexico illustrates natural levees (overbanks) associated with a river (probably with a meander, since the overbank deposits are just on one side), as suggested by the tentative geological interpretation of the seismic line and by the deposition model of a meander bar. A river, like any other watercourse, needs a bed to flow, which is not the case of a turbidite current as suggested in the following figure.
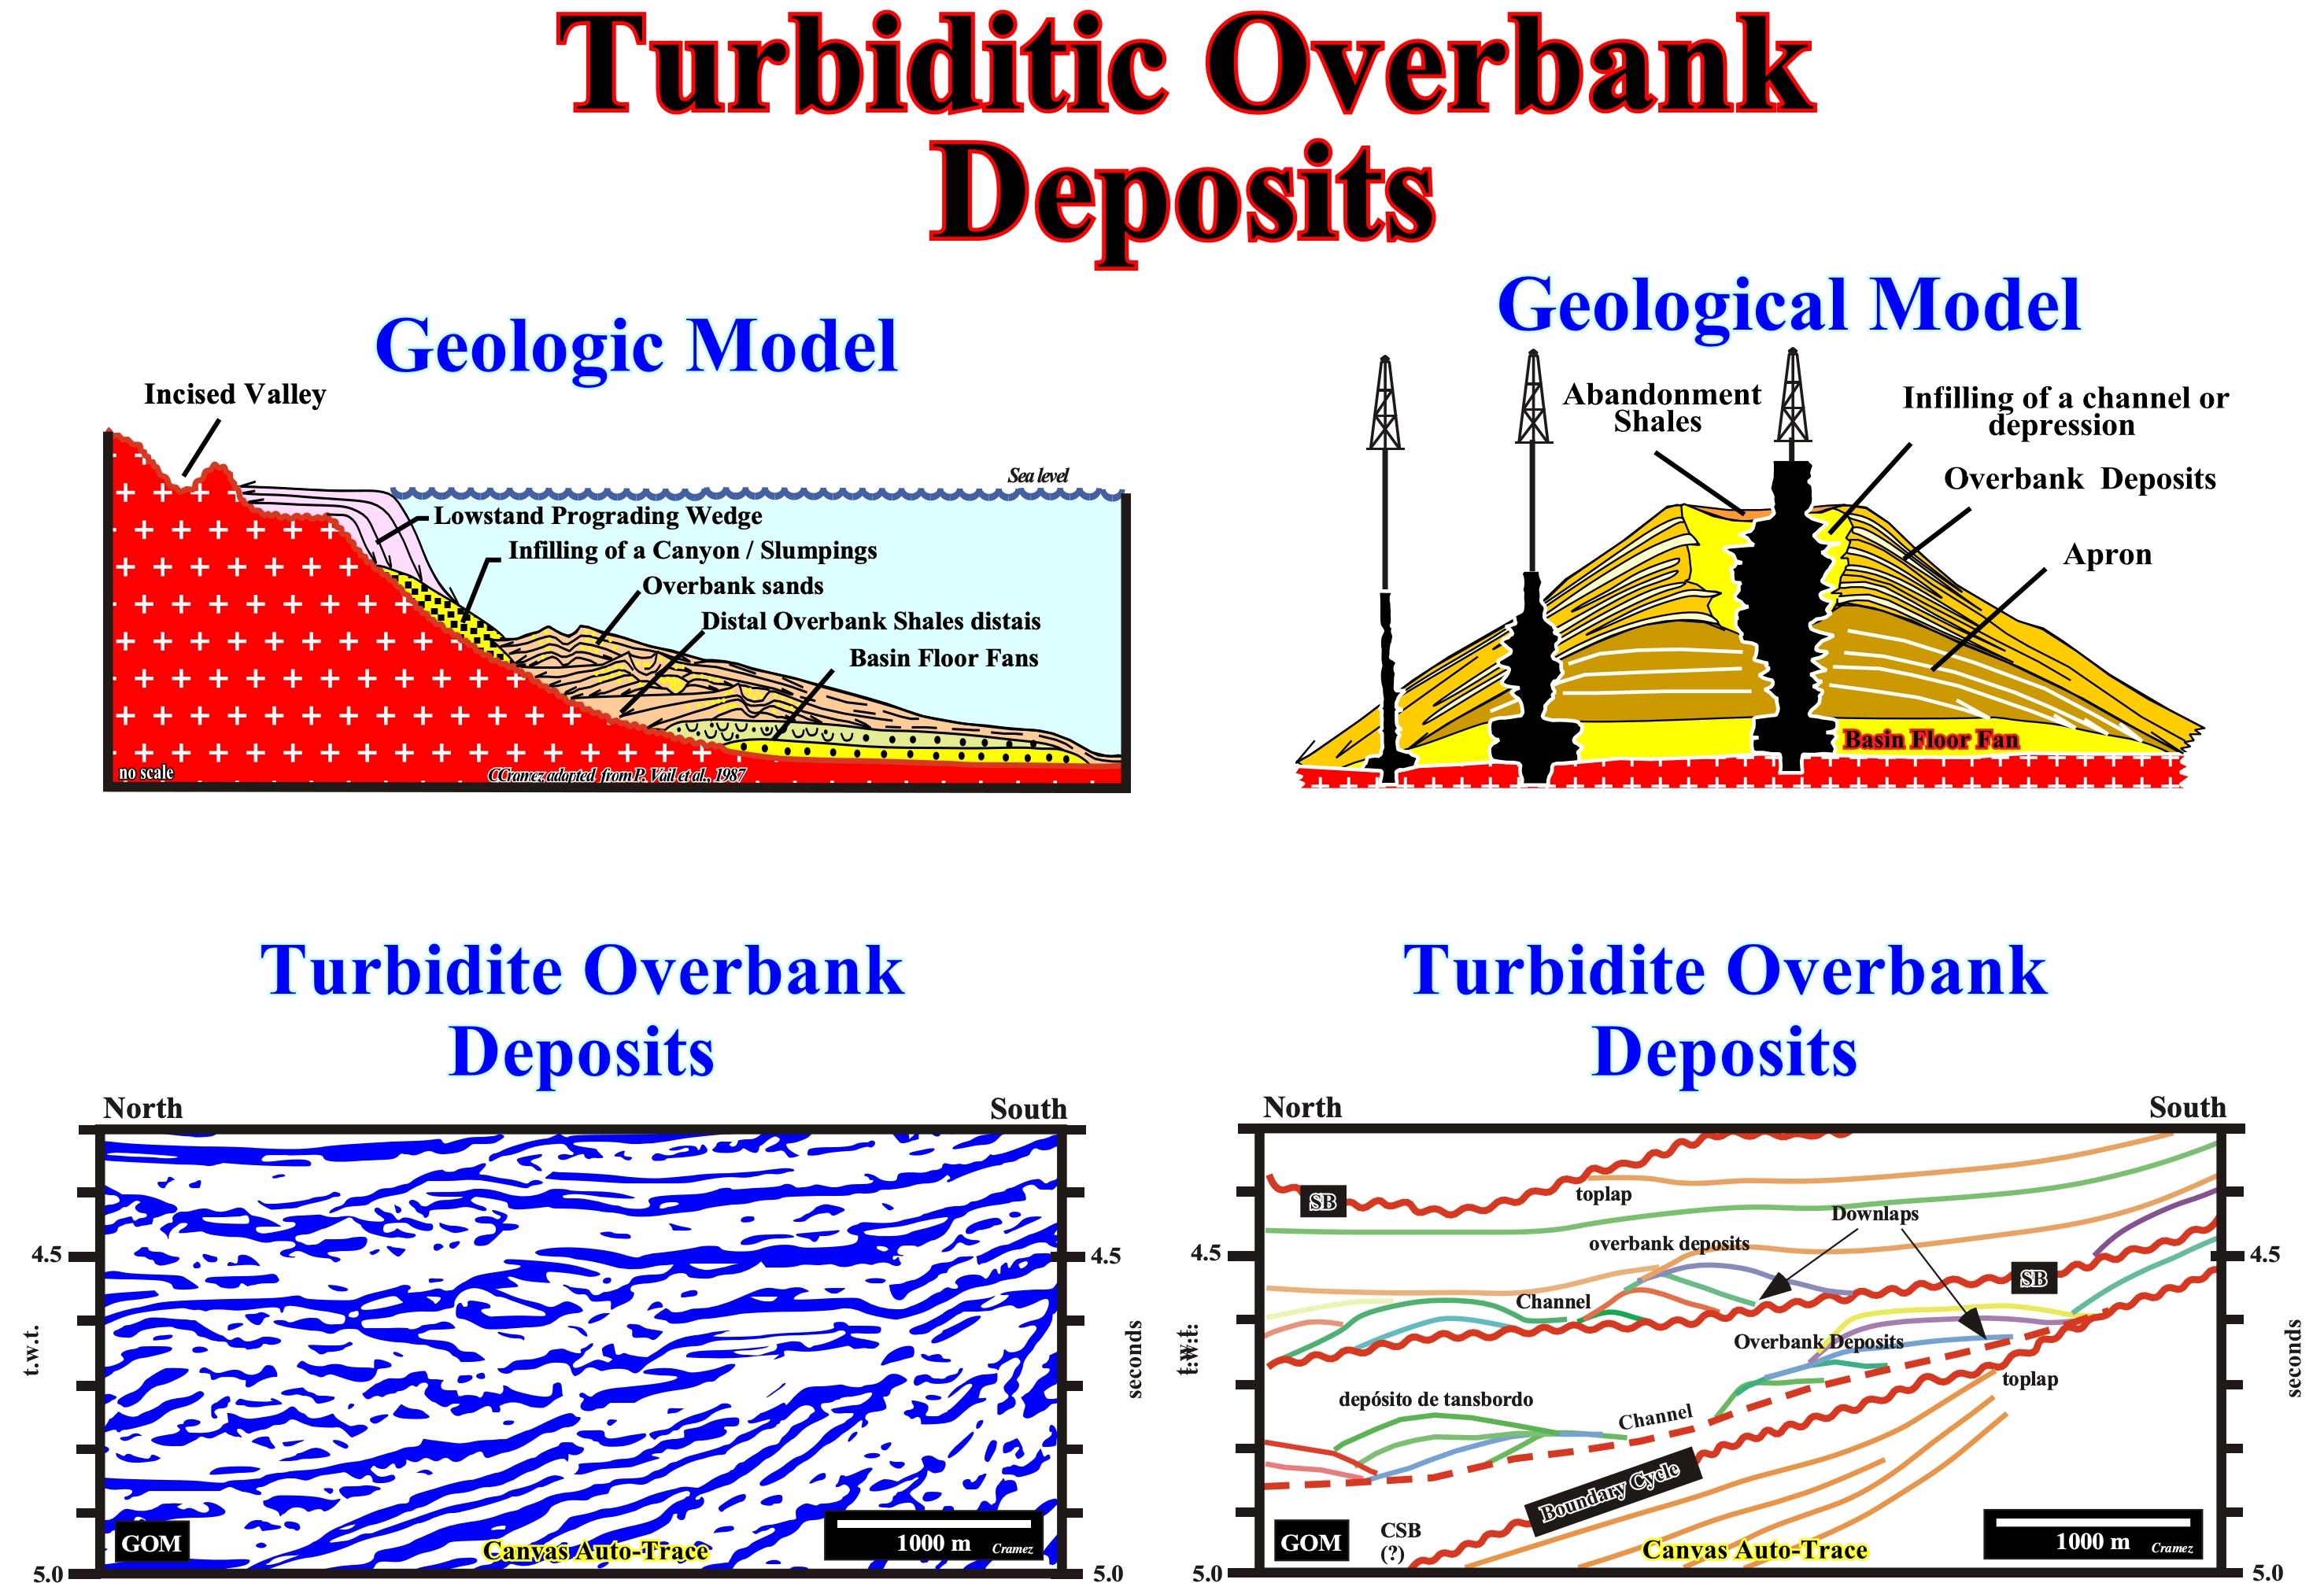
Figure 133- As previously stated a river or other water body needs a bed to flow, which is not the case with turbidite current. This means that the natural river levees to be formed need restricted (contained within limits) current, while natural turbidite levees do not need to be associated with a bed or channel, since a turbiditic current is not a restricted current. Turbidite levees are formed in the same way that when, on the beach, you launches the contents of a bucket full of a mixture of water and sediment on the sand. The bucket contents flows (turbiditic current) over the beach (no bed or channel) depositing two elongated lateral mounds on each side of the central outlet area, which having a higher speed transports the sediments further. The result is the deposit of two levees on either side of an area without deposition, more or less, straight and a small central mound a little further, formed by fine sediments. If a second launching a similar content is made at the same place, the current is channelized through the zone without deposition and two new natural levees are formed, more or less, above, as well as another central mound id deposited over the former. The deposit of the second levees increases the relief between the central zone, without deposition, and levees deposition zone, which will increase the channeling of these currents. This deposition mechanism is outlined, longitudinally, in the geological model illustrated on the of the left (in more detail). The seismic line and its tentative geological interpretation support this type of deposition in which turbiditic levees are deposited on either side of an area without deposition (not on each side of a channel). However, sometimes a turbiditic current, not necessarily the first, can eventually erode the substrate forming a small valley that many geoscientists call erroneously, from our point of view, turbidite channel.