
In the intermodal salt model proposed by Arbenz (1986), as illustrated in the next plate, the associated antiform structures may, or may not, have residual salt. These two possibilities have been respectively labelled:
a) Residual high and
b) Turtle-back structure.
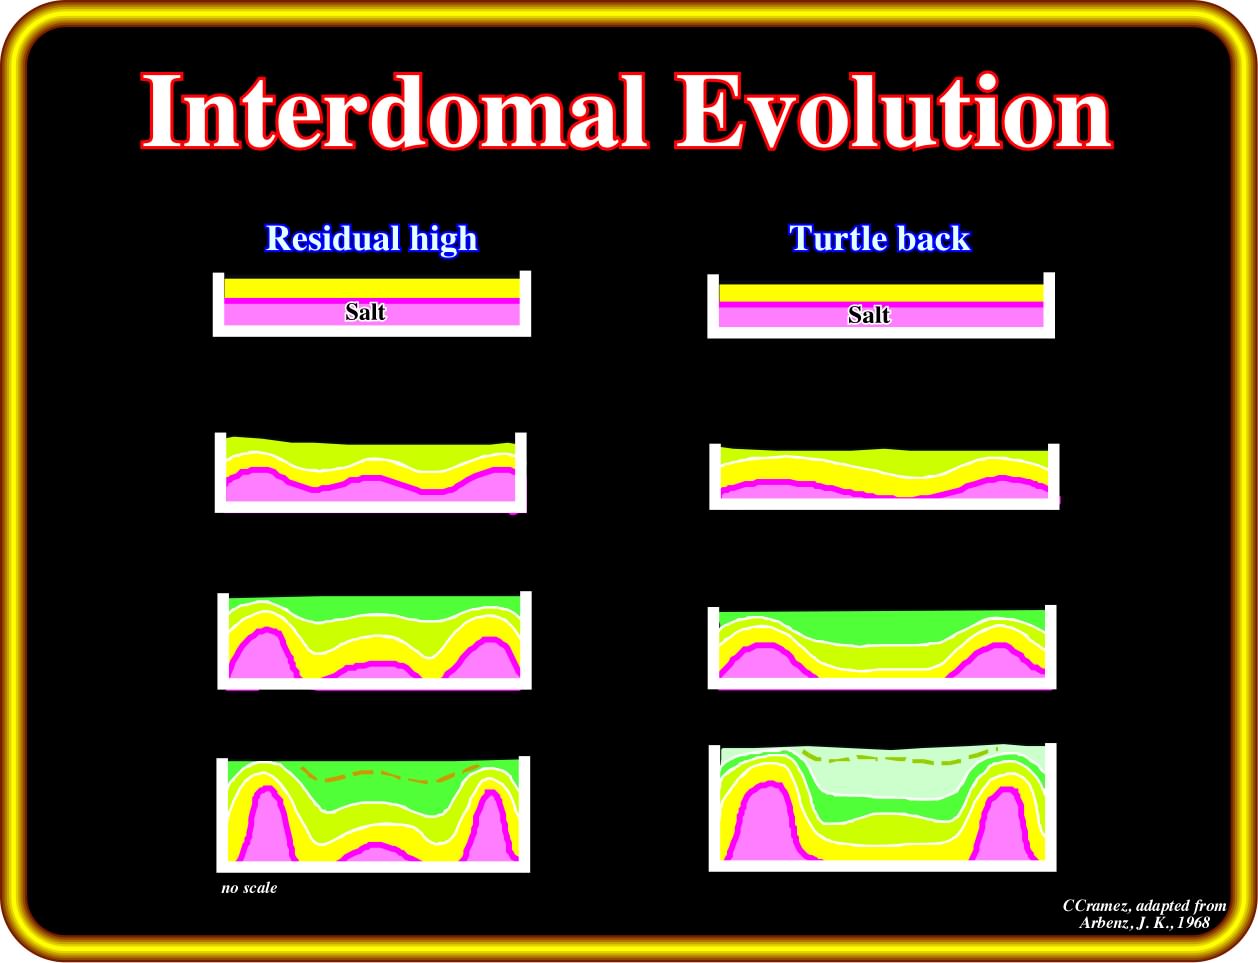
Residual highs are antiforms with a core of salt that may be disconnected from the adjacent domes. In these structures, the high structural points have always been high and the lows always been in a low position. In other words, there is no tectonic inversion associated with them. Turtle-back structures are also antiform structures. However, the high structural points were low, and vice versa. These structures are the result of tectonic inversions due to salt flowage. Therefore, when a turtle-back structure is proposed as a hydrocarbon trap, geoscientists should date the tectonic inversion relatively to the migration time of the hydrocarbons. A priori, the migration time must postdate the trap formation.
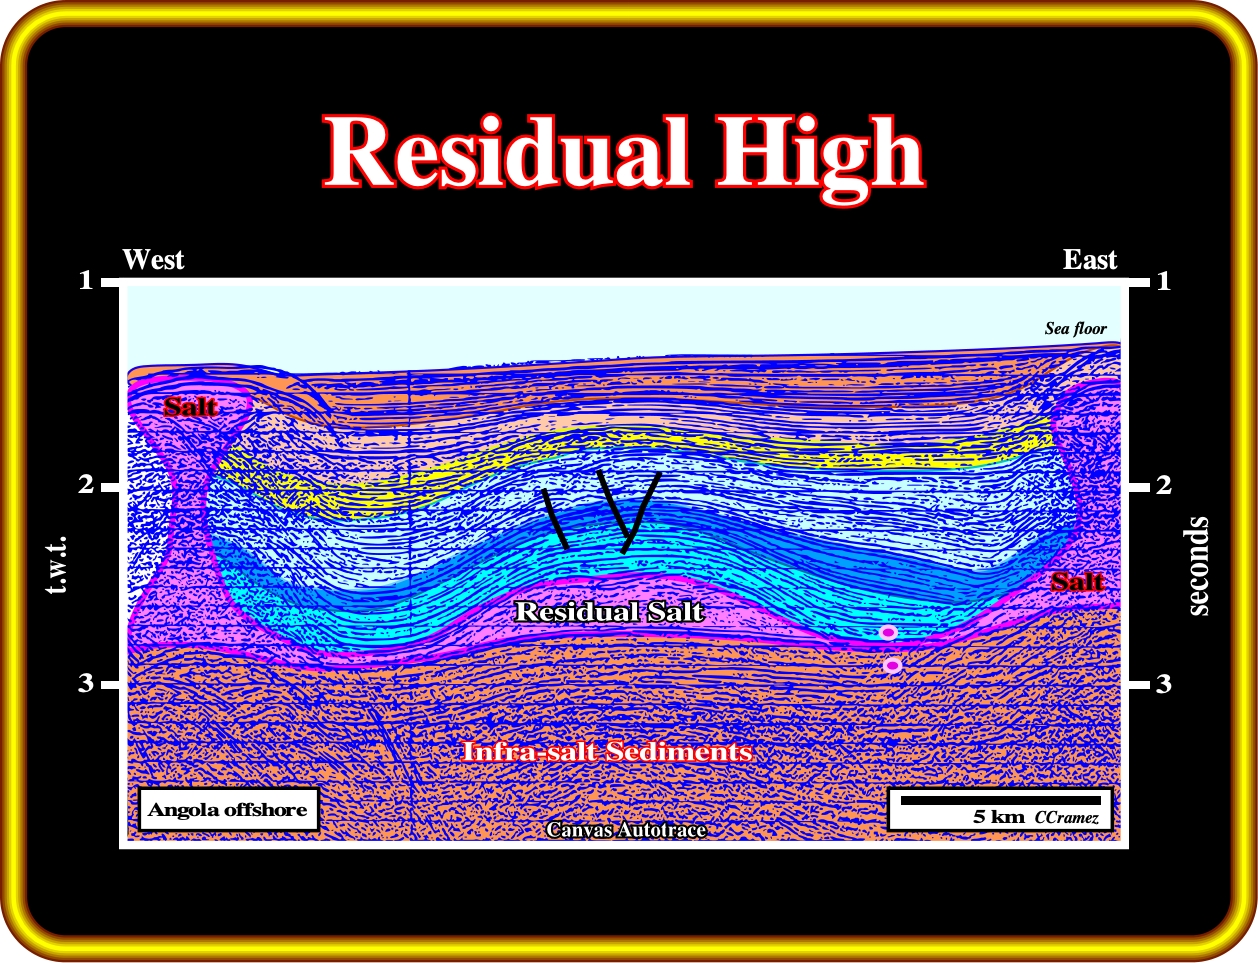
On this geological tentative interpretation of a deepwater unmigrated seismic line (Seffel, 1968) from Angola offshore, Petrangol (Fina) and Total's geoscientists recognized a large antiform structure with a thick residual salt in its core. At present time, this structure is quite well known. It contains two major oil fields, Girassol and Dalia discovery by ELF (presently Total SA). Notice that the petroleum accumulation are not located within the carbonaceous sediments of the turtle back, but uppermost levels of the antiform structure in turbidite channel-leveed complexes (slope fans).
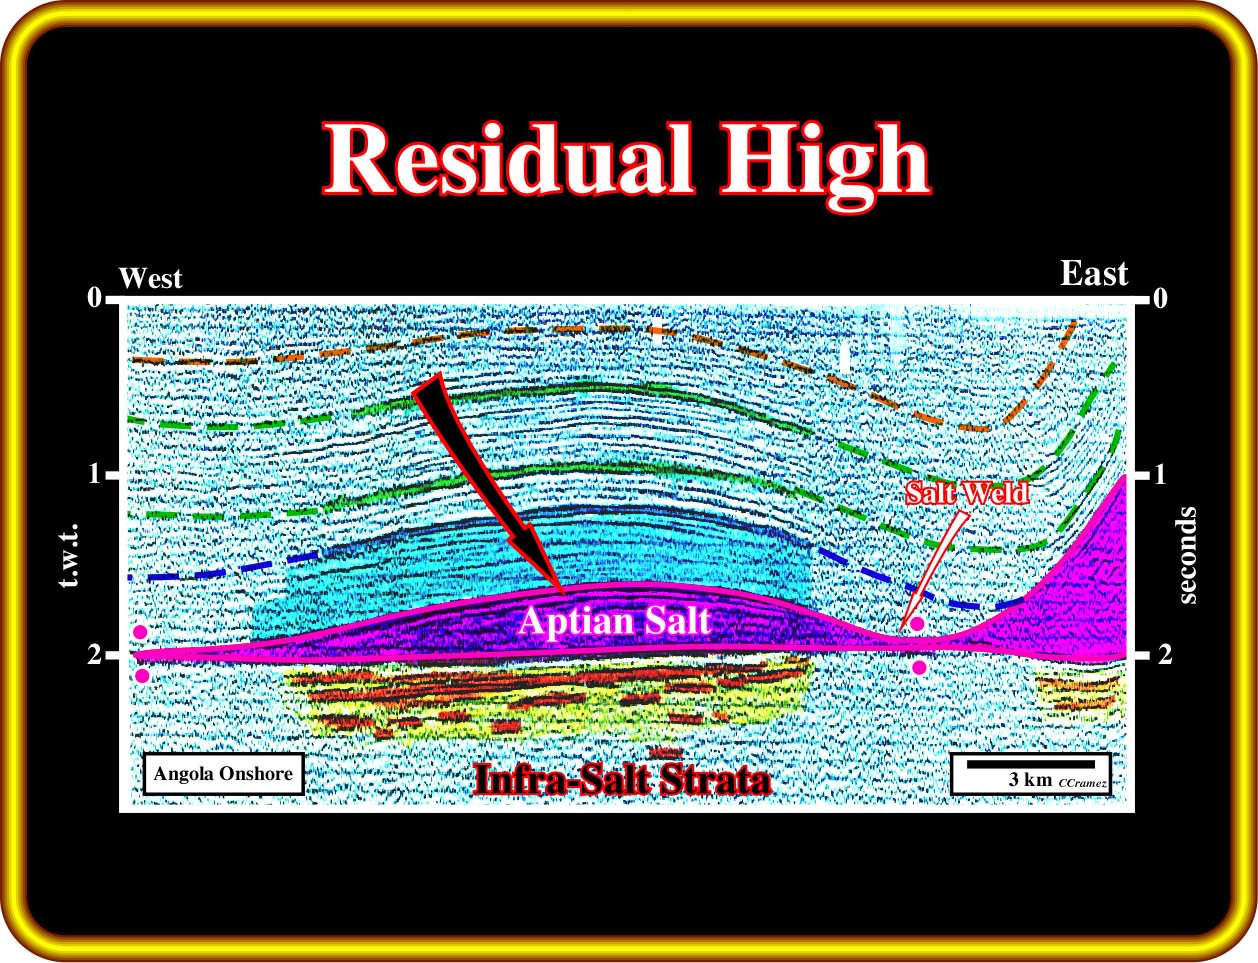
On this geological tentative interpretation of an old seismic line of the Kwanza onshore, a residual high of the salt is quite evident. Here, the residual high is disconnected from the associated salt domes, which have evolved with time, by two salt welds, above which two rim synclines are obvious, particularly ,the one on the left. It is interesting to notice the presence of seismic reflectors below the salt. However, the quality of the seismic line does not allow to recognize if they are induced by margin infra-salt sedimentary interfaces (postdating the breakup unconformity) or by rift-type basin sedimentary interfaces (predating the breakup unconformity) or both.
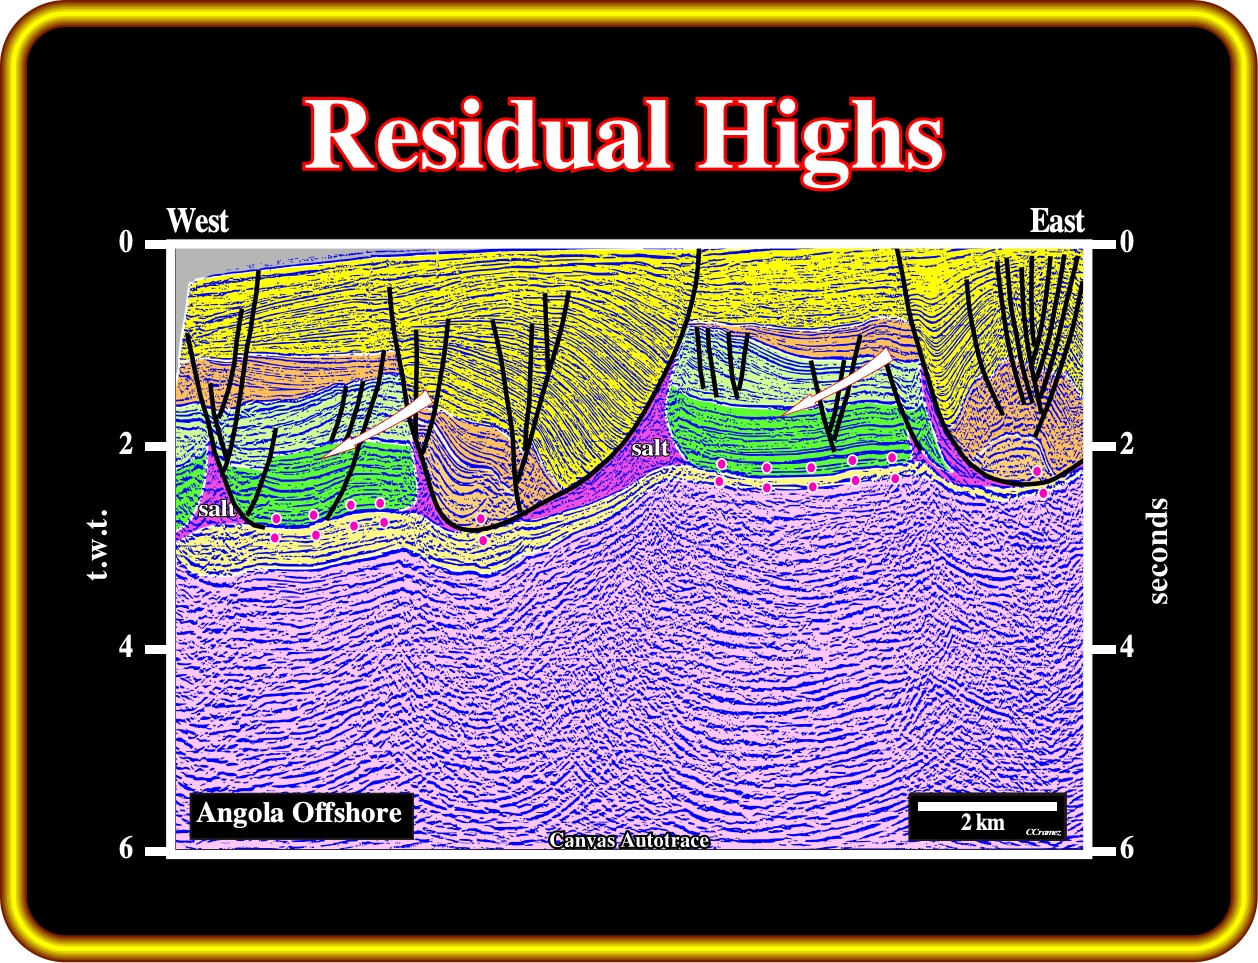
In this geological tentative interpretation Cretaceous residual highs are well recognized above primary salt welds. Below the bottom of the salt or associated salt welds there is a margin sand-shale interval (yellow), which overlies subaerial lava flows. Such a lava flows were recognized by drilling. A exploration well tested the residual high and was stopped after drill more than 500 meters of post breakup subaerial lava flows.
Geoscientists working on salt basins recognized antiform structures between salt domes as one of the best potential hydrocarbon trap targets. A lot of these targets were tested. However, after a large number of dry wells, geoscientists tried to understand how these structures were formed. Trusheim proposed a halokinetic geological model to explain these interdomal antiform structures that he named turtle-back structures.
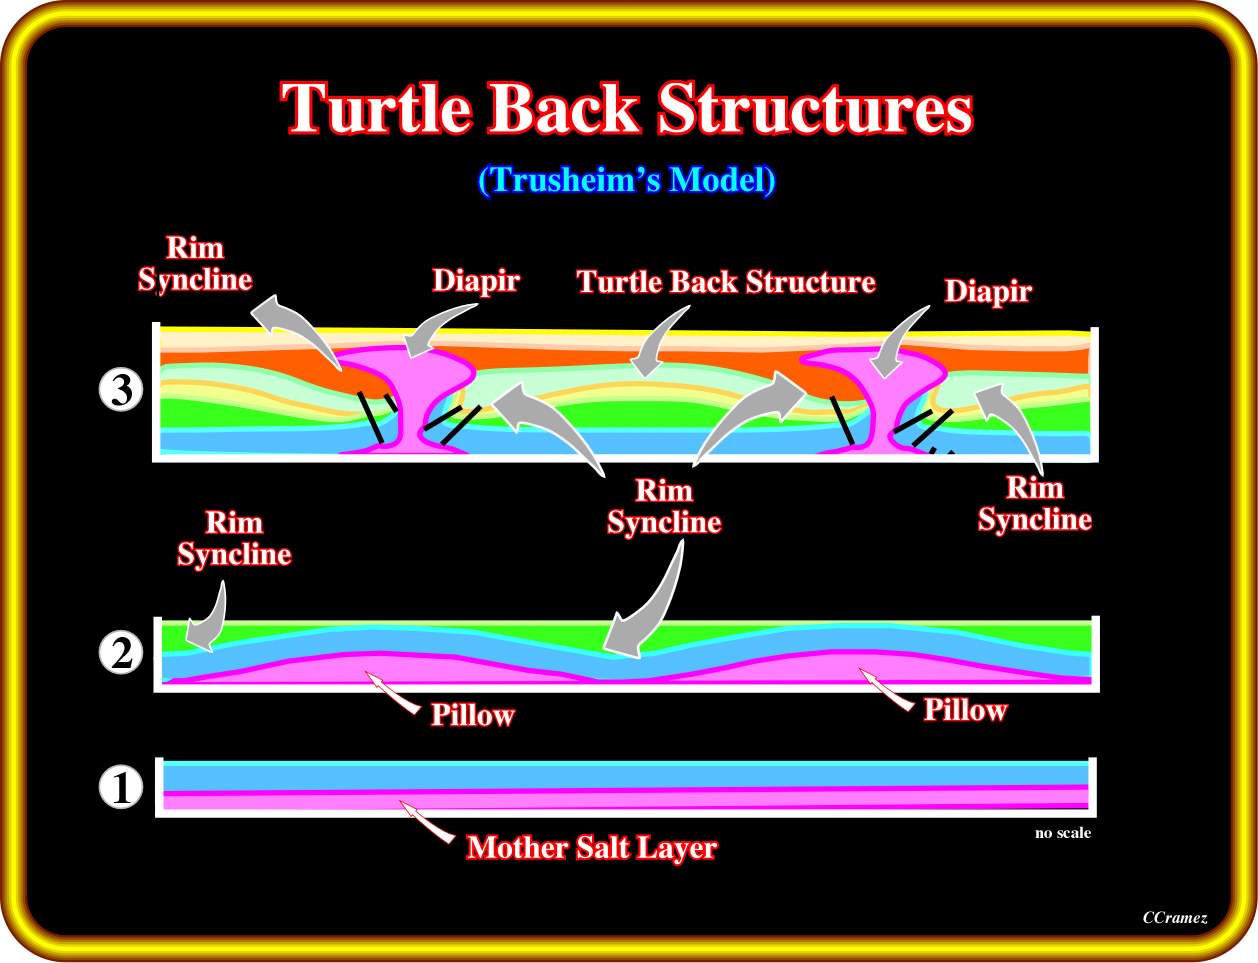
In this sketch, are pictured the three structural stages taken into account in Trusheim’s model to explain the genesis of the turtle-back structures. The second stage, in which a prekinematic overburden (blue interval) is deposited above the mother salt layer, is not required if the salt thickness is large enough to induce the lower part of the salt layer to flow.
In Trusheim’s model, three structural stages can be recognize, as illustrated above.
a) The first stage corresponds to the deposition of the salt mother layer ; such a stage may also include the deposition of a thin overburden interval, in order to increase the geostatic pressure until the salt layer is able to flow ;
b) The second stage includes the deposition of a lower synkinematic layer in the overburden ; during this stage, the compensatory subsidence induces lateral thickness variations within the synkinematic layer ; the interval is thicker where the compensatory subsidence is higher ;
c) The third stage corresponds to the tectonic inversion and deposition of the upper synkinematic layer thickening toward the salt diapirs ; The depocenters deposited during the inversion stage are conventionally called rim synclines.
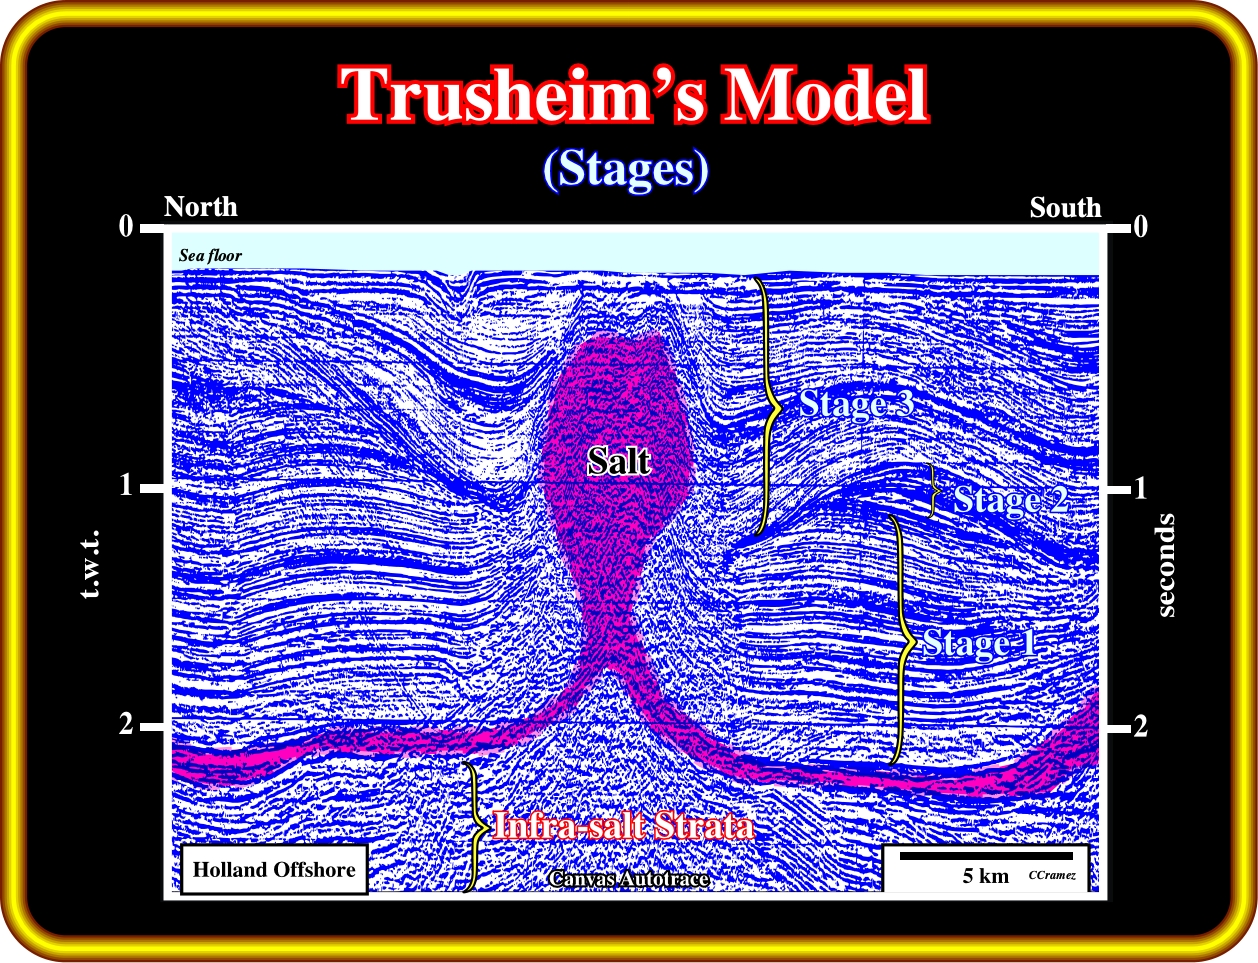
Three tectonic stages can be observed in the development of salt turtle back structures, as illustrated on this tentative interpretation of a seismic line from Holland offshore. In fact, from bottom to top, one can recognize: (i) Infra-salt strata ; (ii) Salt (autochthonous and allochthonous) ; (iii) Prekinematic overburden (stage 1) ; (iv) Synkinematic overburden thickening away from the salt diapir (stage 2) and (v) synkinematic thickening toward the diapirs (stage 3).
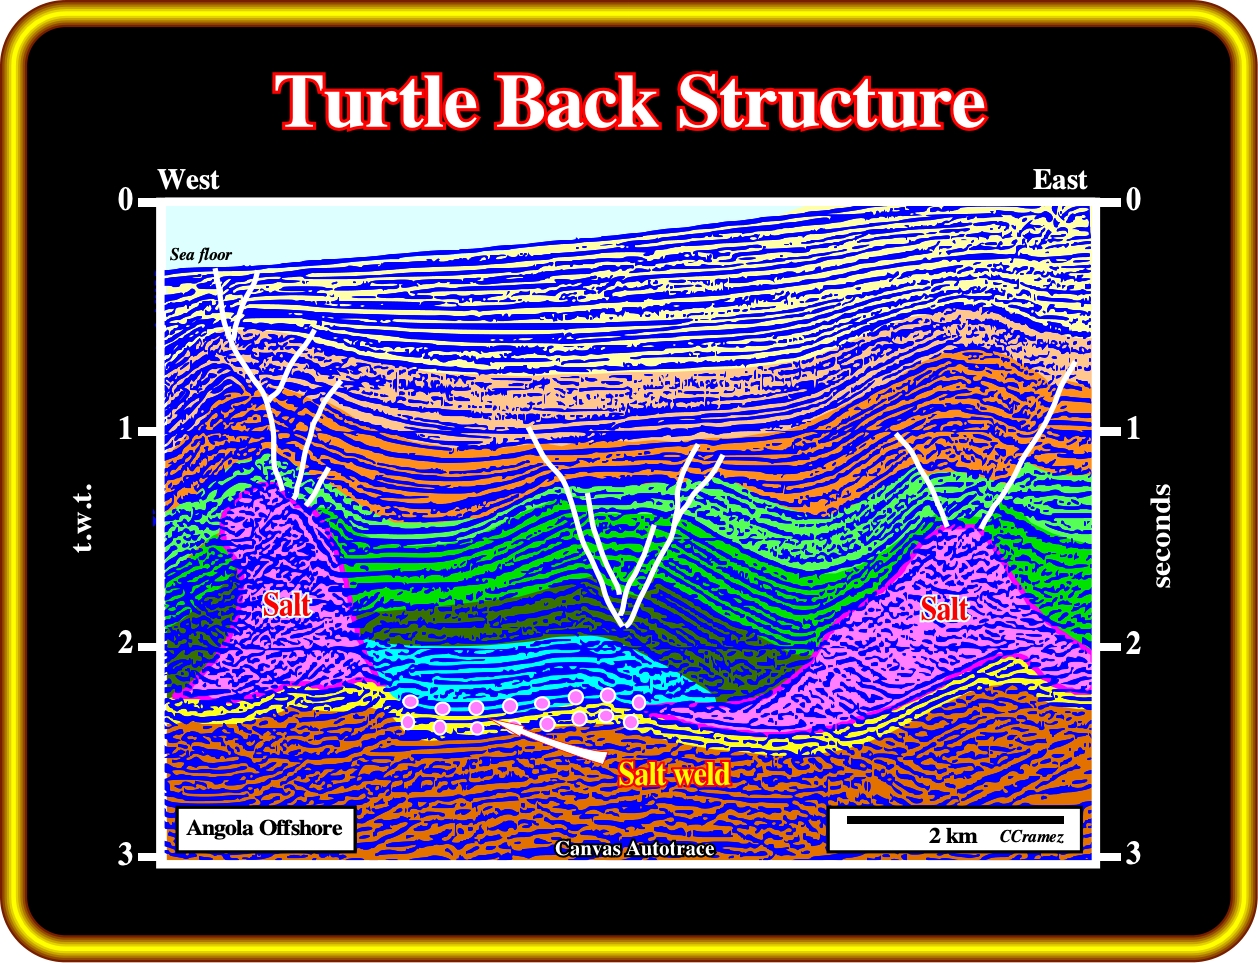
This geological tentative interpretation illustrates a typical turtle-back structure of the Angola offshore. A late compressional tectonic regime shortened and partially inverted the overburden. The second structural stage of Thrusheim’s model corresponds to the green intervals. The asymmetry of the green intervals, the uplift (brown intervals) and the normal faulting in the core of the turtle, are quite evident. Note that the change in the concavity of the faults indicates roughly the limit between structural stages 2 and 3 recognised in the development of a turtle-back structure.
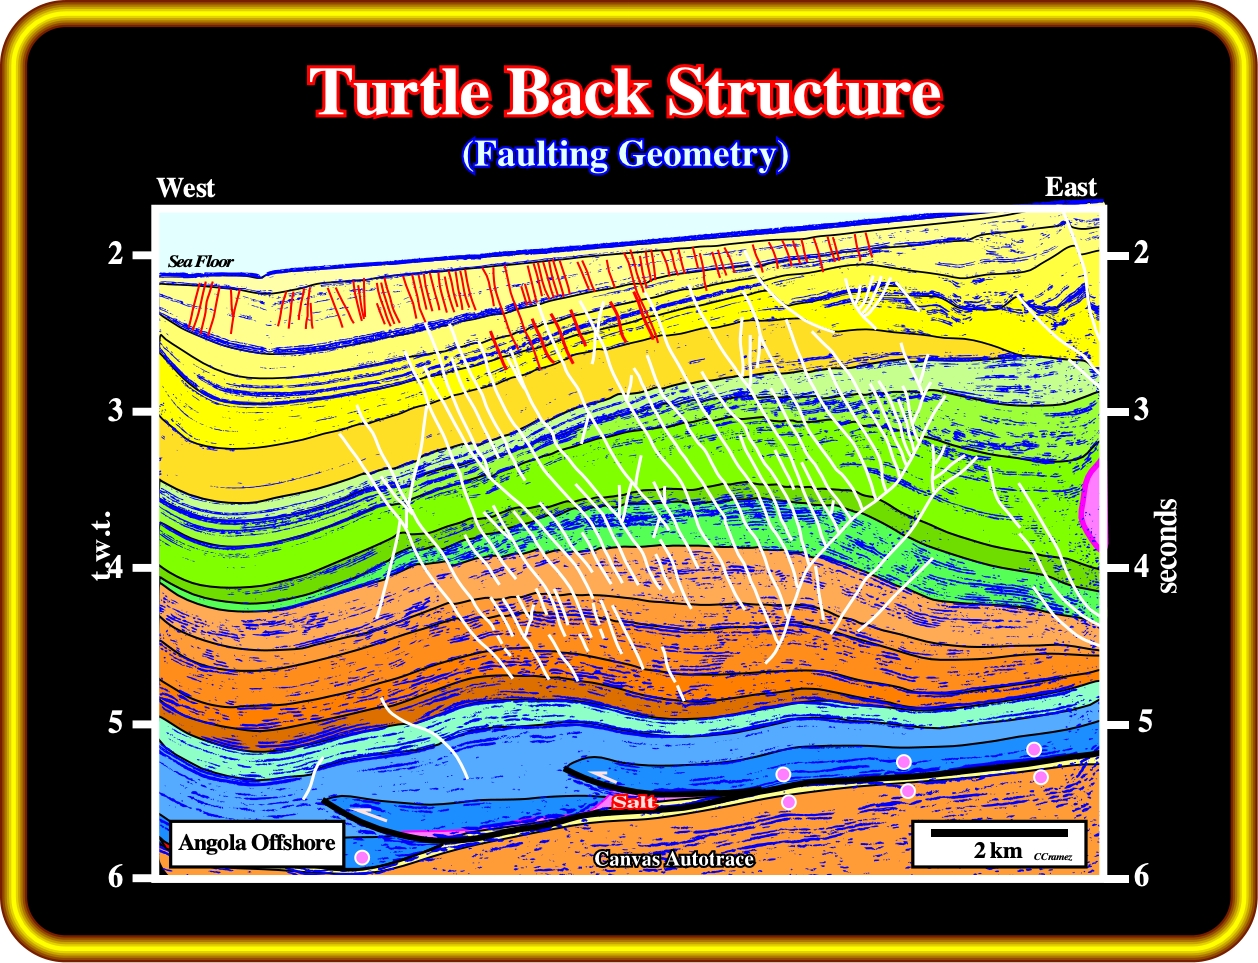
On this geological tentative interpretation, there are, at least, three faulting systems. At the base, in black, the faults are reverse. They are associated with a compressional tectonic regime. At the top, in red, the faults are normal and polygonal. Dewatering induced them. In the middle of the section, in white, the faults are normal. Probably, they strike in different directions, since they are associated with the extension created by salt inversion. The changing of concavity of the fault planes is easily recognized.
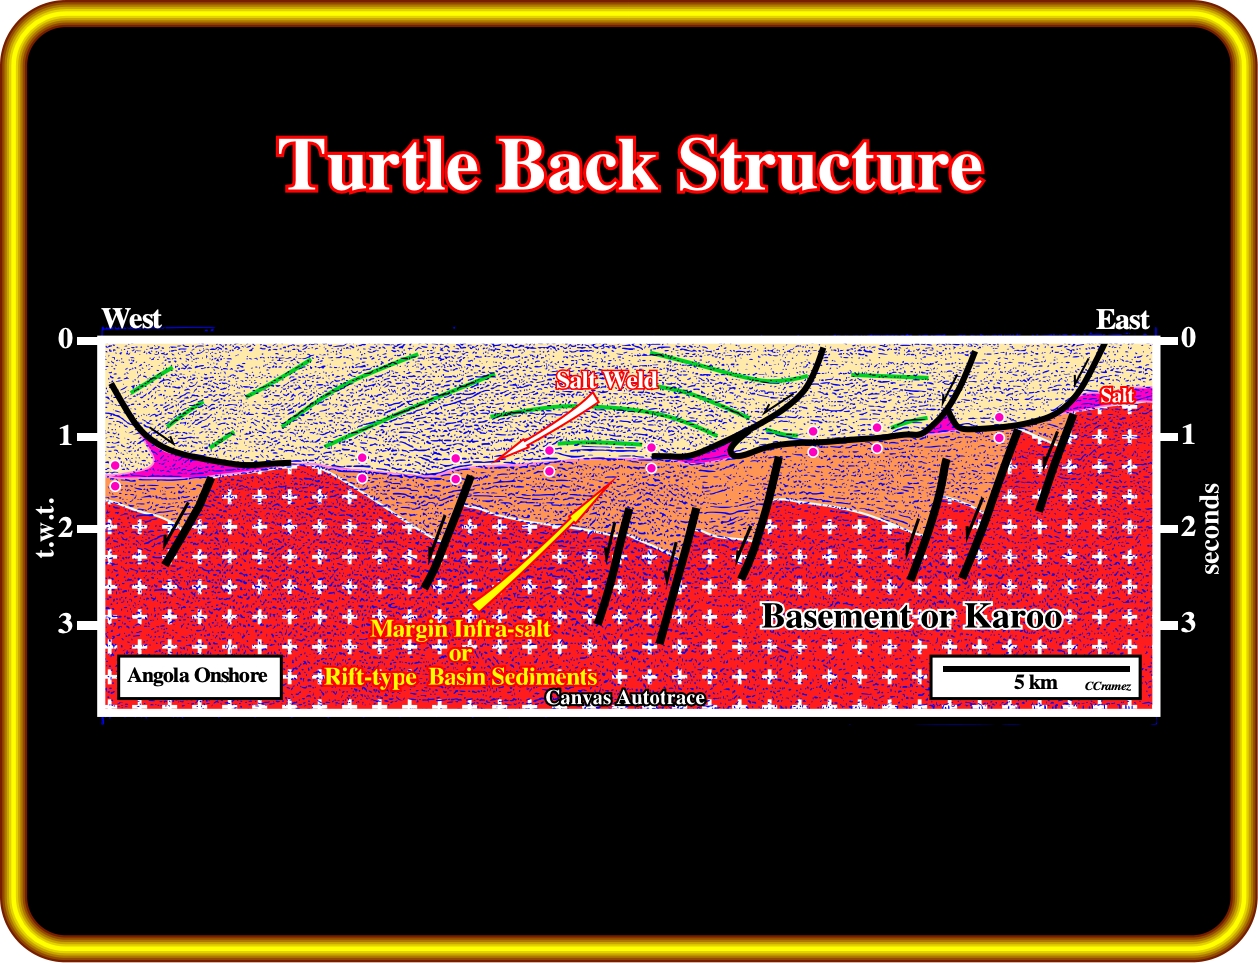
As illustrated in this geological tentative interpretation of an old seismic line of Kwanza onshore, turtle-back structures, induced by salt flowage, were recognized when the first seismic line were shot. The salt and fault welds are easy recognized, as well as, the salt rollers in the footwall of the growth faults. The presence of rift-type basin sediments is obvious. However, the breakup unconformity, which separates the margin infra-salt sediments from the rift-type basin sediments, is not evident, since, generally, it is not tectonically enhanced, i. e., it does not correspond an angular unconformity (unconformity tectonically enhanced).
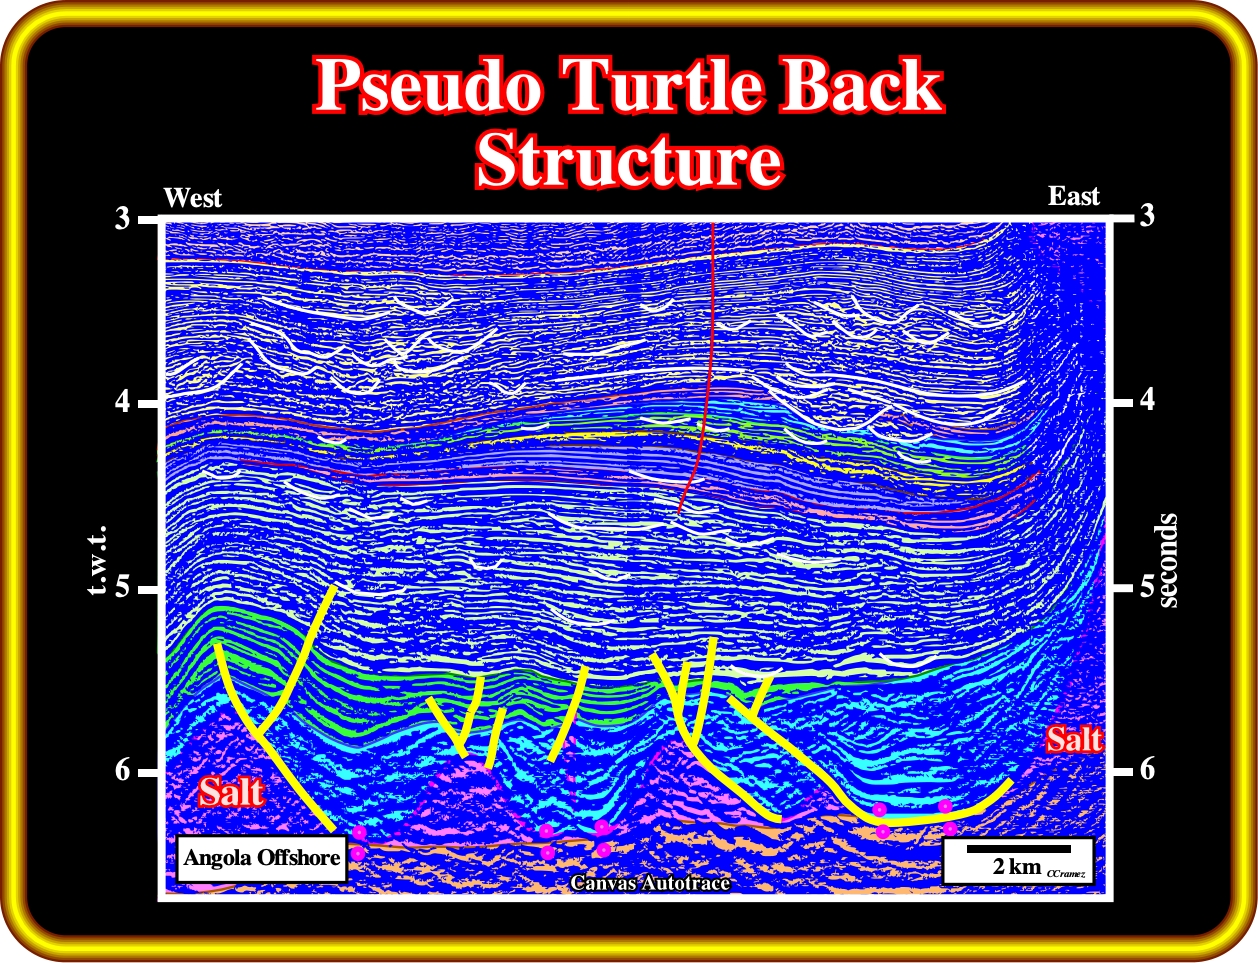
Overbank deposits, as those illustrated on this geological tentative interpretation, should not be taken as turtle-back structures. The consequences of a so erroneous interpretation can be highly negative. The absence of a normal faulting in the apex of the sedimentary mound indicates that any tectonic inversion (lengthening) took place. So, it cannot be interpreted as a turtle-back. Therefore, the presence of potential reservoir intervals as well of a potential trap is highly questionable.
Exercise 1:
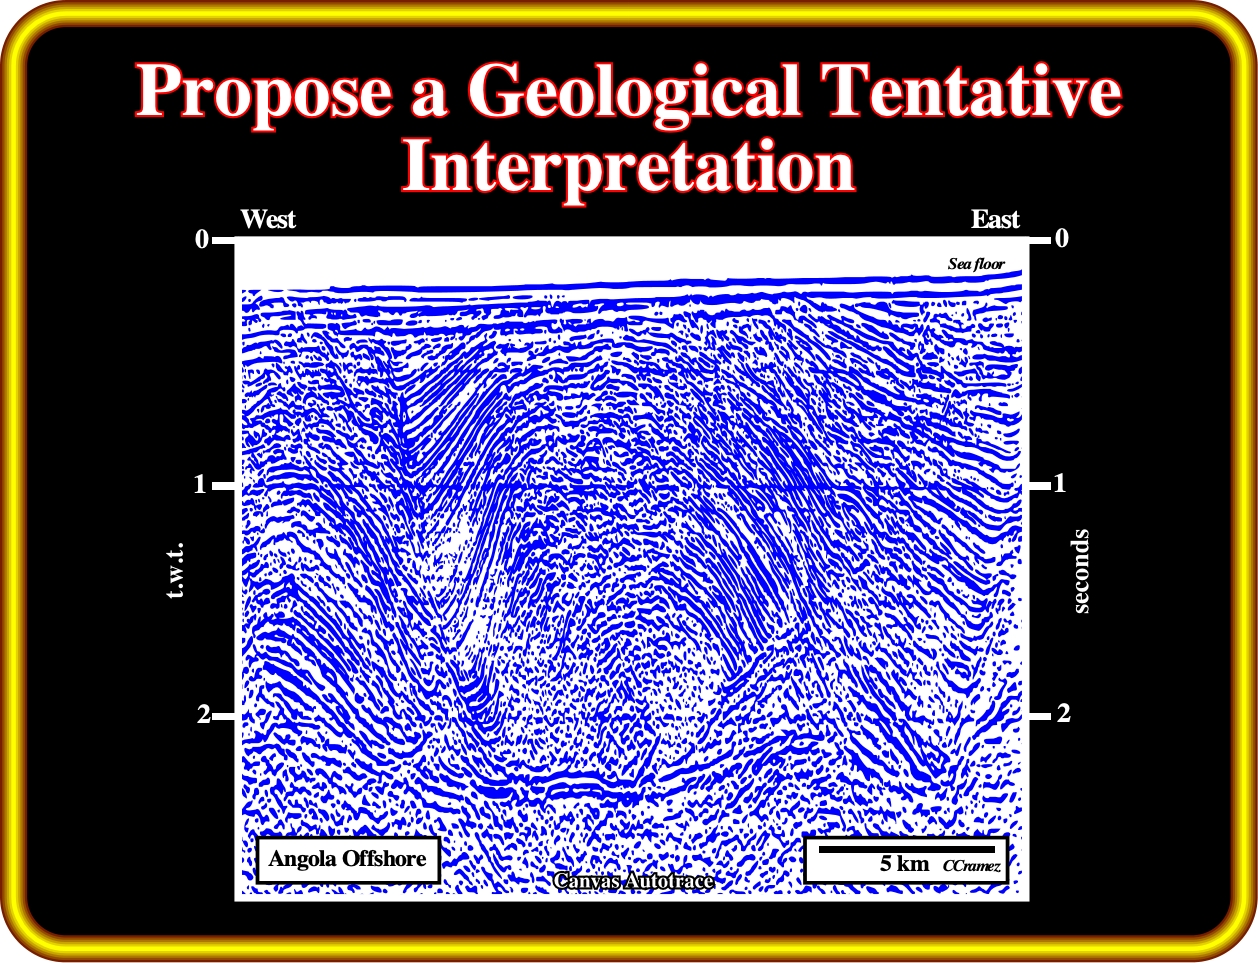
In your tentative geological interpretation individualize the different stages of the formation of antiform structures (do not forget the structure, partially visible on the left part of the line). Differentiate the fault welds from the salt welds. How do you explain the wavy morphology of the tectonic disharmony ? Explain the fault pattern visible in the top of the structures. Finally, locate the potential carbonate and sandprone reservoirs-rocks.
to continue press
next
![]()