

Time stratigraphy is established by physical stratal patterns of the rocks, on the ground, on electrical logs and on seismic lines.
"Physical stratal patterns of the rocks"
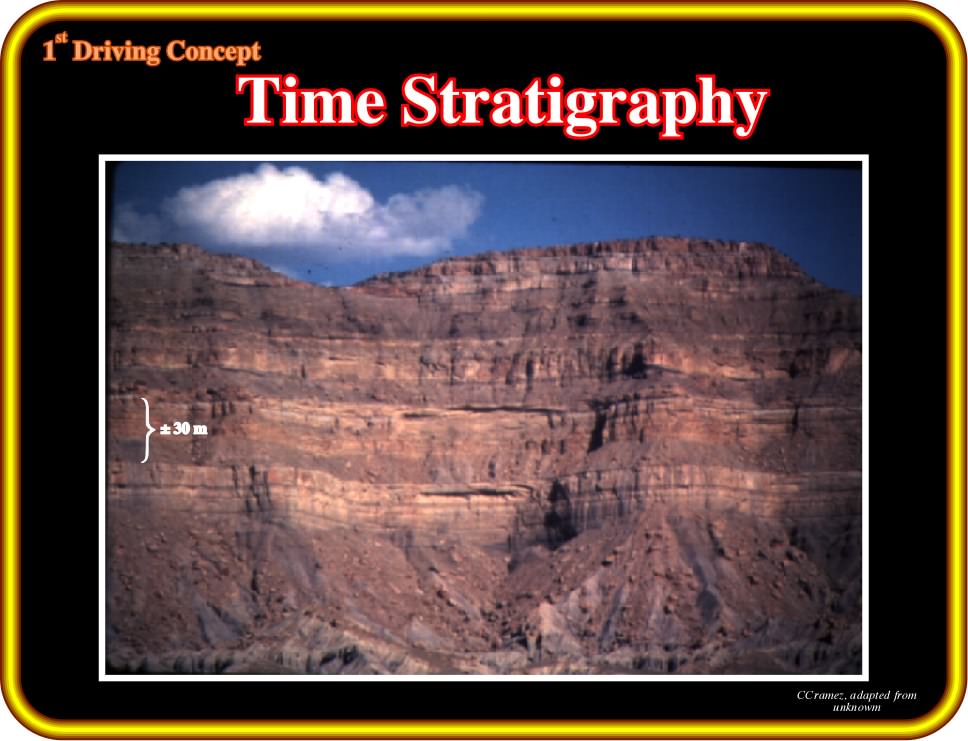
Plate 111 - As illustrated on this photograph, physical strata patterns, strongly, antiredeposition systems are cyclic. Since the advent of Geology, as a natural science, geologists advanced several hypotheses to explain such cyclicity. Eustasy has always been considered as the most likely cause of the cyclicity of depositional systems (de Maillet, Lavoisier, Lemoine, Burrolet and, recently, Exxon’s geologists). Such hypothesis has been tested many times, but, so far, it has resisted quite well to the refutation tests. Eustasy or eustatism, i.e., the global (absolute) sea level changes can apply just to sediments deposited under marine influence. Non-marine sediments, particularly those laid down landward of the bayline are out of the scope of eustasy. High-frequency stratigraphic cycles (10 s to 100 s ka), often, show, at a specific location, an alternation of ‘dynamic’ (proximal-energetic), and ‘non-dynamic’ (distal-pelagic) processes with time (http://www.esd.ethz.ch/people/castells/PDF_ Growth_Strata_Comptes_Rendus_2004). When sedimentation is syn-deformation, these processes tend, respectively, to fill-up tectonically induced topography or to drape it. Growth strata are, alternatively, thickened and isopach across the growth structure. High-resolution kinematic studies of growth structures (folds and faults), which assume that sedimentation always fills up topographies (‘fill-to-the-top’ model), may therefore mistake sedimentary cyclicity for tectonic cyclicity.
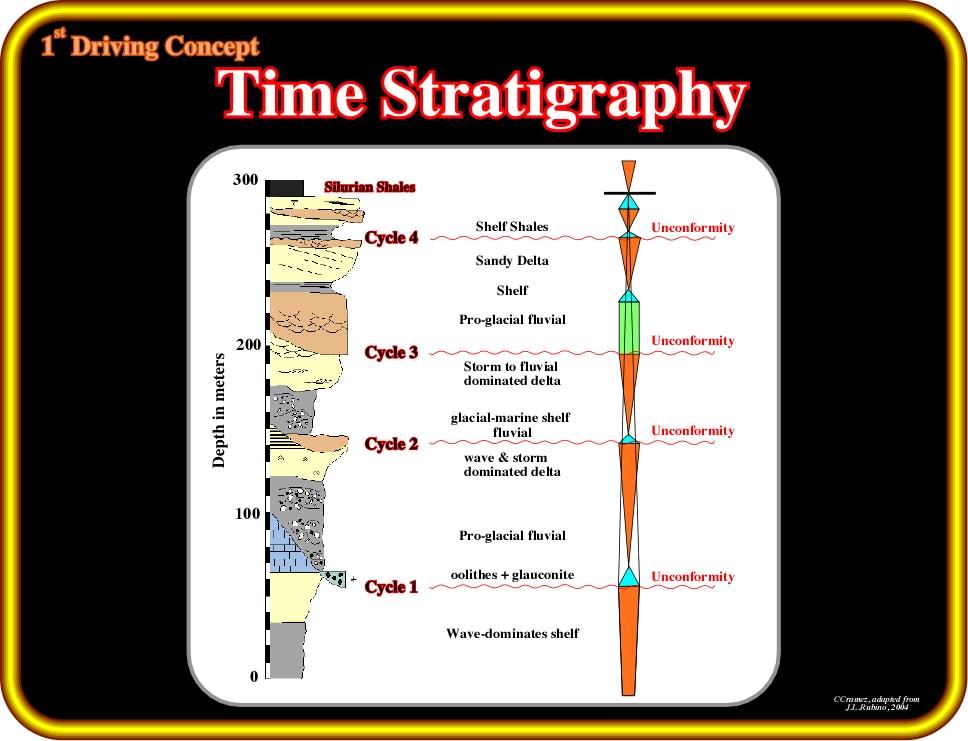
Plate 112- The cyclicity of the depositional systems recognized on the ground (Plate 111) is, naturally, depicted on stratigraphic cross-sections. The section illustrated on this plate comes from an Upper Ordovician glacial interval,i.e, , from an environment in which eustasy is meaningful. Four stratigraphic cycles are pictured. They are bounded by erosional surfaces, which truncate, locally, the underlying strata putting in vertical abnormal superposition and lateral juxtaposition sediments with facies (lithology) and environments quite different. Within each cycle, it is possible to identify a lower thinning and fining upward package, which is overlain by a coarsening and thickening upward package. Eustasy, in this particular example (glacial deposit), for many geoscientists, cannot be directly invoked as the main cause of the cyclicity. The landward and seaward movement of the glacier is, probably, the more likely cause of the observed cyclicity, with glacial erosion bounding the cycles. As we will see later, eustasy explains quite well the cyclicity observed in marine sediments. However, in turbidite depositional systems, deposition can, also, take place when the space available for sedimentation (accommodation) increases (relative sea level rise).
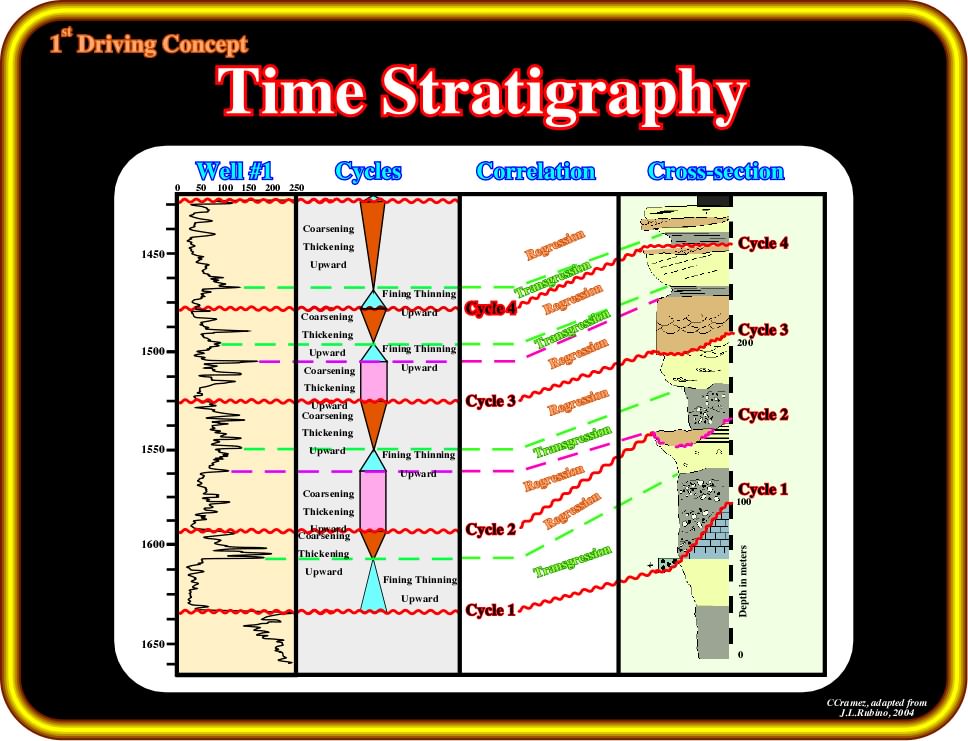
Plate 113 - The cyclicity and stratal patterns of marine sediments are, readily, recognized on all electric logs. In glacial deposition, as illustrated here, the correlation between field stratigraphy and electric logs patterns are difficult to refute. Four cycles, glacial erosions, fining and thinning upward (transgressive) and coarsening and thickening upward (regressive) intervals, identified on the stratigraphic section (Plate 112), are, easily, recognized on the electric logs. Despite such convincing regional correlations, it is not astonishing that some geologists still hypothesize that eustasy is also active in glacial deposits.
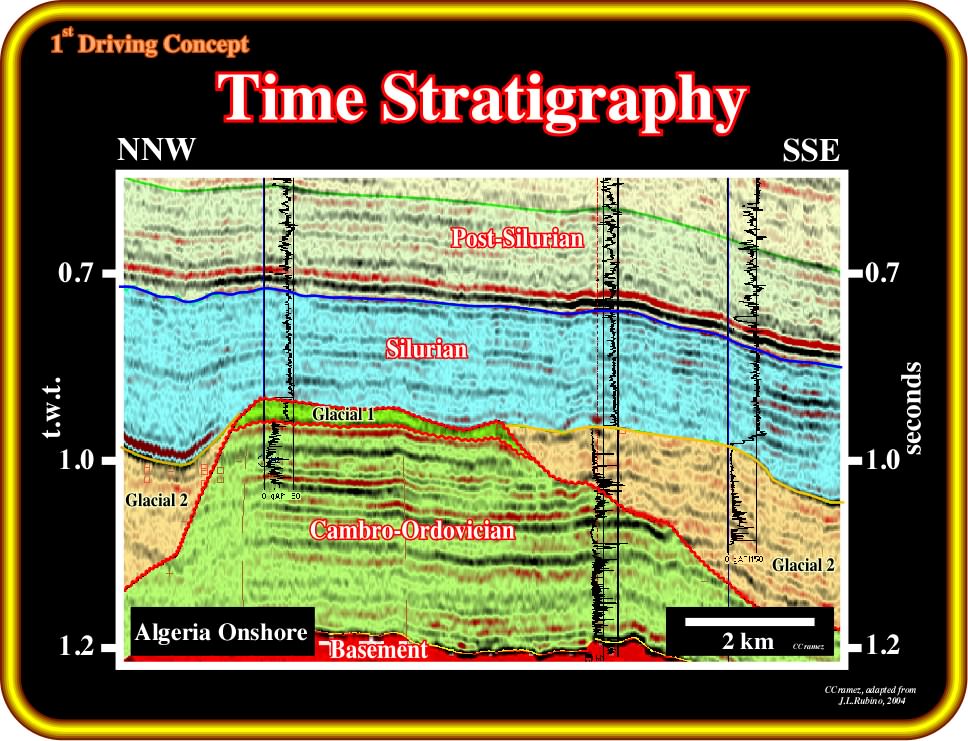
Plate 114 - This tentative interpretation of a seismic line (Algeria onshore) illustrates the time stratigraphy (seismic reflectors are chronostratigraphic lines) and the cyclicity (eustasy) of the depositional systems. Time stratigraphy and cyclicity can also be recognized on the electric logs of the wells drilled in the area. The glacial deposits (Upper Ordovician, glacial 1 & 2) depict quite different stratal patterns of the marine deposits (Cambro-Ordovician, Silurian and post-Silurian). Glacial erosional surfaces bounding glacial cycles look like angular unconformities (tectonically enhanced unconformities), while the limits between the marine geological packages look like eustatic unconformities associated with significant relative sea level falls. The internal configuration of glacial intervals is, almost, reflection free, while marine intervals have, roughly, a parallel internal configuration. Earth’s climatic history since 2.5 Ma has been controlled by Milankovitch variations in the planetary orbit, comprising alternate periods of glaciation and inter-glaciation with a dominant frequency of 41 000 yr ; concomitantly, eustatic sea level has fluctuated 70 to 130 m, causing rapid transgressions and regressions of the shoreline across the world’s continental shelves (http://members.iinet.net.au/~glrmc/Saul-gsa.pdf).
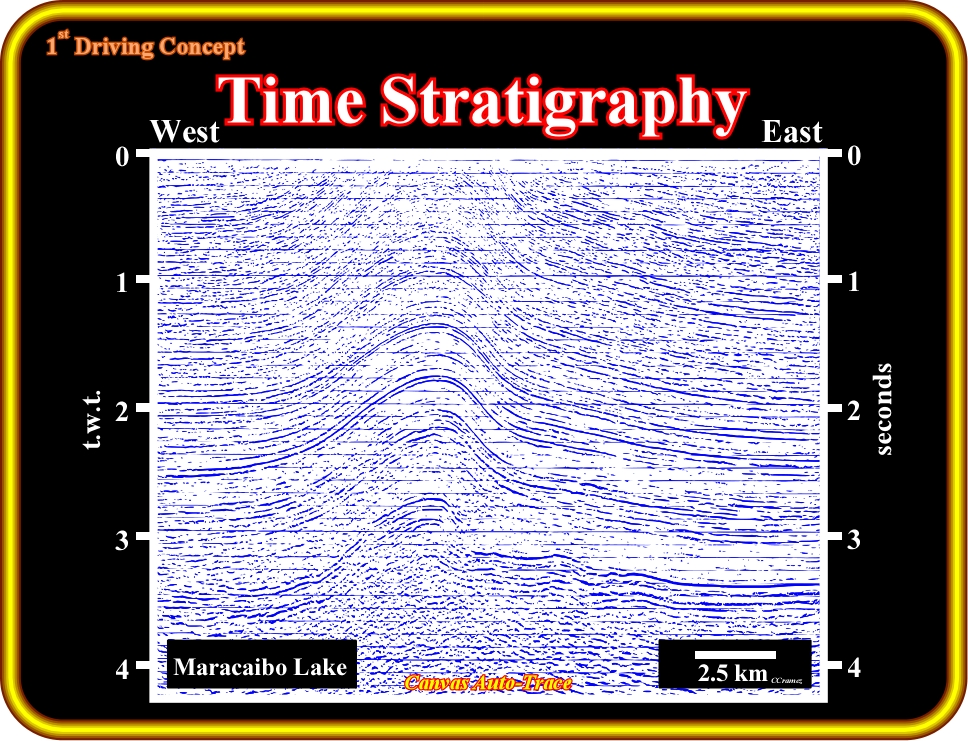
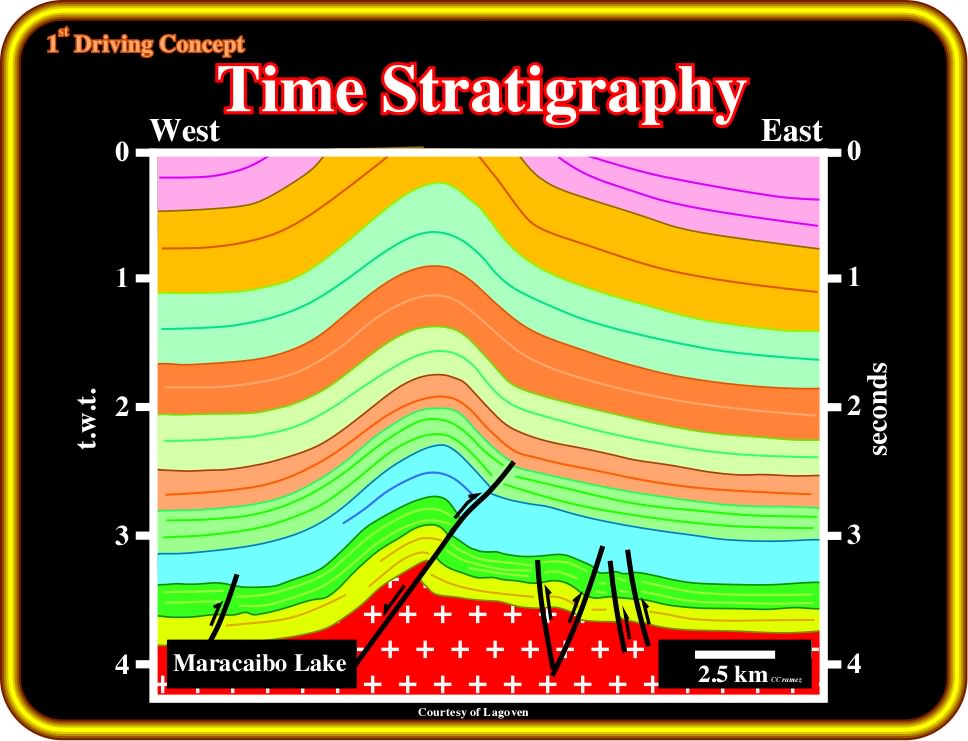
Plate 115- On this tentative interpretation of an autotrace of a seismic line from Maracaibo lake (Venezuela), the seismic reflectors, which correspond to chronostratigraphic lines (interfaces between depositional intervals), depict the time stratigraphy (here not calibrated by exploration wells) and the cyclicity of the depositional systems. The colored seismic intervals correspond, roughly, to marine sedimentary packages (continental encroachment sub-cycles induced by 2nd order eustatic cycles). The internal configuration of the seismic intervals looks parallel, at least on this profile. This seismic line is perpendicular to the structural trend and not parallel to the direction of sediment transportation along which geometrical relationships and reflections terminations are true and not apparent.
Seismic lines are a high resolution tool that can be used for determining chronostratigraphy :
"Time lines in rocks"
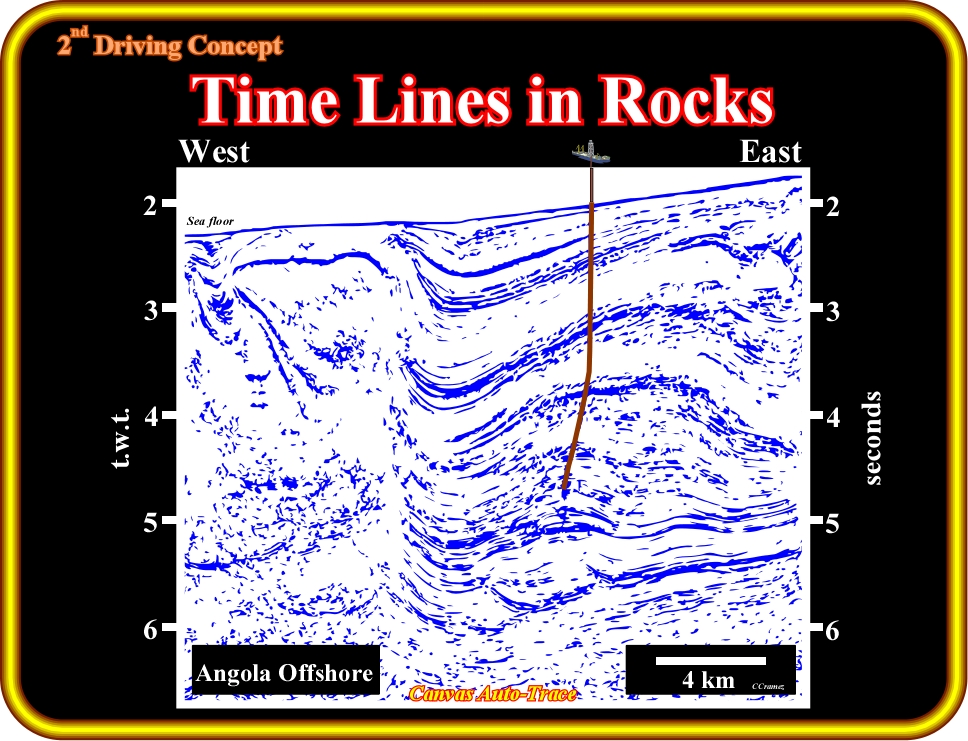
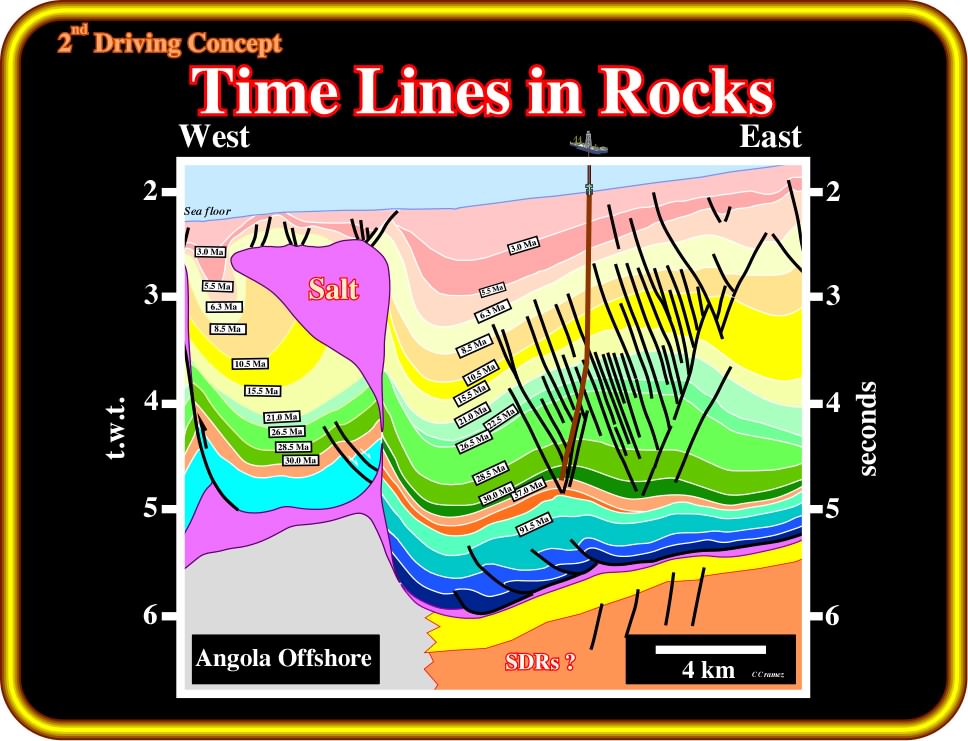
Plate 116 - The results of exploratory wells or the knowledge of the stratigraphic signature in certain area, allow explorationists and particularly seismic interpreters to calibrate seismic profiles of the area in time stratigraphy. On this tentative interpretation of an auto-trace of seismic line of the deep Angola offshore, the major unconformities (sequence boundaries, i.e., S.B.) bounding the different seismic intervals were calibrated (before drilling) using the stratigraphic signature of the South Atlantic Margins. On lower western part of the tentative interpretation, the pull-up of the bottom of the allochthonous evaporitic layer induced, mainly, by the presence of a local but thick allochthonous salt layer is quite obvious. Seismic waves travel in the salt layers at high velocity (± 17500 feet/second).
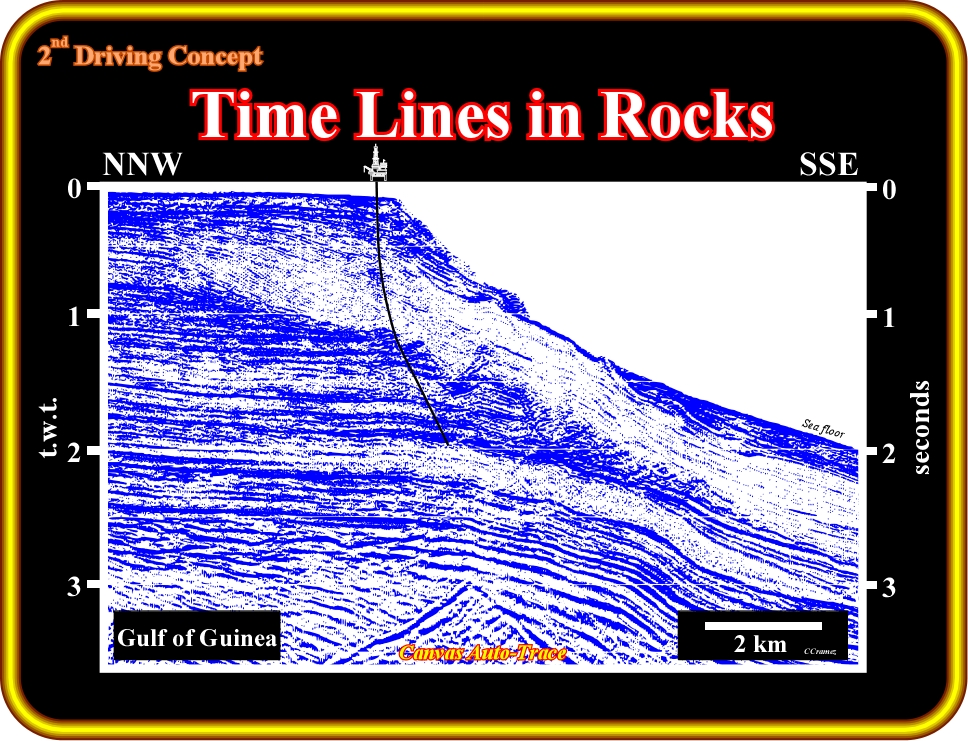
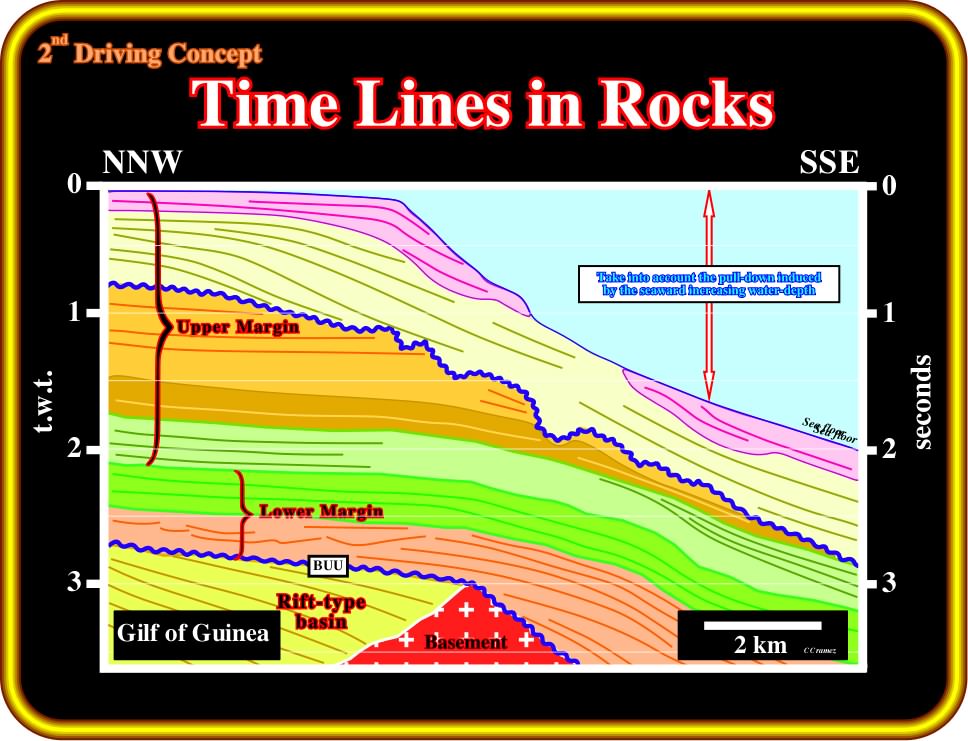
Plate 117 - On seismic lines, it is easy to notice that seismic reflectors follow chronostratigraphic lines. Therefore, time-stratigraphy can be performed using seismic data. On this geological tentative interpretation of an auto-trace of a seismic profile, coming from Nigeria offshore, different seismic packages can be recognized above a granite-gneiss basement. Rift-type basin sediments deposited during the lengthening of the lithosphere, i.e., laid down before the break-up of Pangea supercontinent, are separated from the margin sediments by an angular unconformity (BUU, Breakup unconformity). On the margin, different sedimentary packages can be recognized. In the upper part, an obvious erosional surface (SB. 30 Ma), probably, induced by the relative sea level fall created by the Upper Tertiary (Oligocene) glaciation, eroded the sedimentary time surfaces creating, typically, truncated reflection terminations (see later). The lower margin sediments look transgressive, while, globally, the sediments of the upper margin look regressive. A major non-depositional hiatus is, likely, between lower and upper parts of the margin.
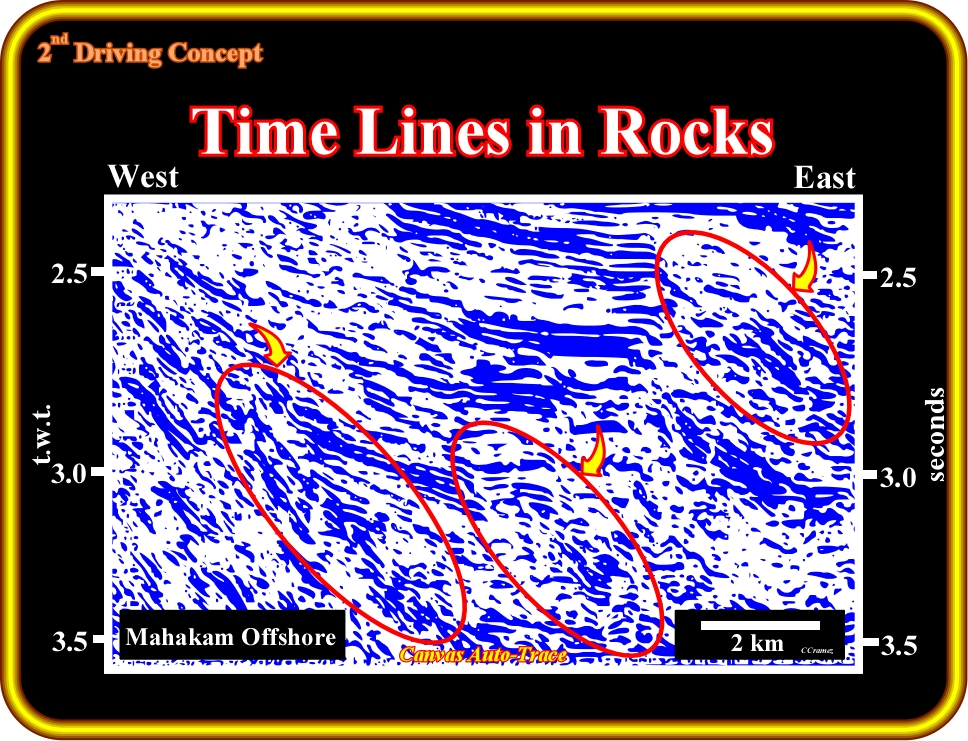
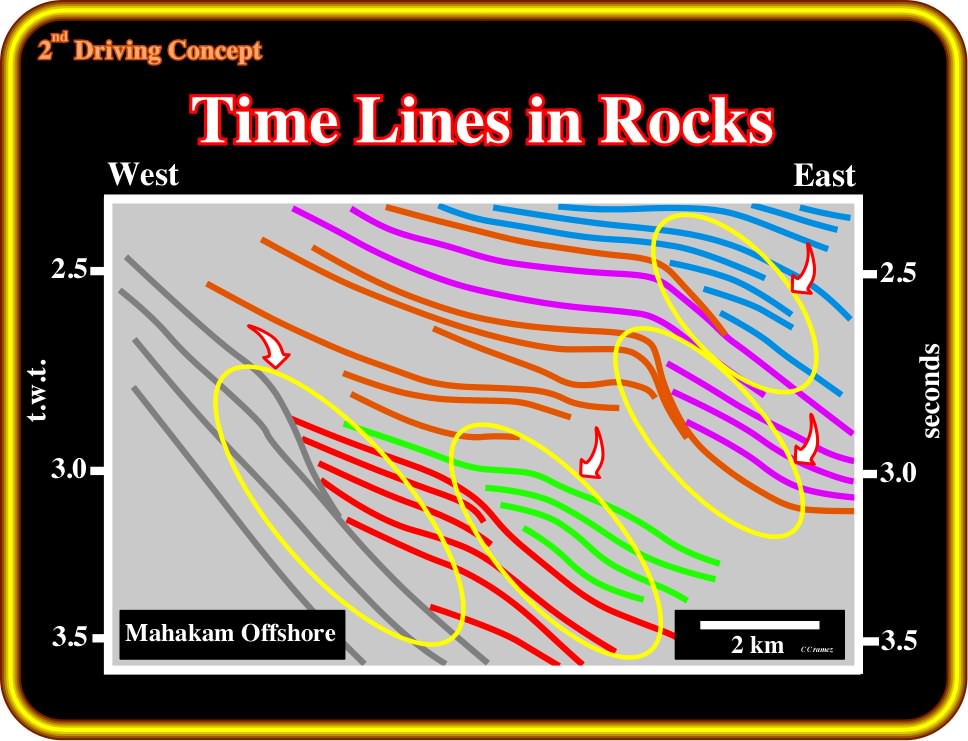
Plate 118 - When seismic data are of good quality and with appropriate resolution, as in modern seismic lines of Mahakam offshore (East Borneo, Kalimantan, Indonesia), (i) the stratal patterns, (ii) the geometrical relationships (between seismic markers) and (iii) the seismic surfaces (hypothetical surfaces associated with reflection terminations) allow seismic interpreters to perform quite detailed time stratigraphy and depositional analysis. On this tentative interpretation of an auto-trace of a Mahakam (Indonesia) offshore seismic line, for instance, it is, utterly, easy to see the theoretical disconformity surfaces separating the different seismic packages. Certain depositional packages (seismic intervals) were laid down not in aggradation, i.e., above the previous ones, but much lower on the seaward side. Such geometrical relationships, that we are going to describe and interpret later, correspond to significant relative sea level falls, which displace the depositional coastal systems basinward and downward.
Seismic depositional intervals follow the hierarchy of eustatic cycles. Higher hierarchic stratigraphic intervals (associated with eustatic cycles with shorter time duration) as (i) sequence-cycles, (ii) systems tracts and (iii) depositional systems (facies, i.e., lithology), can be individualized in outcrop and, sometimes, on seismic data whenever conditions are favorable.
"Eustatic cycles show a typical hierarchy"
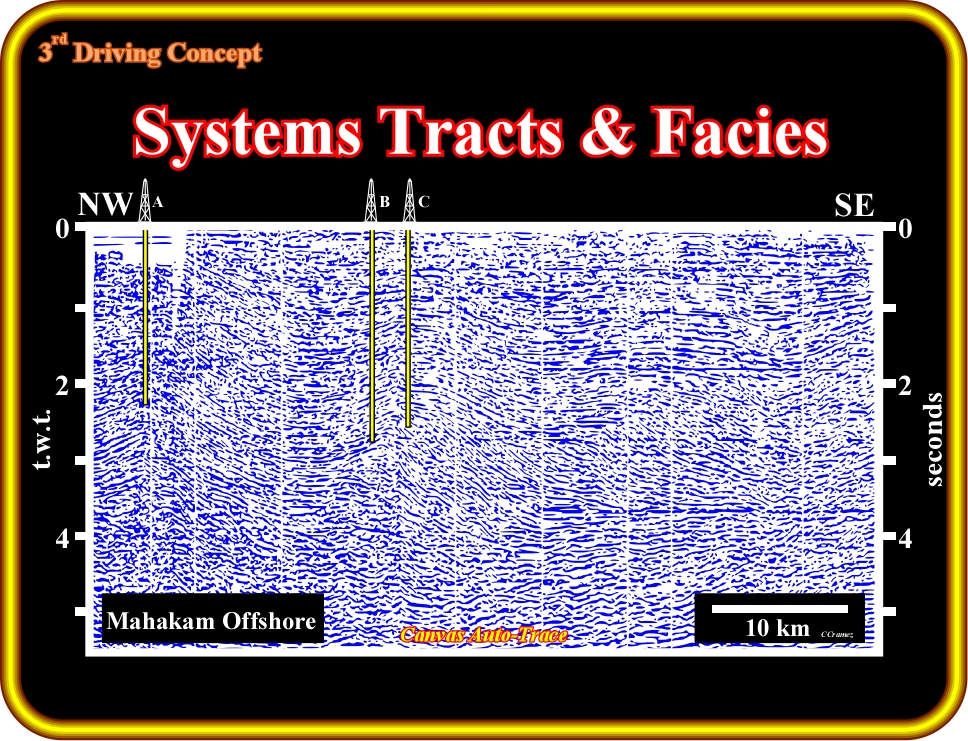
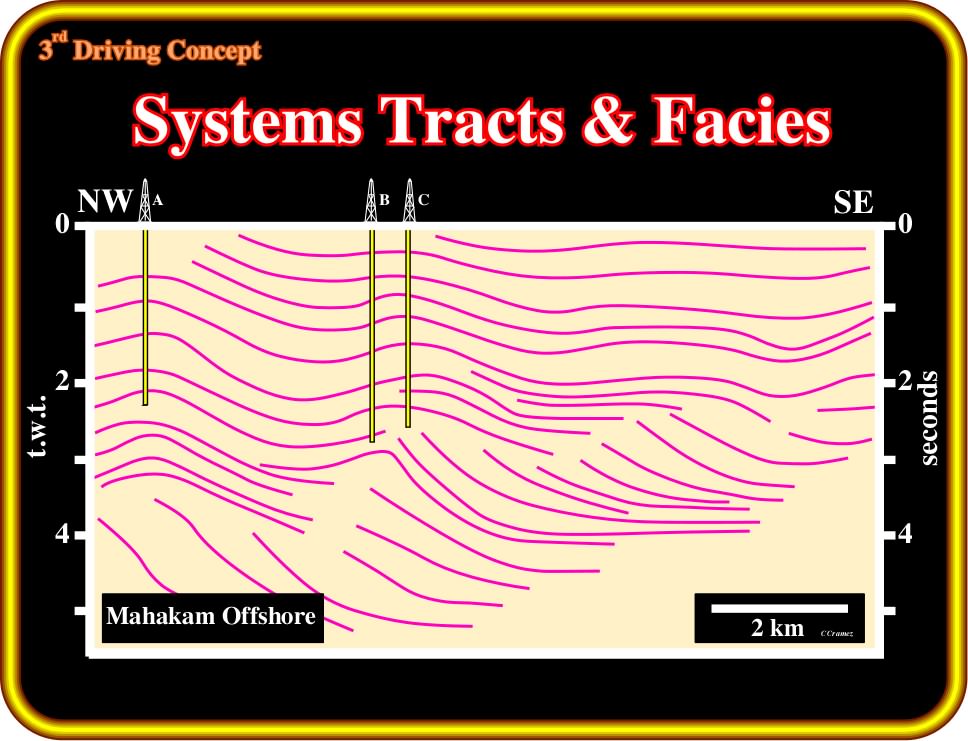
Plate 119 - Theoretically, seismic markers should underline significant acoustical impedance contrasts. In the 60's seismic interpreters, particularly Esso’s geologists expected to recognize, on the seismic lines of Portuguese Guinea, the progradational delta-front reservoirs, since their acoustical impedance is much higher than the landward coastal silts and seaward prodelta shales. However, on the seismic lines they do not see any seismic horizon underlying such a progradational displacement. After drilling they calibrated the seismic interpretation and the well’s results, strongly, indicated the recognized seismic reflectors, follow time lines (chronostratigraphic surfaces) and not facies lines (lithological changes). As it will be shown later, lithological predictions using seismic data require a complete and exhaustive sequential stratigraphic interpretation. Seismic interpreter must pick and map higher hierarchic intervals (systems tract) in order to approach depositional systems, which are characterized by a lithology (facies) and an associated faunal assemblage. On this first step (provisional) tentative interpretation (auto-trace of a Mahakam offshore seismic line), in which the seismic horizons were just tracing, it is easier to notice that there is any continuous reflection associated to the progradation of the shelf break (in this particular case and at such scale on can say that the shelf break is coincident with the deposition shoreline break, i.e., basin without shelf).
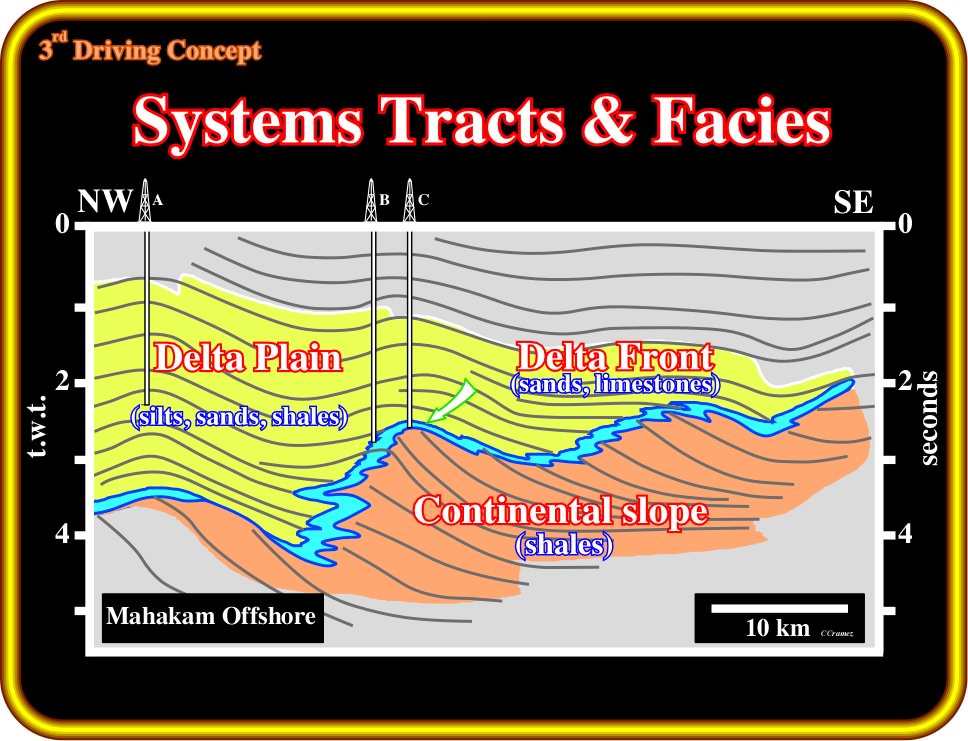
Plate 120 - This plate shows an environmental tentative interpretation of the same auto-trace e used on Plate 119. It is based on stratal patterns (seismic patterns) and calibrated by the well results. It corroborates the conjecture that seismic markers follow chronostratigraphic lines rather than facies lines. On this tentative, it is quite easy to follow the successive positions of the depositional coastal break that, in this particular instance (basin without shelf), coincide with the shelf break. Near depositional coastal breaks, delta front sandstones and limestones were, likely, deposited, while landward, on the coastal plain, silts, sands and shales are predominant. Seaward of the depositional coastal break, on the continental and deltaic slope, slope shales are paramount. Taking into account the facies (lithology), the acoustical impedance contrast should, theoretically, follow the blue interval, but as everyone can notice (Plate 119) there is not any associated seismic marker. Lithological predictions and, mainly, reservoir-rocks predictions cannot be made by just looking at the seismic line. They require, as we see later, a sophisticated method that certain explorations call the sequential-stratigraphic approach.
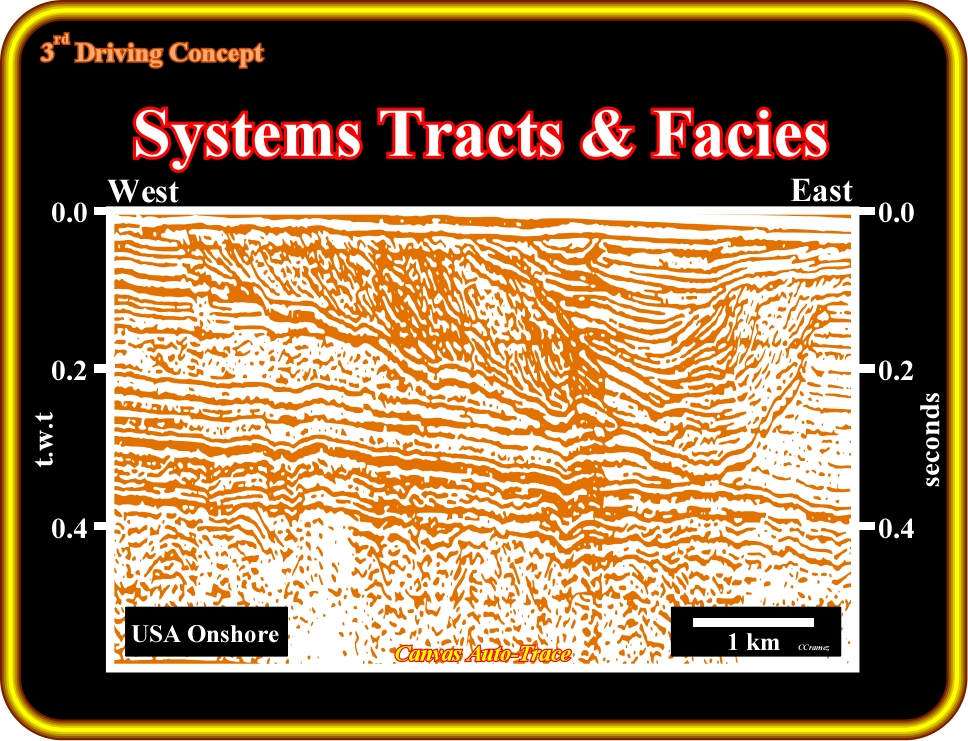
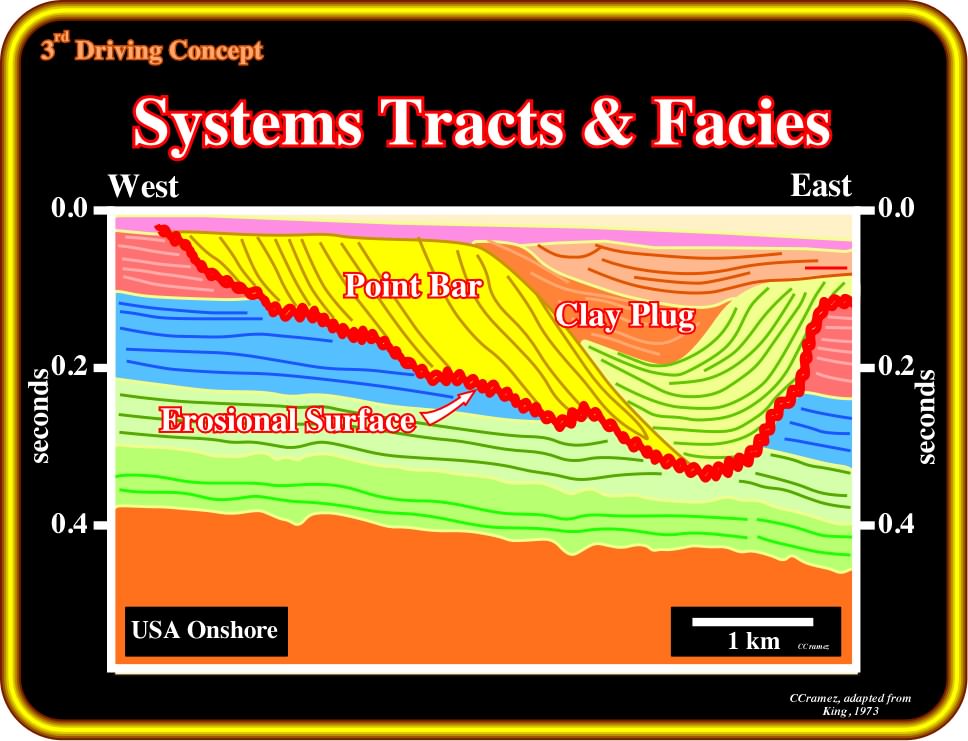
Plate 121- When non-marine depositional systems are suspected or recognized on seismic lines, as illustrated in this tentative interpretation, lithological predictions, using seismic data, still are possible. This is particularly true when the non-marine depositional systems are under the influence of relative sea level variations, i.e., where eustasy is active. These types of non-marine sediments are deposited landward of the depositional coastal break, but seaward of the bayline (limit between alluvial-fluvial and coastal sediments, which are under the influence of sea level changes). In order to make reasonable predictions, a full understanding of the depositional systems is required. On this tentative interpretation of an autotrace, assuming that the erosional surface was induced by the rupture of the provisional equilibrium profile of a river, the stratal patterns of the filling intervals are, easily, interpreted, in lithological terms, by applying meander belt and point bar geological models. Seismic interpreters attempting advanced lithological prediction must, imperatively, know, a priori, the sedimentological models: Theory precedes Observation.
to continue press

