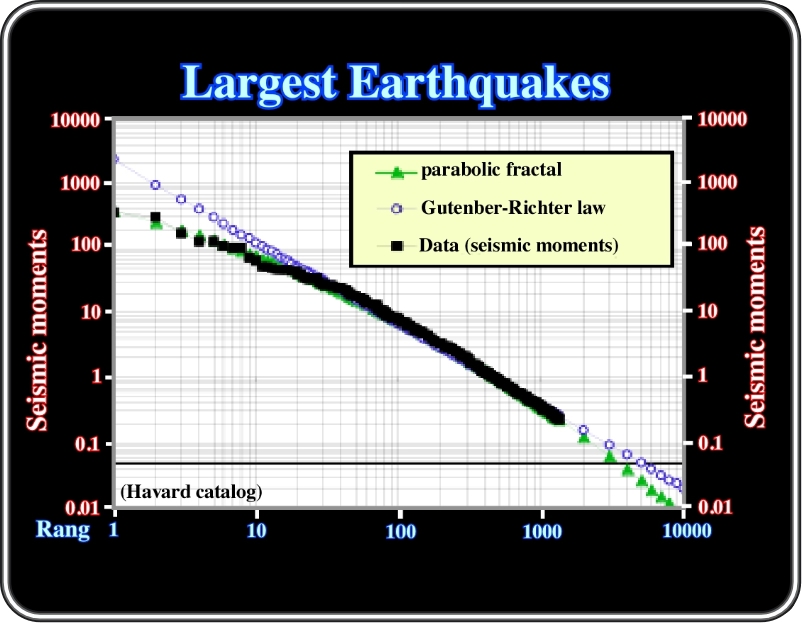
Natural objects, or natural events, when listed in decreasing size and plotted on a log-log format with size against rank show a parabolic fractal distribution.
Galactic intensity, Town sizes, Reserves, Field sizes, HC accumulations within a given PS, etc., have a fractal parabolic distribution.
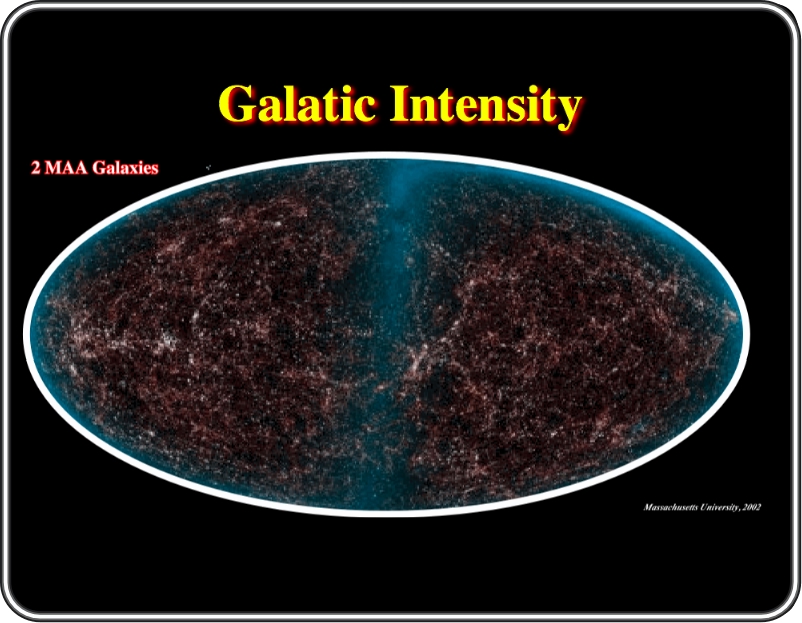
In this infrared view of the entire sky, blue represents close and bright stars in the Milky Way. It also reveals the distribution of the galaxies beyond the Milky Way, presenting galaxy clusters and super-clusters as filaments throughout the image. The galactic intensity (flux radio, luminosity) when listed in decreasing size and plotted on a log-log format, with size against rank, shows a parabolic fractal distribution, as illustrated next.
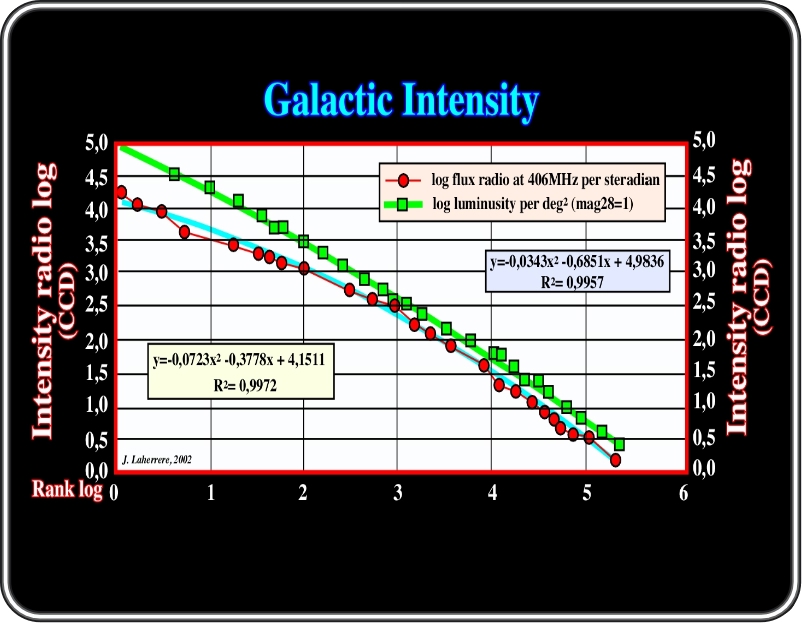
Indeed, as illustrated above, he galactic intensity (flux radio, luminosity) when listed in decreasing size (decreasing luminosity) and plotted on a log-log format, with size against rank, shows a fractal distribution. However, as illustrated next, several fractal parabolic curves can be considered.
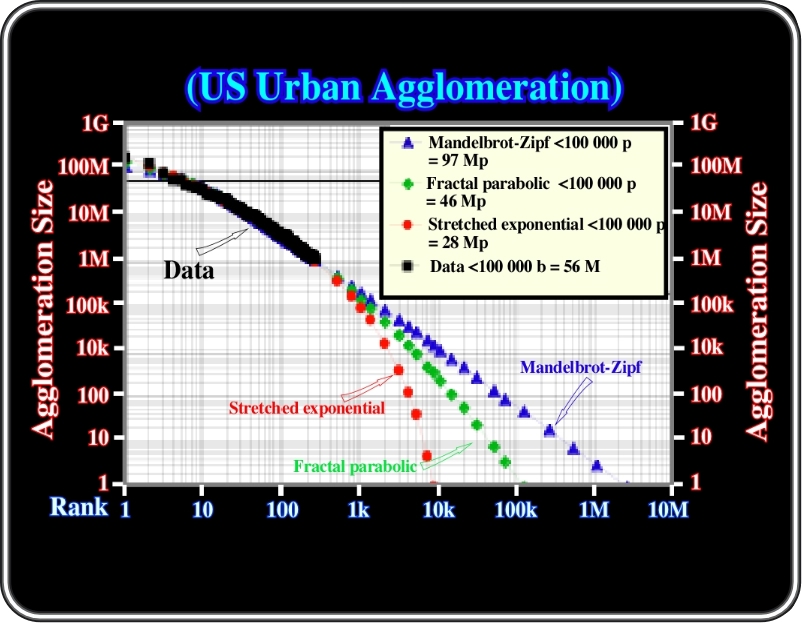
USA urban agglomeration were listed in decreasing size and plotted in a log-log display against rank. The data shows a fractal distribution. Several extrapolation are possible: (i) Mandelbrot-Zipf, (ii) Fractal parabolic and (iii) Stretched exponential. Perfect self-similarity is a power law or linear fractal in log-log display (size/rank). Imperfect similarity is a curved display. The simplest seems to be the parabolic fractal.
It is evident that in this particular example the best fit is parabolic fractal, at least for small and medium ranks. Similarly, in basinal turbidite depositional systems, the plot of thickness of the lobes against rank, on a log-log format, shows a parabolic fractal distribution.
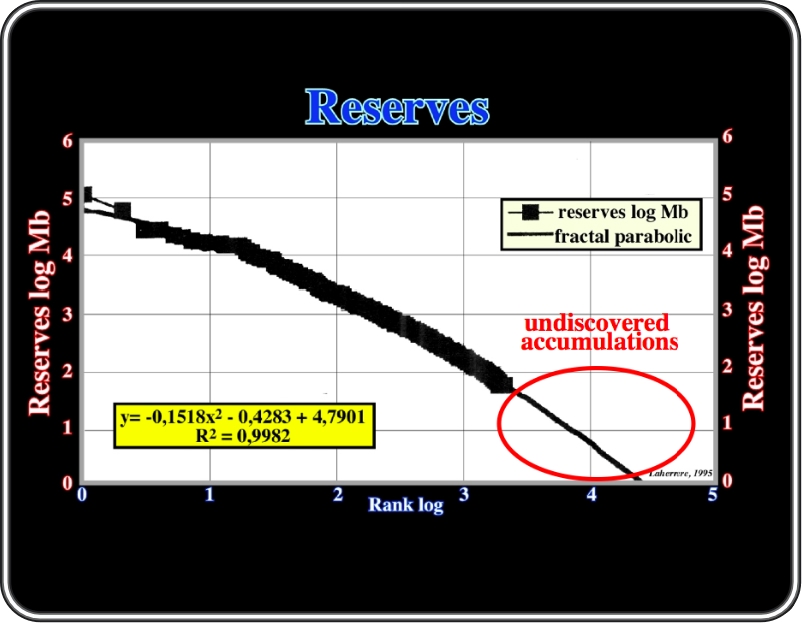
Plotting in a log-log display, reserves versus rank shows also a fractal distribution. The fractal parabolic curve allows geoscientists to predict, roughly, undiscovered accumulations. Such a distribution, which also observed in single petroleum basins allows to determine the degree of maturation of exploration.
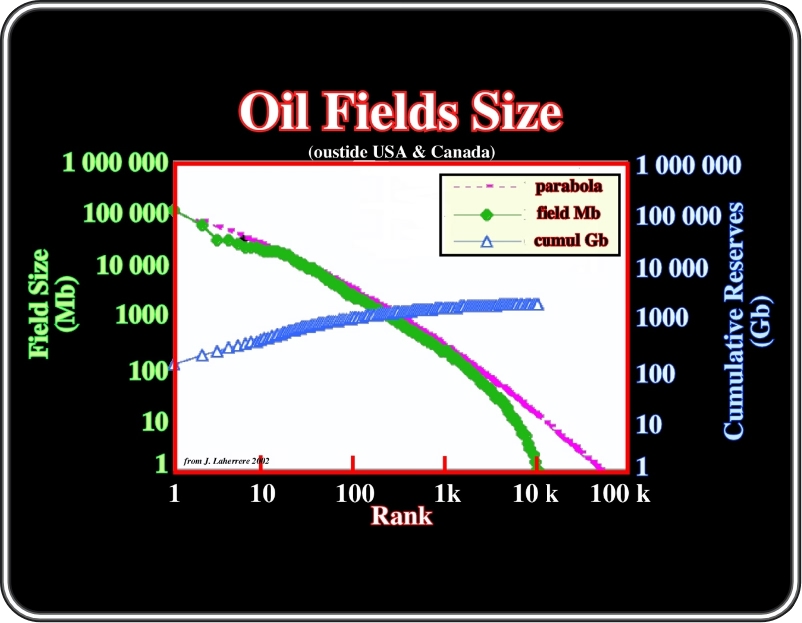
The size plotted versus rank shows a fractal distribution (in green) that fits, not very badly, with the fractal parabolic curve distribution (in pink). The cumulative reserves curve (in blue) strongly suggest ultimate reserves around 2-3 Gb. Remind, that, as said previously, more than 1 Gb have already been produced, so probably, we have already spent half, or very near, of the world reserves.
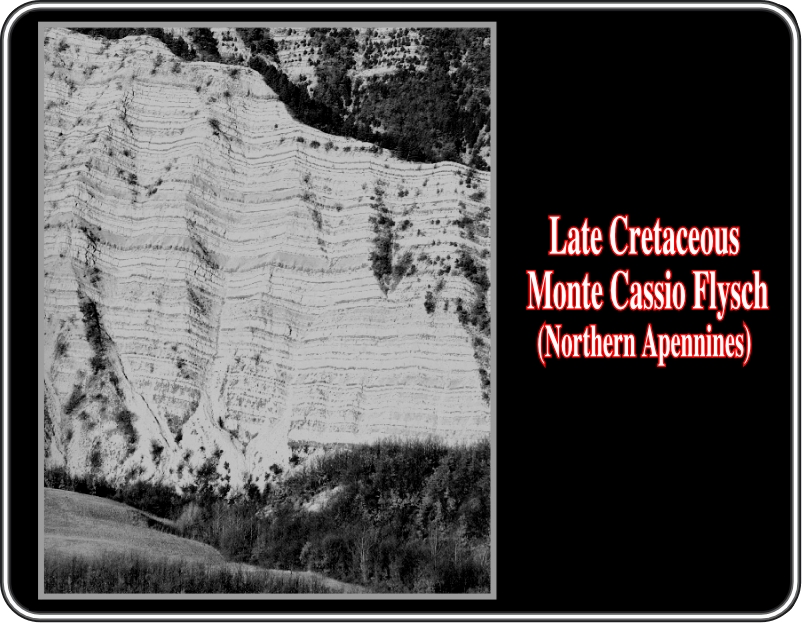
In basinal turbidite depositional systems, the plot of thickness of the lobes against rank, on a log-log format, shows a parabolic fractal distribution.
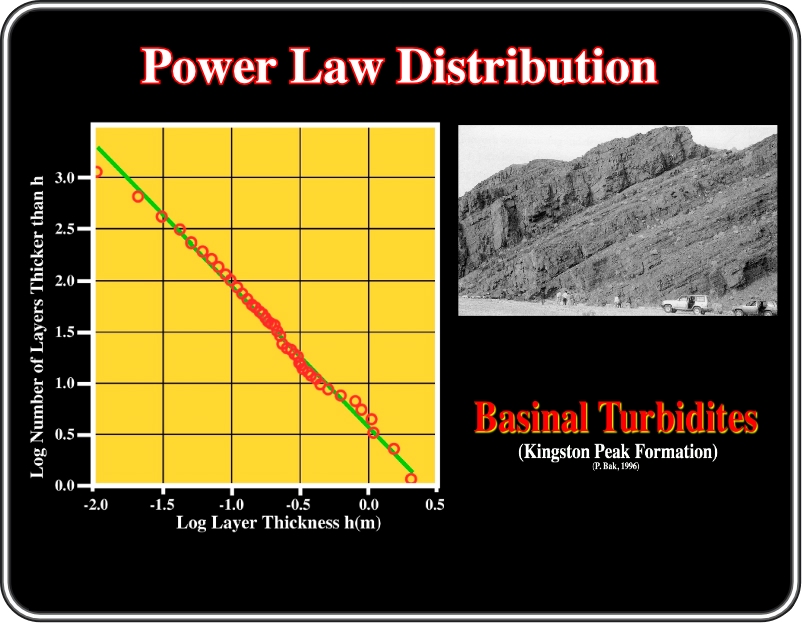
The of turbidite layers thicker than h as a function of the logarithm of the layer h for 1,235 turbidites observed in the Kingston peak formation. The straight line has a slope of 1.39, indicating the power law distribution of the thickness of the layers, and thus for the distribution of distribution of avalanches which formed them (Rothman et al., 1994).
to continue press
next
![]()
Send E-mail to carloscramez@gmail.com or to carlos.cramez@bluewin.ch with questions or comments about this conference.
Copyright © 2006 CCramez
Last modification:
August, 2014