

b) Calibration of Seismic Data
Any tentative geological interpretation of a seismic line, particularly, when done in sequence-cycle or continental encroachment sub-cycles must be calibrated and tested by the exploration wells' results. The major seismic reflectors and seismic surfaces, defined by reflections terminations, especially, those corresponding to unconformities must be dated.
The age of an unconformity is, relatively, difficult to determine. It corresponds to the age of the erosional surface induced by a relative sea level fall. The age of an unconformity is the age of the relative sea level fall, which is given by the minimum hiatus between the sediments underlying and overlying the unconformity. The minimum hiatus between two consecutive sequence-cycles (separated by the unconformity or by its correlative deep-water paraconformity) gives the age of the basin floor fans of the upper sequence-cycle, which is given by the age of the pelagic intervals between each turbidite bed. The fauna of turbidite bed is not significant. The sedimentary particles forming a turbidite bed are transported from different provenances (environments and ages). When an exploratory well recognized just highstand sediments, the age of unconformities (lower and upper) cannot be correctly determined. The time gap between the sediments of the adjacent to the sequence-cycle boundaries is too big (in a sequence-cycle the hiatus decrease seaward).
The next figures illustrate exploration well calibrations than can be interesting for a better understand of the geology of the onshore Kwanza geographic basin, particularly for the calibration of the new onshore seismic data shot by Sonangol, in 2010-2012.
1) Flamingo Well (Angola offshore)
Flamingo well, located in offshore block 6 (location in figure 038). Its stratigraphic results can be extrapolated to calibrate, tentatively, the new seismic lines shot by Sonangol (2012) in onshore Kwanza geographic basin.
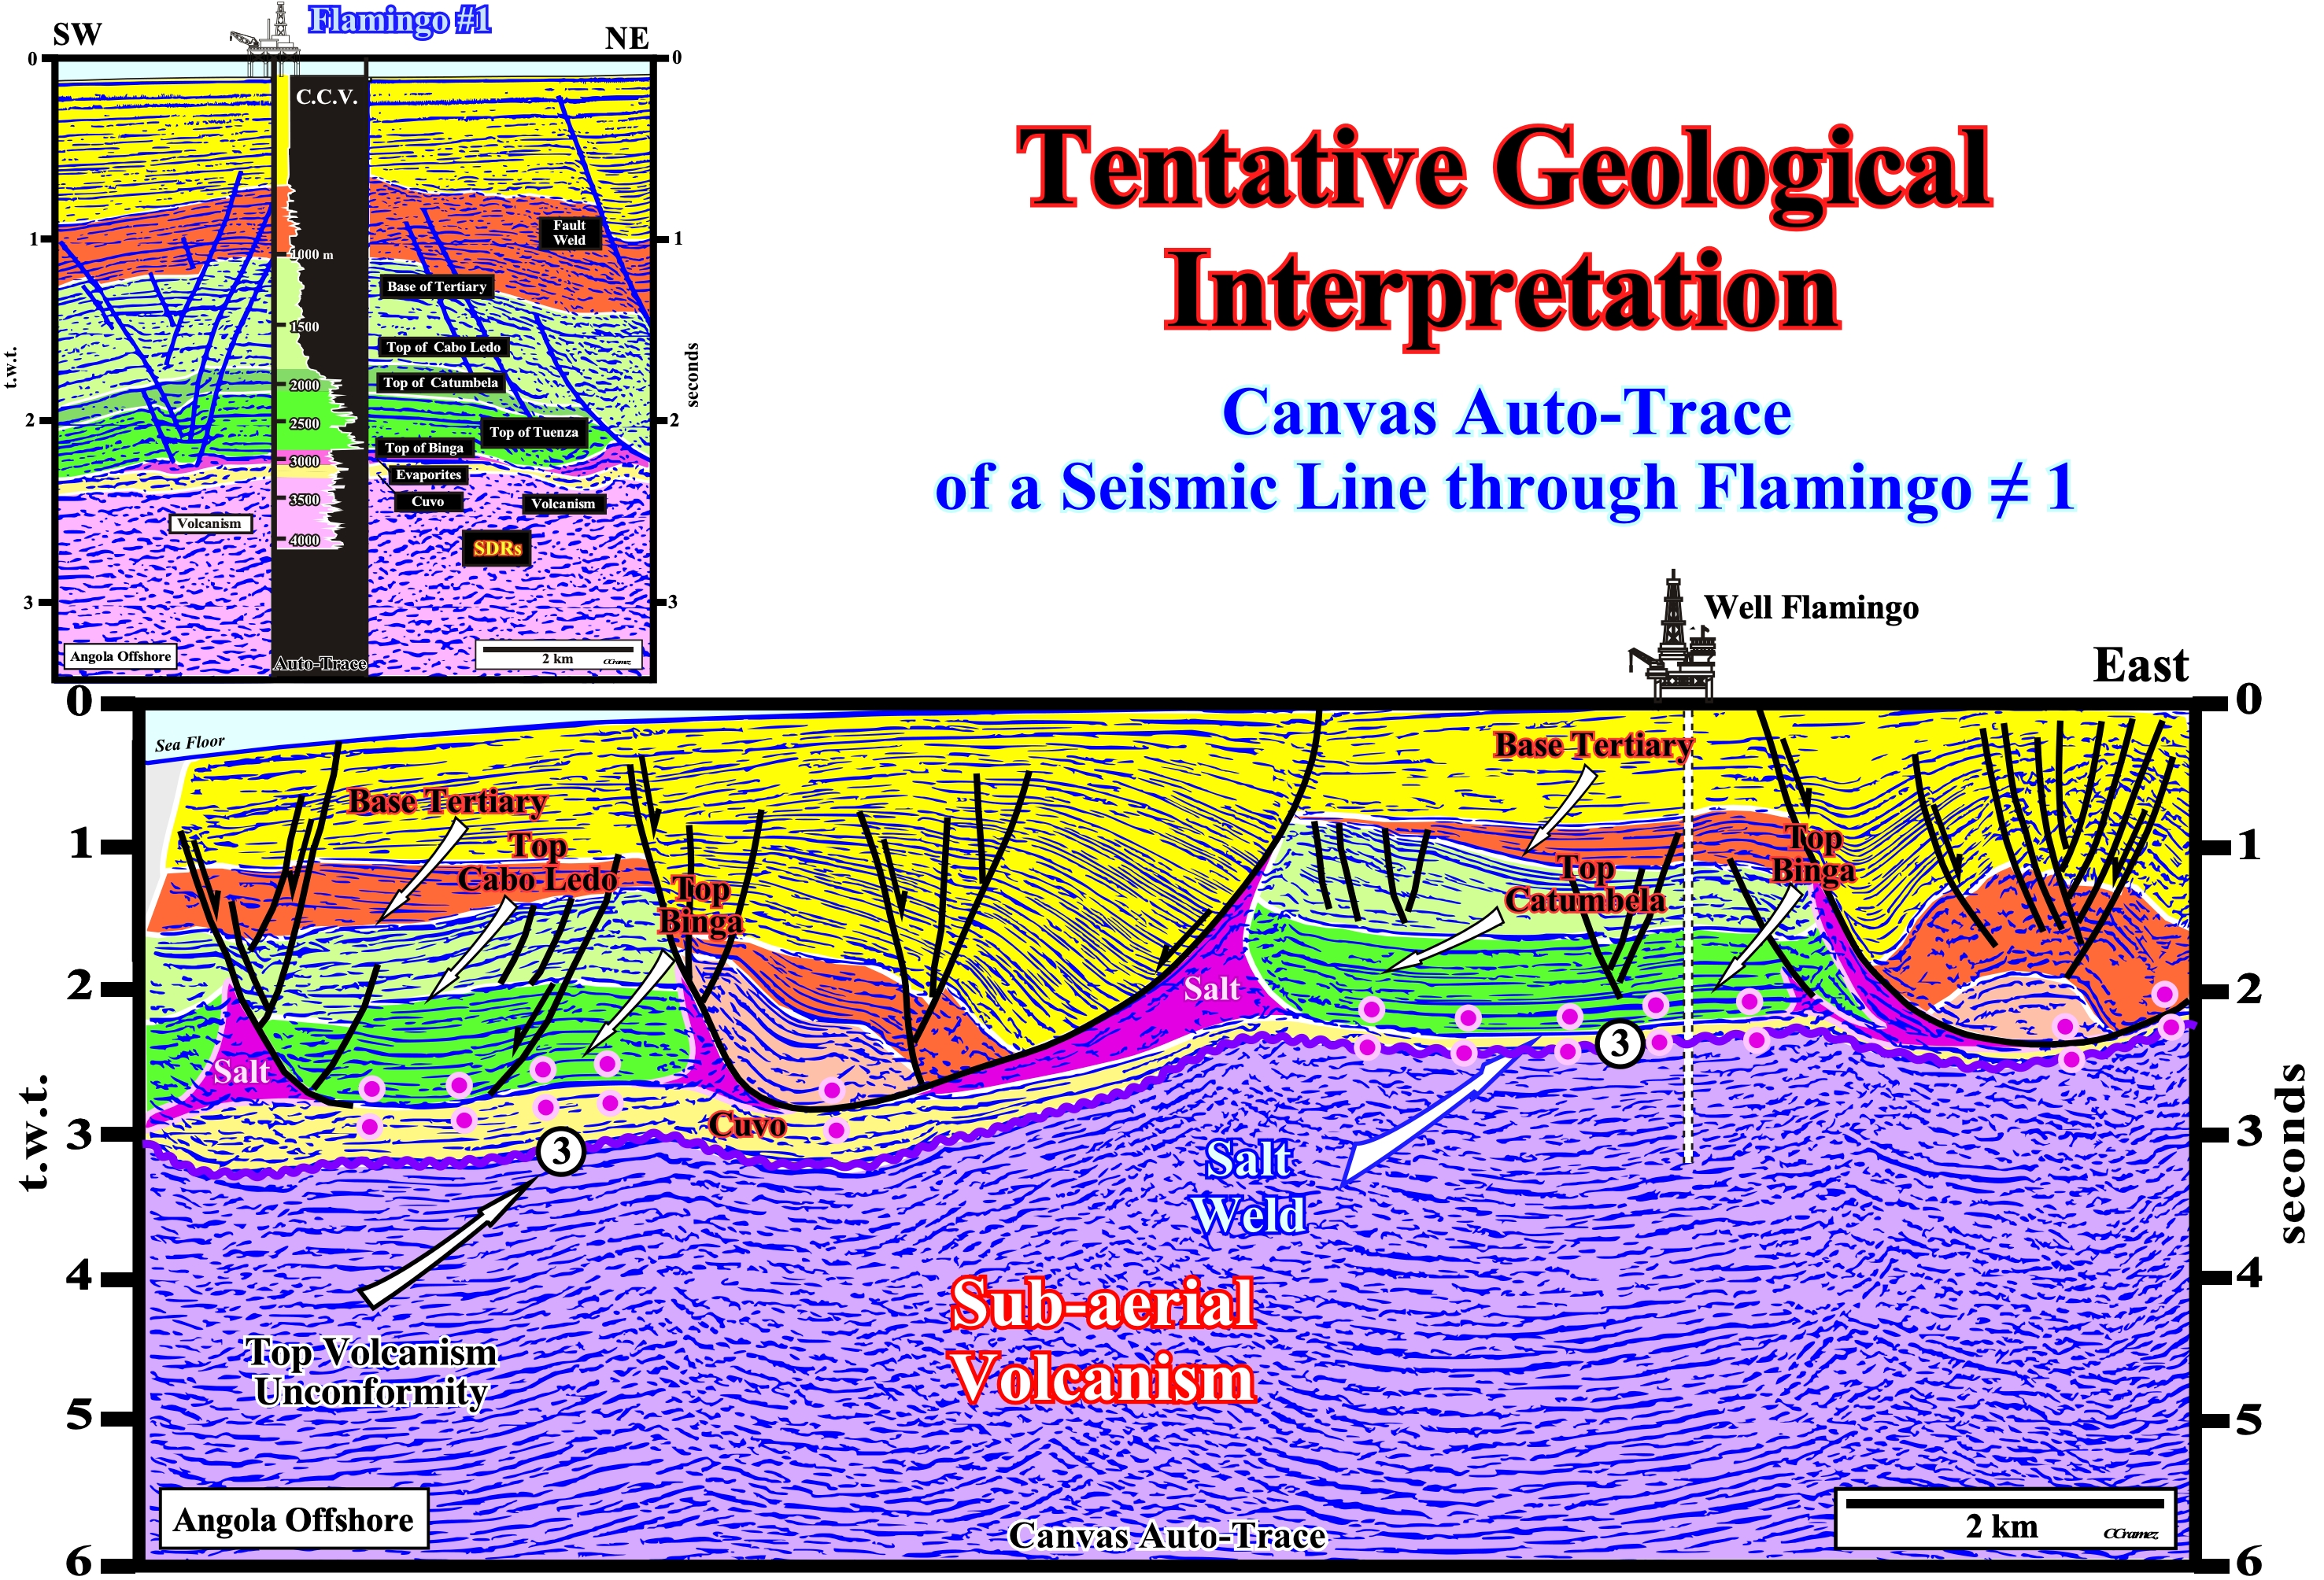
Figure 037- This tentative geological interpretation of a Canvas auto-trace of a seismic line of the Kwanza geographic basin (conventional offshore is not done in cycles-sequence. The seismic intervals taken into account correspond, roughly, to continental encroachment sub-cycles. With the exception of the Tertiary depocenters (there are two obvious depocenters), in which the sedimentation rate is important, the intervals with a normal sedimentation rate, the sequence-cycles are too thin to be, correctly, identified. The salt interval (colored in pink) is very discontinuous and deformed. Four salt welds are discernible. The bottom of the salt and the salt welds mark a salt induced tectonic disharmony, which is, mainly, created by vertical and seaward the salt flowage. Below the salt induced tectonic disharmony, the Cuvo formation (colored in yellow) is, easily, recognized. Its thickness decreases eastward, becoming, almost, under seismic resolution (less than 20-40 meters). Below the Cuvo formation, thick lava flows dipping and thickening basinward (westward) are quite evident. They were corroborated by the Flamingo ≠ 1 well results. The lower limit of the lava flows, i.e., the break-up unconformity, is not visible or masked by the pitfalls created by the lateral variations of the velocity interval of the cover (salt + overburden). Theoretically, pitfalls can be induced by (i) Changes in interval velocity ; (ii) Geometry of the reflector ; (iii) Recording and (iv) Playback (software programs carrying out tasks from retrieving time series of seismic data). Regional interval velocity changes seldom give trouble. On the contrary, abrupt change in velocity due to an equally abrupt structural change can have disastrous consequence: (a) Reverse faults create pull-ups ; (b) Normal faults create pull-downs ; (c) Reefs induce underlying pull-ups ; (d) Surface or seafloor irregularities create coincidental subsurface reversals, etc. A epth section version can be used to avoid some pitfalls, providing that it is not in itself a pitfall. The lava flows recognized on this tentative interpretation have the same geometrical characteristics of the North Sea SDRs (acronym of Seaward Dipping Reflectors), as visualized on the perpendicular calibrated Canvas auto-trace (upper left corner of the figure), in which the seaward dipping of the lava flows is obvious. The original SW-NE seismic line strikes paralely to the lava-flows dip. On the West-East Canvas auto-trace (larger tentative interpreation), at the vertical of the fault welds (fault zones filled with salt), the seismic reflectors associated with sub-aerial volcanism are deformed by the lateral velocity variations created by the salt thickness variations. Contrariwise to the undeformed margin infra-salt clastic sediments (the break-up unconformity is not visible, since it is below the volcanic flows), the supra-salt sediments (overburden) are very deformed by halokinesis* and raft tectonics** .
* Kind of salt tectonics in which the salt flow is just due to its buoyancy, i.e., due to the release of the potential energy of gravity, in the absence of any significant lateral tectonic stress, i.e., in the absence of a compressive tectonic regime.
** Extreme extension characterized by the opening of synsedimentary deep grabens and separation of intervening overburden into rafts,which slide downslope on a decollement of thin salt, like a block-glide landslip.
On the above tentative geological interpretation of a Canvas auto-trace of a West-East seismic line passing through Flamingo ≠1 well (Block 6 of Angola offshore), several seismic intervals were considered in the Cretaceous overburden (Binga, Catumbela, Cabo Ledo formations) and in Tertiary depocenters. Outside of the depocenters, above the Cretaceous sediments, only two tertiary intervals were recognized. All this intervals were calibrated by the results of Flamingo ≠1 and Águia ≠1 exploration wells, as illustrated in the figure 038.
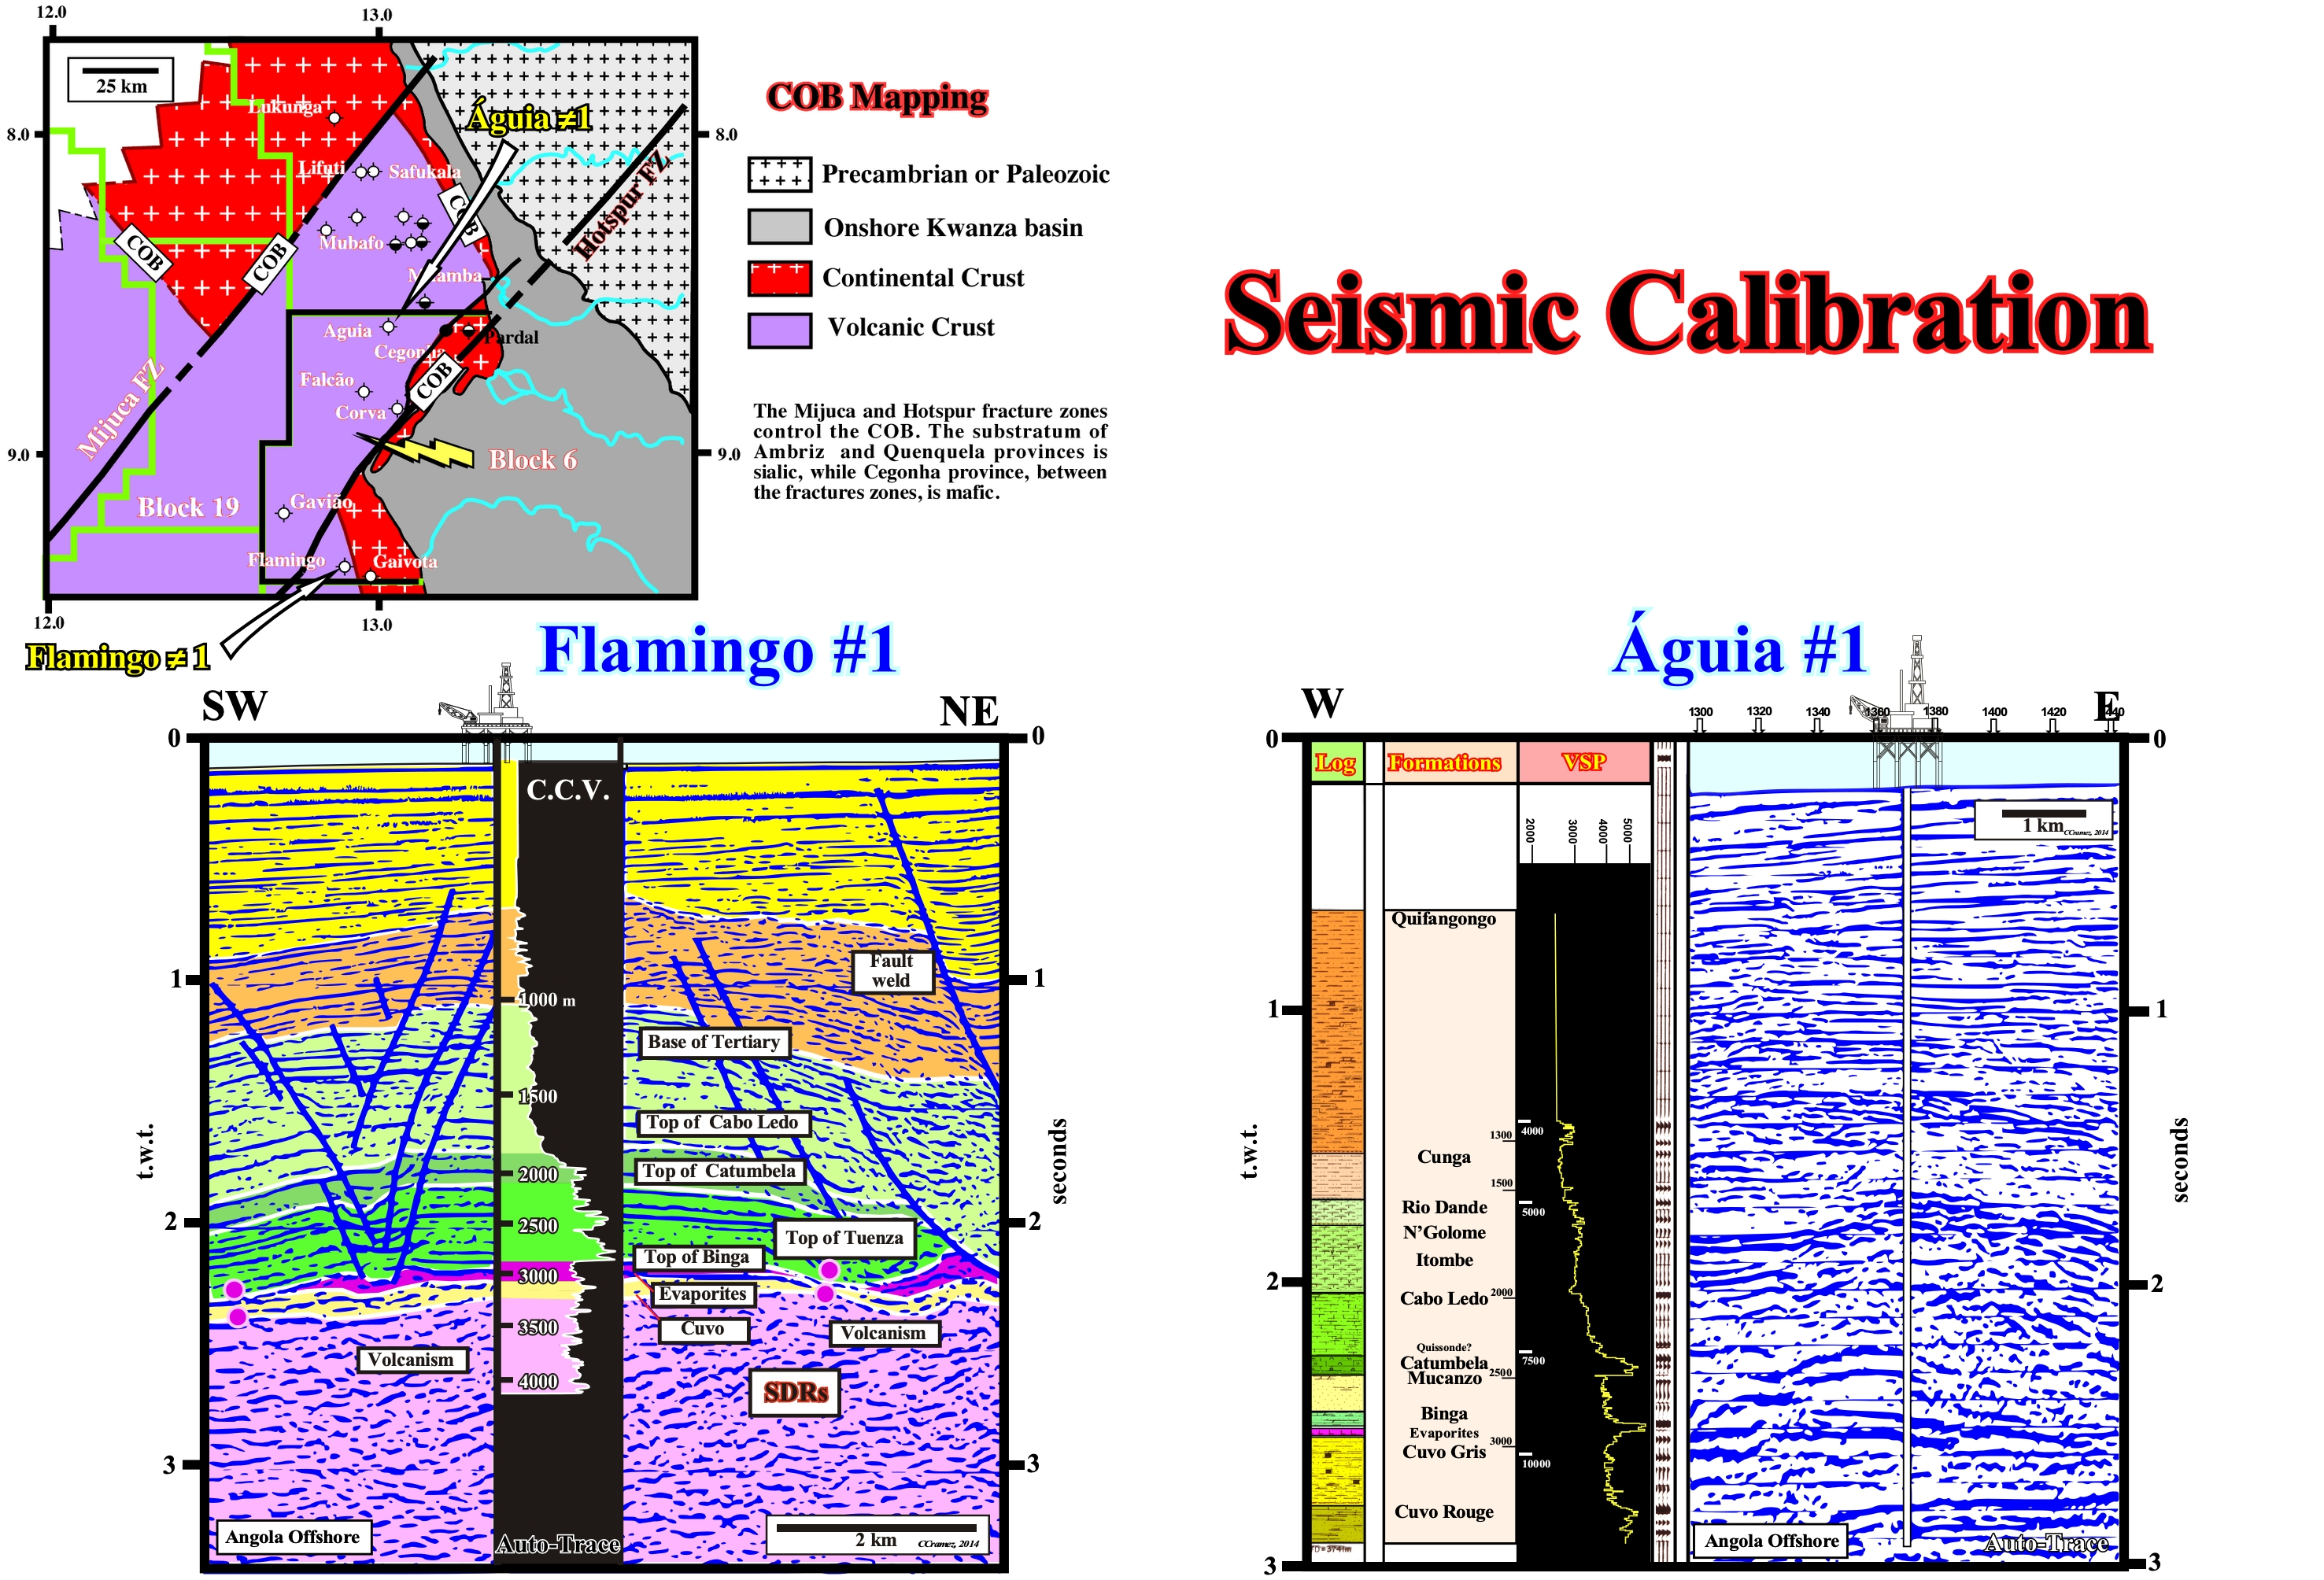
Figure 038- In the calibration made from the results of the Flamingo ≠1 well, we used the sonic log as reference. The salt interval (violet) is associated with a high velocity zone between the carbonate sediments (green) and the Cuvo sandstone formation (yellow). The well drilled more of 1,000 meters lava flows (in pink), which on this line (oriented SW-NE) have a dip of about 10-20° southward. Above salt interval, the colored in dark green corresponds to a set of geological formations (Binga, Mucanzo, Catumbela and Cabo Ledo). The Binga, Catumbela and Cabo Ledo formations have, mainly, a carbonate facies, while the Mucanzo is sandstone formation. The interval light green corresponds to the clay-sand formation of Itombe and N'Golome. The brown interval corresponding to the sediments of the base Tertiary, i.e., the sediment and Gratidão and Cunga formations, while the yellow interval corresponds to the sediments of the Quifangondo formation. The big difference between the results of Águia ≠1 well, located on a seismic line, more or less, parallel to the line through Flamingo ≠1 well, is, as it can be, easily, seen, Aguia ≠1 recognized, below the evaporites, a large infra-salt depocenter (Cuvo Gris+ Cuvo Rouge post break-up interval) that does exist in Flamingo ≠1. In other words, in the well Flamingo ≠1, the margin infra-salt sediments are reduced to a thin sandstones interval of the Cuvo formation overlying the sub-aerial volcanism, while in Águia ≠1, over 600 meters of infra-salt margin sediments were drilled without finding volcanism. Above the salt, i.e., in the overburden the geological formations are easily correlated.
As illustrated in the above figure, often the calibration of a tentative seismic interpretation, as in Águia ≠1, can be made from of a vertical seismic profile (VSP), which implement the most commonly used well seismic. This implementation requires a seismic source, located at the surface and a well geophone anchored successively at different depths. The source has a fixed position. It is located, generally, at the vertical of the geophone irrespective of its depth. The well seismic has a metric to decametric vertical resolution and a lateral investigation a few dozen to several hundred meters.
2) Labrador Offshore Well (Eastern Canada Offshore)
The figure below illustrates the main geological events* (not geological things or geological objects) used by Total's geoscientists to calibrate the tentative geological interpretations of the seismic lines around an exploration well drilled in Labrador offshore (Canada).
* Geology is not a set of geological things, but a set of geological events. Geological things or geological objects continue over time, geological events are of limited duration.
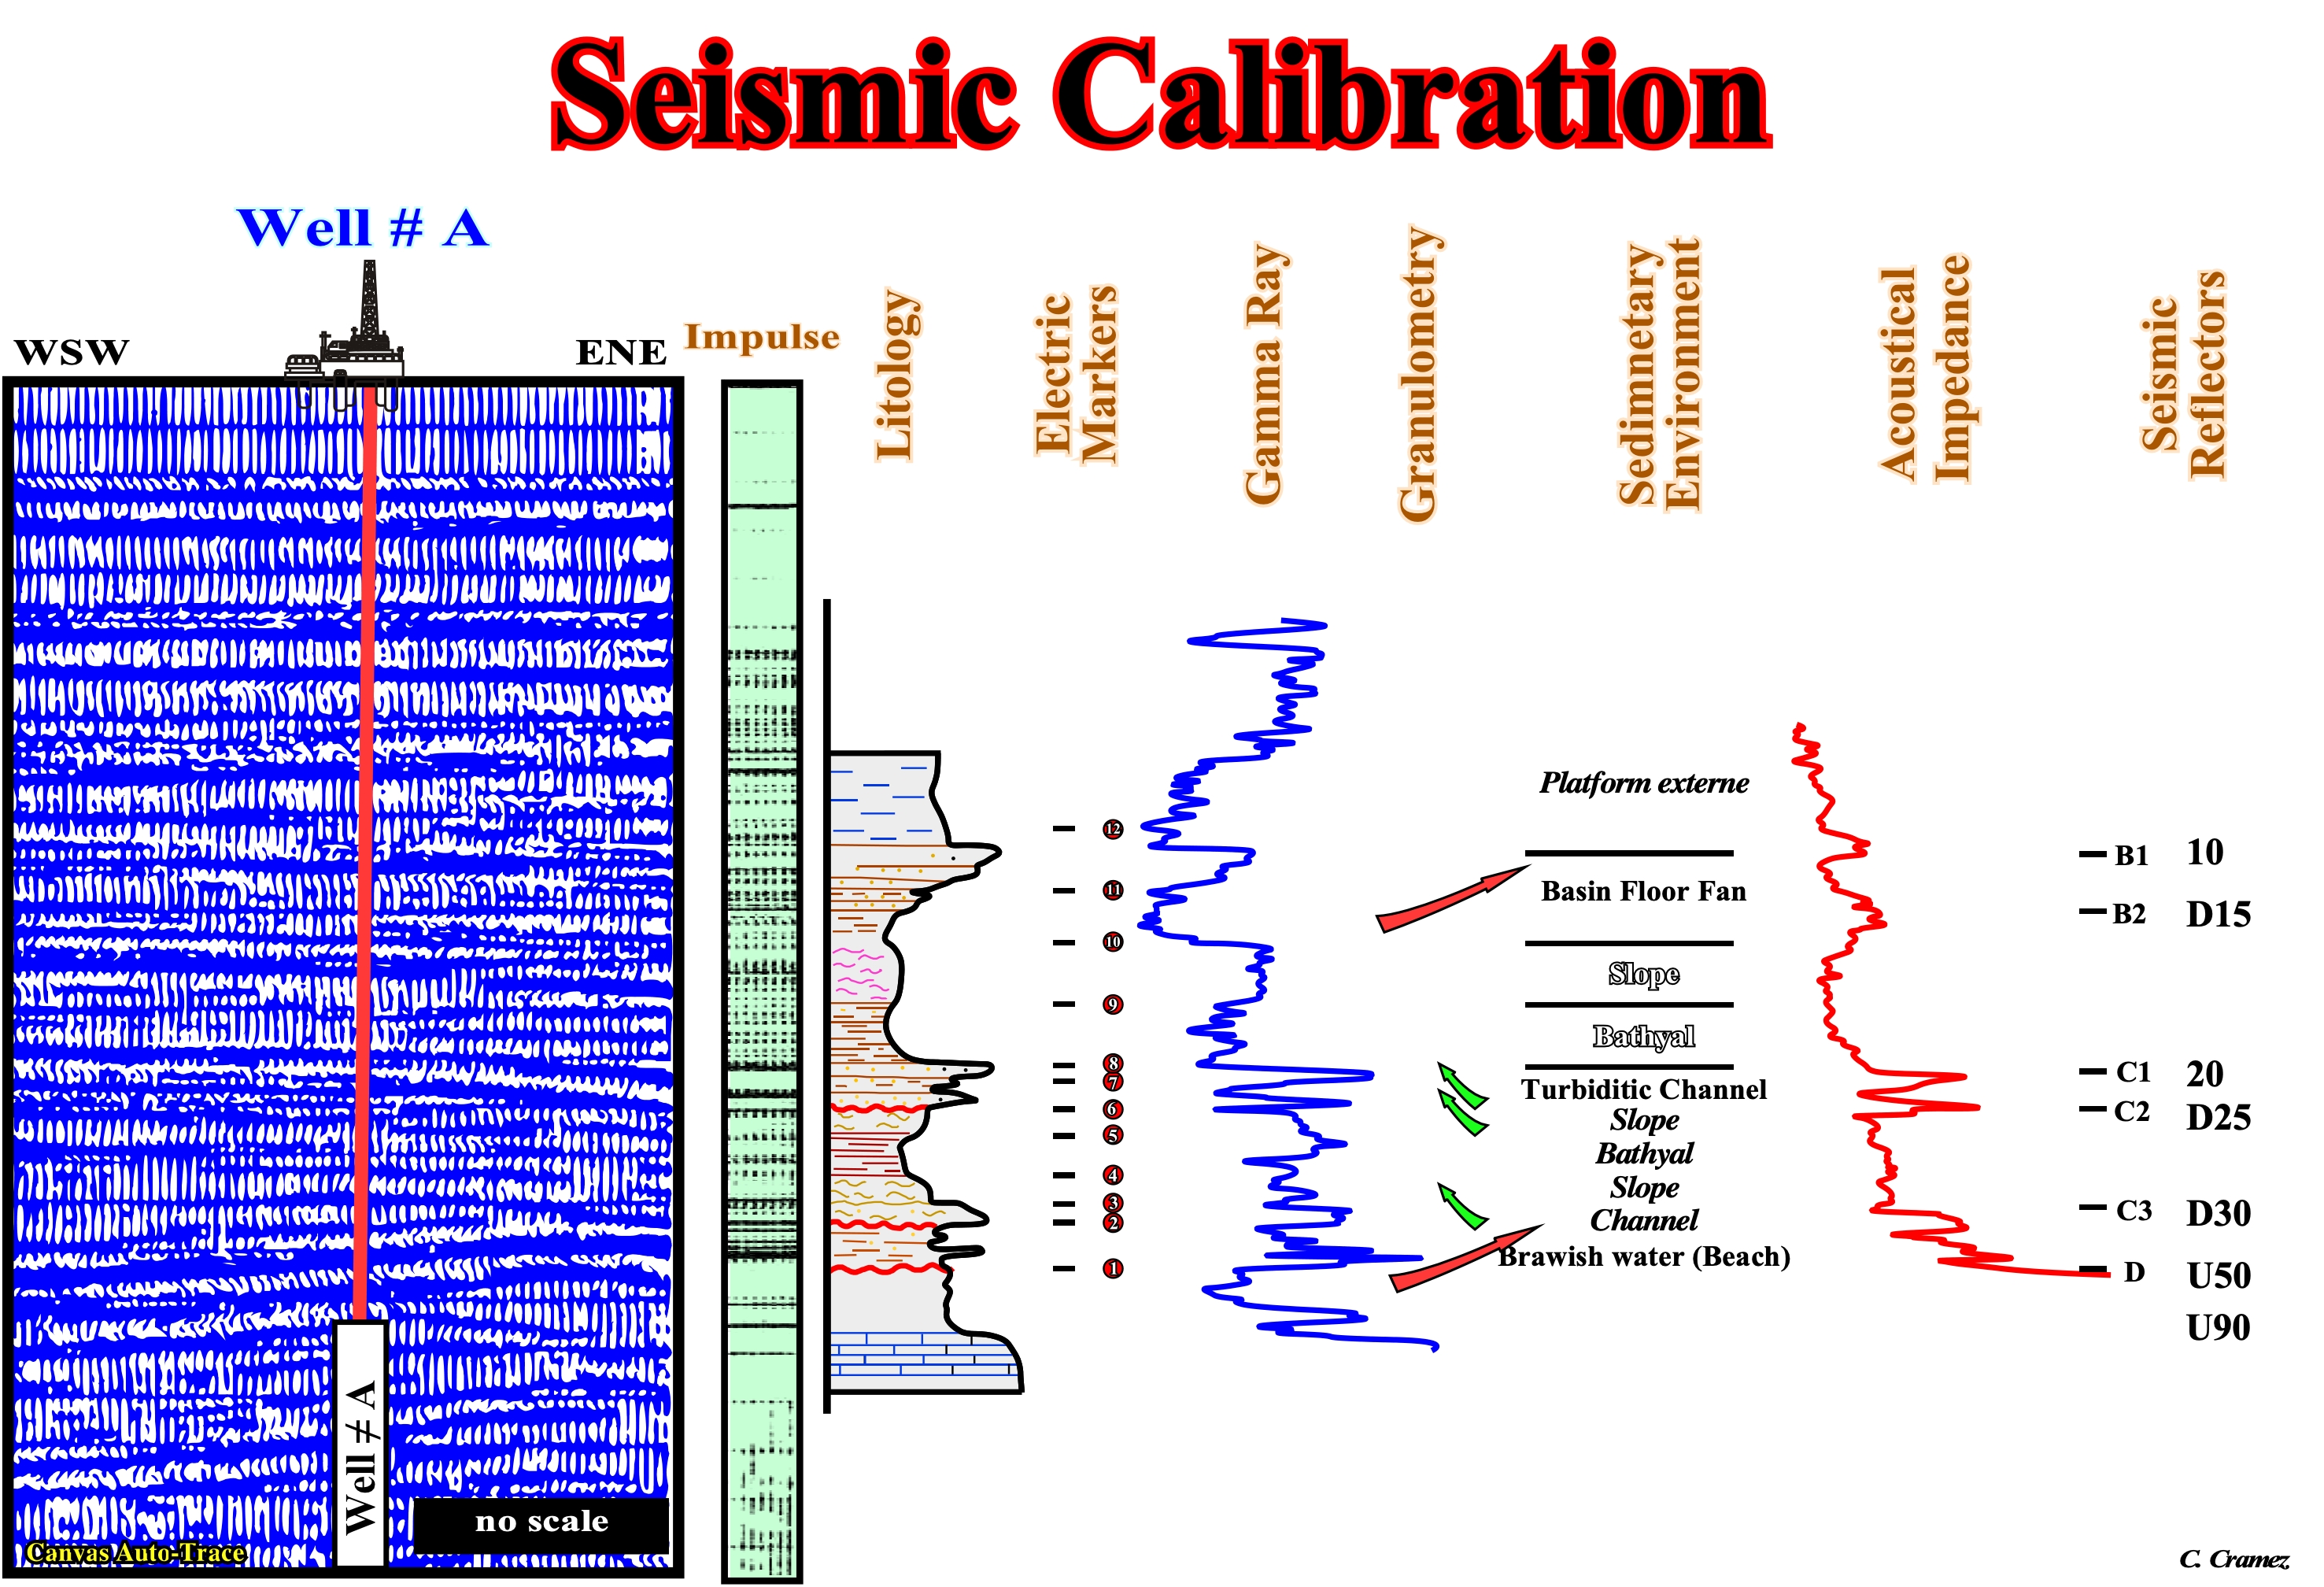
Figure 039- The sequential interpretation of seismic lines around the well ≠B-87, was calibrated (unconformities dating) by the interpretation of the the electrical logs, penetration logs and micropaleontologic analysis of the cuttings. Between interval 2 and 11, the geoscientists had not major problems to date the unconformities. The well drilled sediments located seaward of the basin edge, i.e. sediments deposited in deep-water sedimentary environments and some of them were cored. In deep-water environments, the hiatus between the sediments underlying and overlying unconformities is minim. The dating of the relative sea level responsible for the sequence boundary (unconformity) can be, easily, determining by the fauna of the pelagic interval between consecutive turbidite beds. The pelagic E layer (Bouma's terminology) has an appropriated fauna for dating the minimum hiatus. In shallow water environments the dating of the unconformities (erosional surfaces) can just be made by correlation with the correlative deep-water paraconformities.
The unconformities (erosional surfaces) are the most difficult geological events to date. The micropaleontologic studies of the cuttings are not enough. When a well crosses an unconformity, the micropaleontologic study of cuttings allows just to date intervals, immediately, above and below the unconformity. Such a study does not allow to date the relative sea level fall responsible for the erosional surface, which emphasizes the unconformity, as the gap between the two intervals is very large. Only when the well recognizes the minimum hiatus between two adjacent sequence-cycles, the micropaleontology can date the unconformity separating them (or the correlative deep-water downdip paraconformity). This happen in the deeper parts of the basin, where unconformity recognized up-dip (upper slope, shelf and coastal plain) correlates down-dip with the paraconformity bounding the sequence-cycles in the abyssal plaint. The age of an unconformity is given by the age of basin floor fans that were deposited during the relative sea level fall that created the erosional surface that marks the unconformity. The basin floor fans are, easily, date, when geoscientists can sample the pelagic sediments between them.
3) Australia Onshore Well
The example below shows the difference between a tectonically enhanced unconformity, that geoscientists call, often, angular unconformity and a usually cryptic unconformity. Both are induced by a relative sea level fall (combined action of the absolute sea level and tectonics) but the tectonic component of the relative sea level is quite small in a cryptic unconformity. It is for this reason that certain geoscientist call it eustatic unconformity. In spite of the fact that the hiatus associated with the tectonically enhanced unconformity can be, locally, too much important compared with the hiatus of a cryptic unconformity, their geological dating are quite difficult, since they requires, in both cases, the recognition and dating of the associated basin floor fans, i.e., of the basin floor fans induced by the relative sea level fall responsible for the unconformities (erosional surfaces)
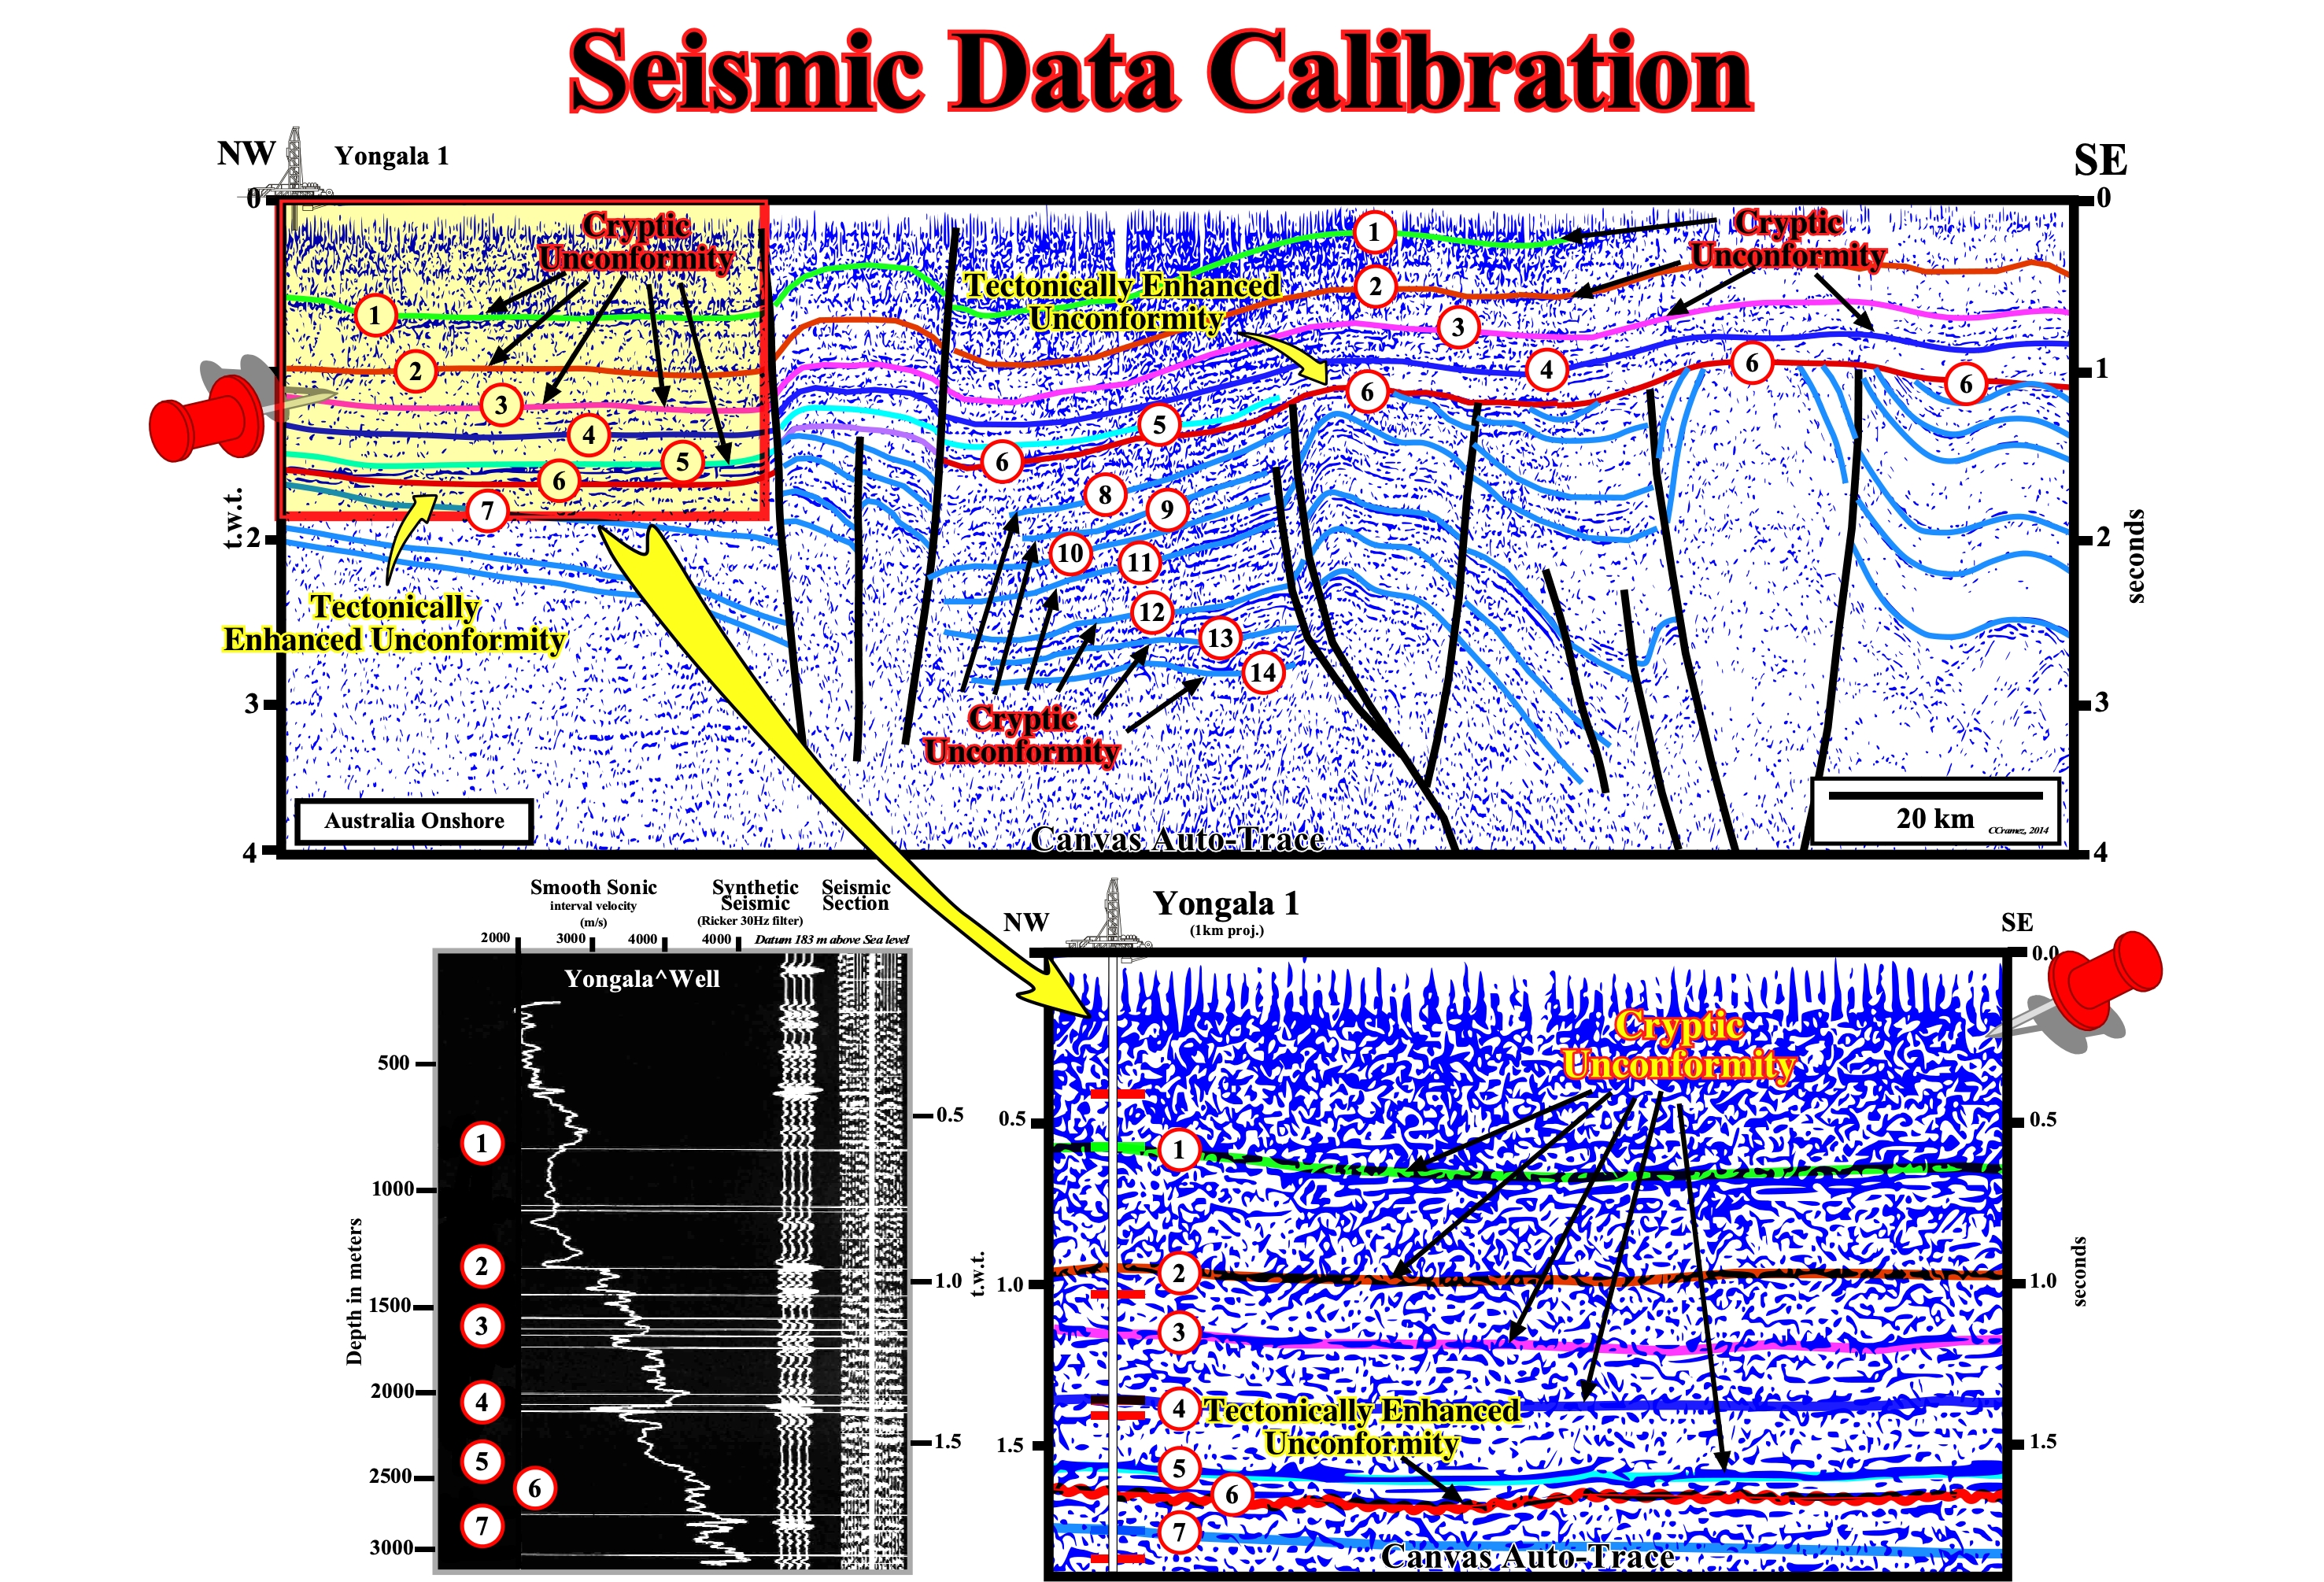
Figure 040- On this tentative geological interpretation of a Canvas auto-trace of a seismic line from the Australia onshore fourteen horizons were considered. The large majority correspond to unconformities (stratigraphic cycles boundaries). Erosion is just visible near the successive basin edges, where submarine canyons and incised valleys formed during the relative sea level falls. The horizon (6) emphasizes a tectonically enhanced unconformity (angular unconformity of several geoscientists). All unconformities are erosional surfaces associated with relative sea level levels falls. A compressional tectonic regimes (σ1 horizontally) shorten and uplift the sediments, but does causes erosion. In order to have erosion, the shortened sediments must to be exposed to erosional agents (water, wind, ice, etc.). This is only possible when there is a significant relative sea level fall that puts the relative sea level below the shelf break (highstand geological conditions) or below the basin edge (lowstand geological condictions). An extensive tectonic regime (σ1 vertical) lengthened the sediments which causes a subsidence and a relative sea level rise (aggradation). The results of the exploration well Yongala ≠1 allow to calibrate the first seven horizons (enhanced tectonically unconformity included) of the above Canvas auto-trace using a smoothed sonic log, a synthetic film (30 Hz Ricker filter).
4) Aguia Well (Angola Offshore)
Westward of Luanda, in the conventional offshore (block 6), Total CAP drilled several exploration wells (Aguia ≠1, Cegonha ≠1, Flamingo ≠1 and Gaivota ≠1). The hydrocarbon potential of margin infra-salt sediments, deposited above the lava flows postdating the break-up unconformity was, clearly, recognized by Aguia ≠1, as illustrated in figure 041.
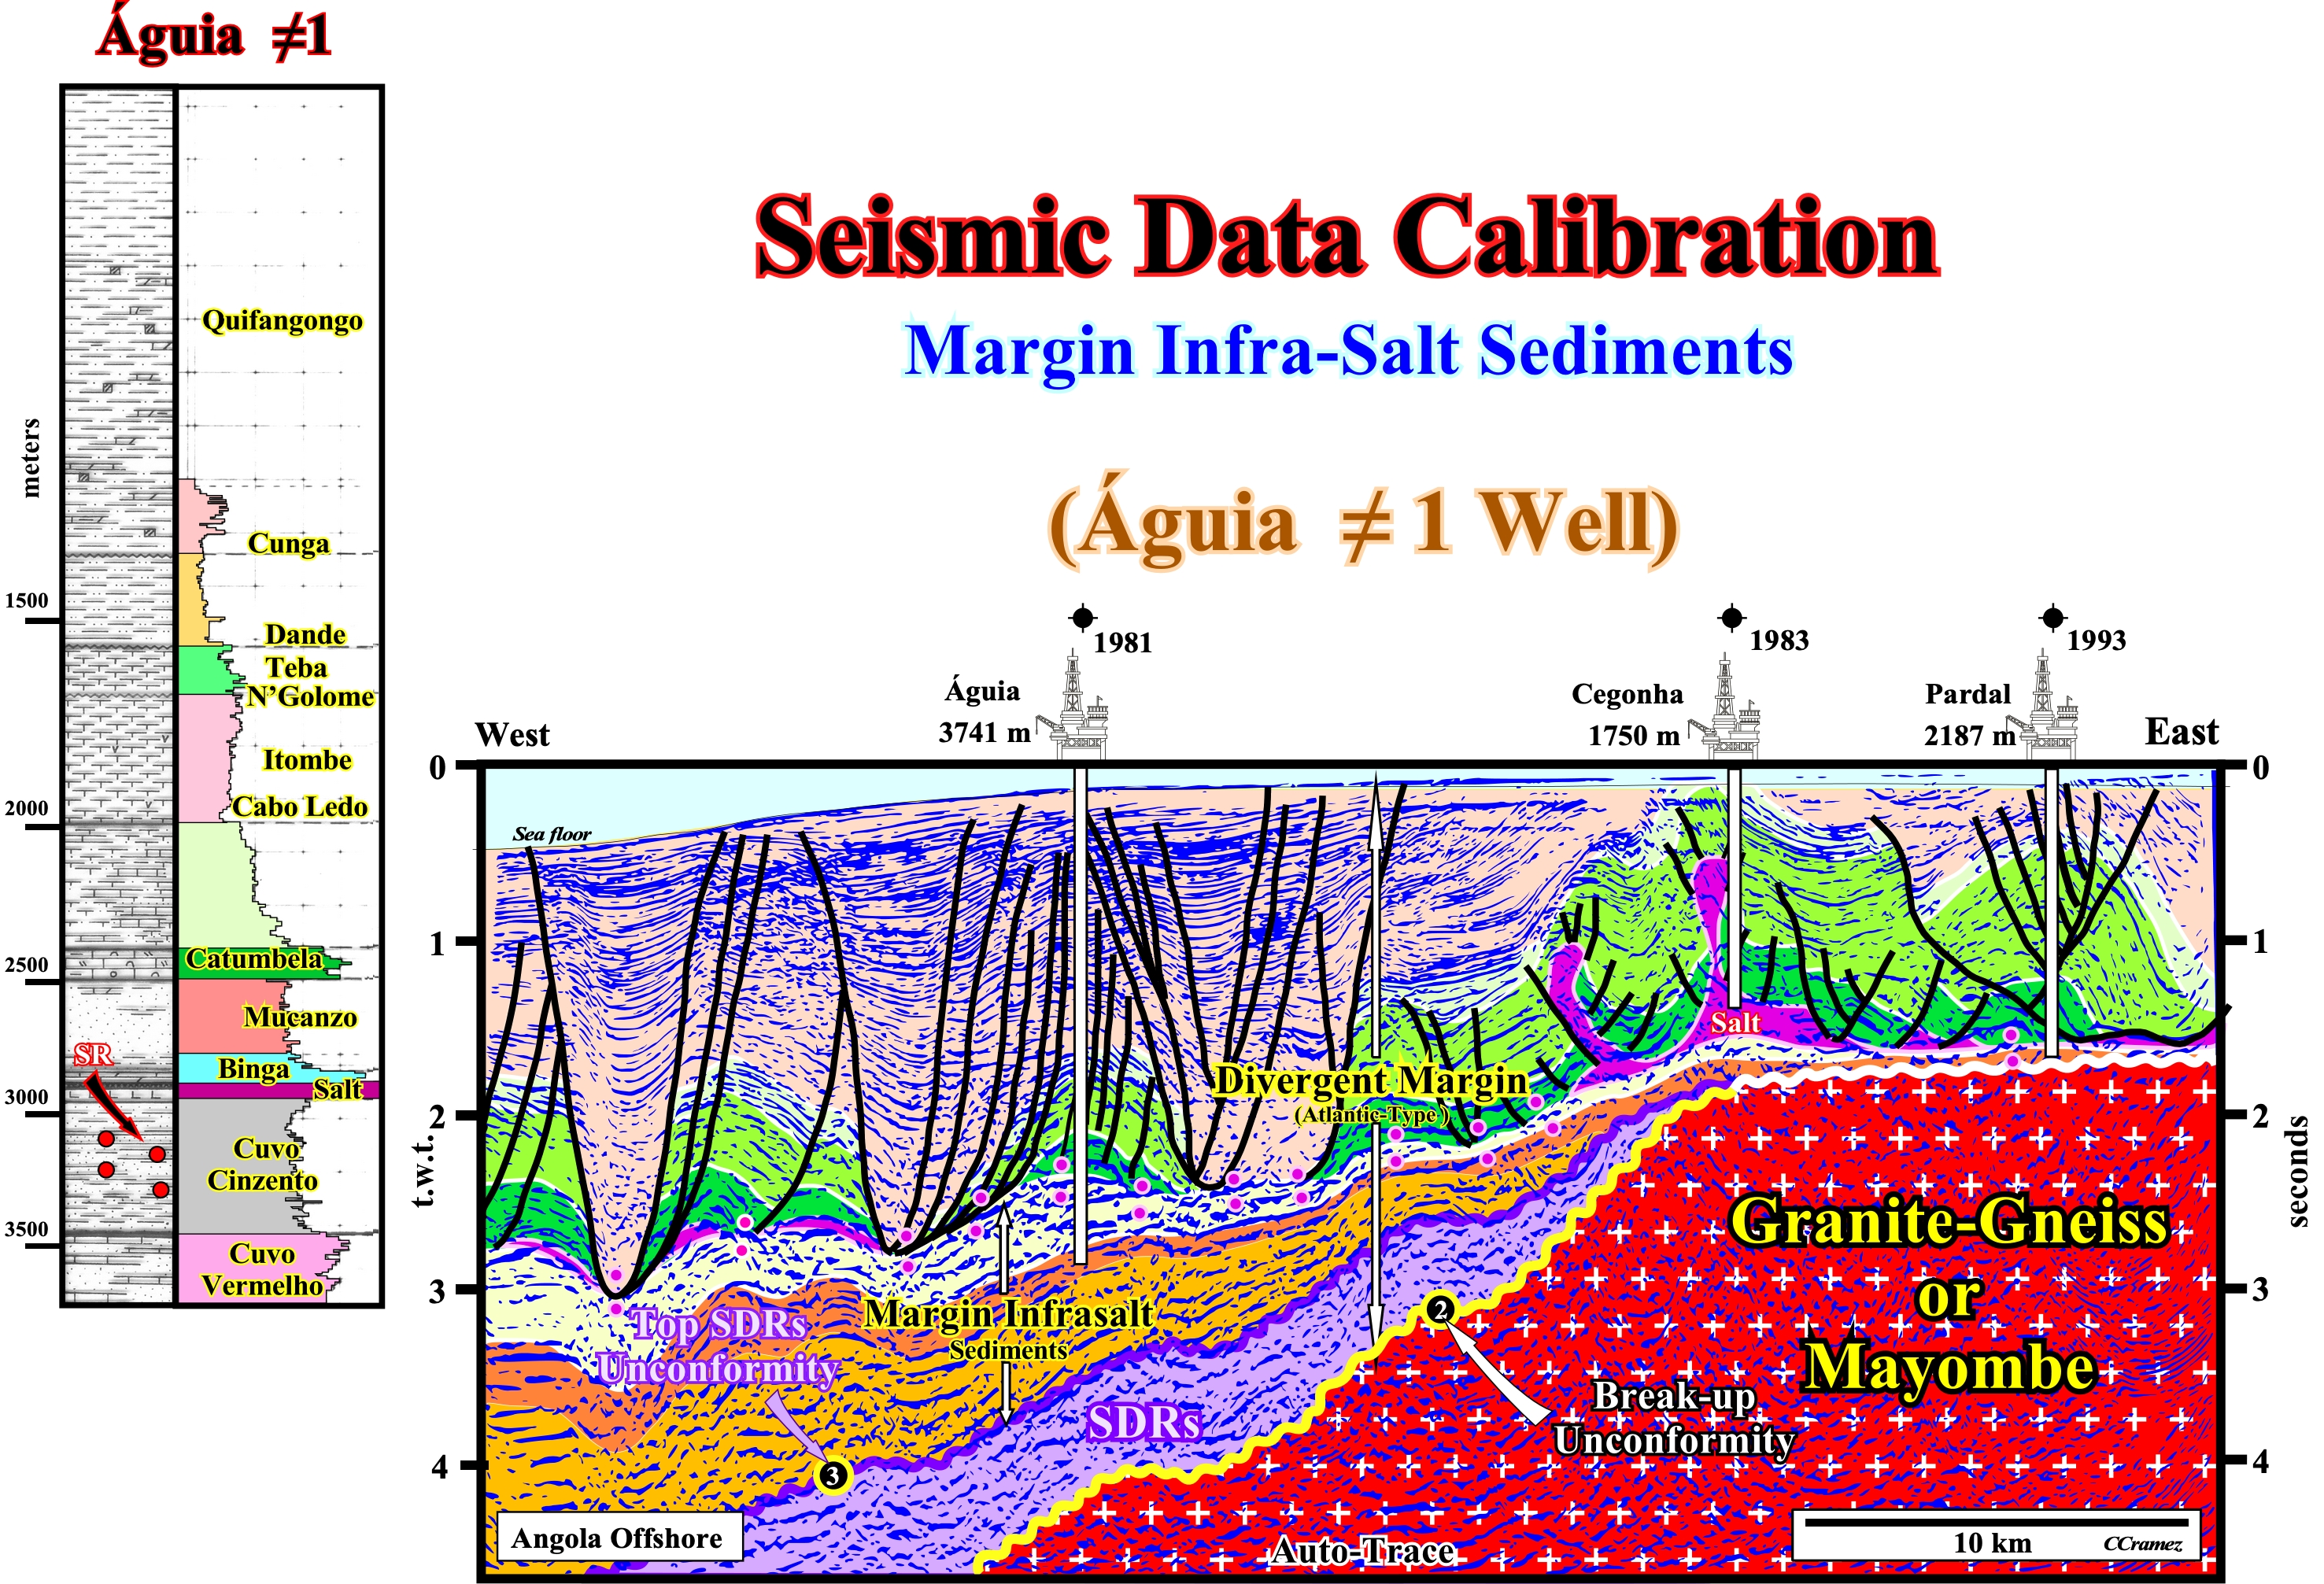
Figure 041- Westward of Luanda, in the conventional offshore (block 6), in which Total CAP drilled several wells research (Aguia ≠1, Cegonha ≠1, Flamingo ≠1and Gaivota v), the hydrocarbon potential of margin infrasalt sediments was clearly recognized by Aguia ≠1. As illustrated in this exploration well, in the upper part of the margin infra-salt sediment s (grey Cuvo formation of Petrangol), there are organic-rich layers, which may be considered as source-rocks, since its organic matter is mature. At the bottom (red Cuvo formation), the facies is calcareous. Several intervals can be considered as potential source-rocks like and others as reservoir-rocks in which traces of oil were recognized. As this tentative geological interpretation suggests there is any trap in infrasalt sediments in the Aguia ≠1 area. The wavy geometry of this intervals are clearly induced by lateral variations of the velocity caused by salt, carbonates (rafts tectonics) and tertiary depocenters. At the stratigraphic point of view, it is interesting to note : (i) The breakup unconformity (in white) limits the basement (granite-gneiss rocks or the Mayombe formation), within no type-rift basin are discernible ; (ii) Immediately above the breakup unconformity lava flows (violet) were deposited ; (iii) The unconformity of the top of lava flows marks the deposition onset of margin infrasalt sediments that form a large a depocenter in which potential source-rocks area likely. The margin infra-salt depocenter, which in this was was only hit by two exploration wells (Aguia -1 and Falcão-1), extends to the onshore. It is very evident on the new seismic lines shot by Sonangol, but was never, significantly, recognized, in Petrangol or Total CAP wells. All or almost all of the remaining petroleum potential of the Kwanza onshore is associated with this infra-salt depocenter
5) Gaivota Well (Angola Offshore)
The calibrations of seismic lines on which were located the Flamingo ≠1 and Gaivota ≠1 exploration wells (block 6), illustrated in figure 042, are particularly interesting.
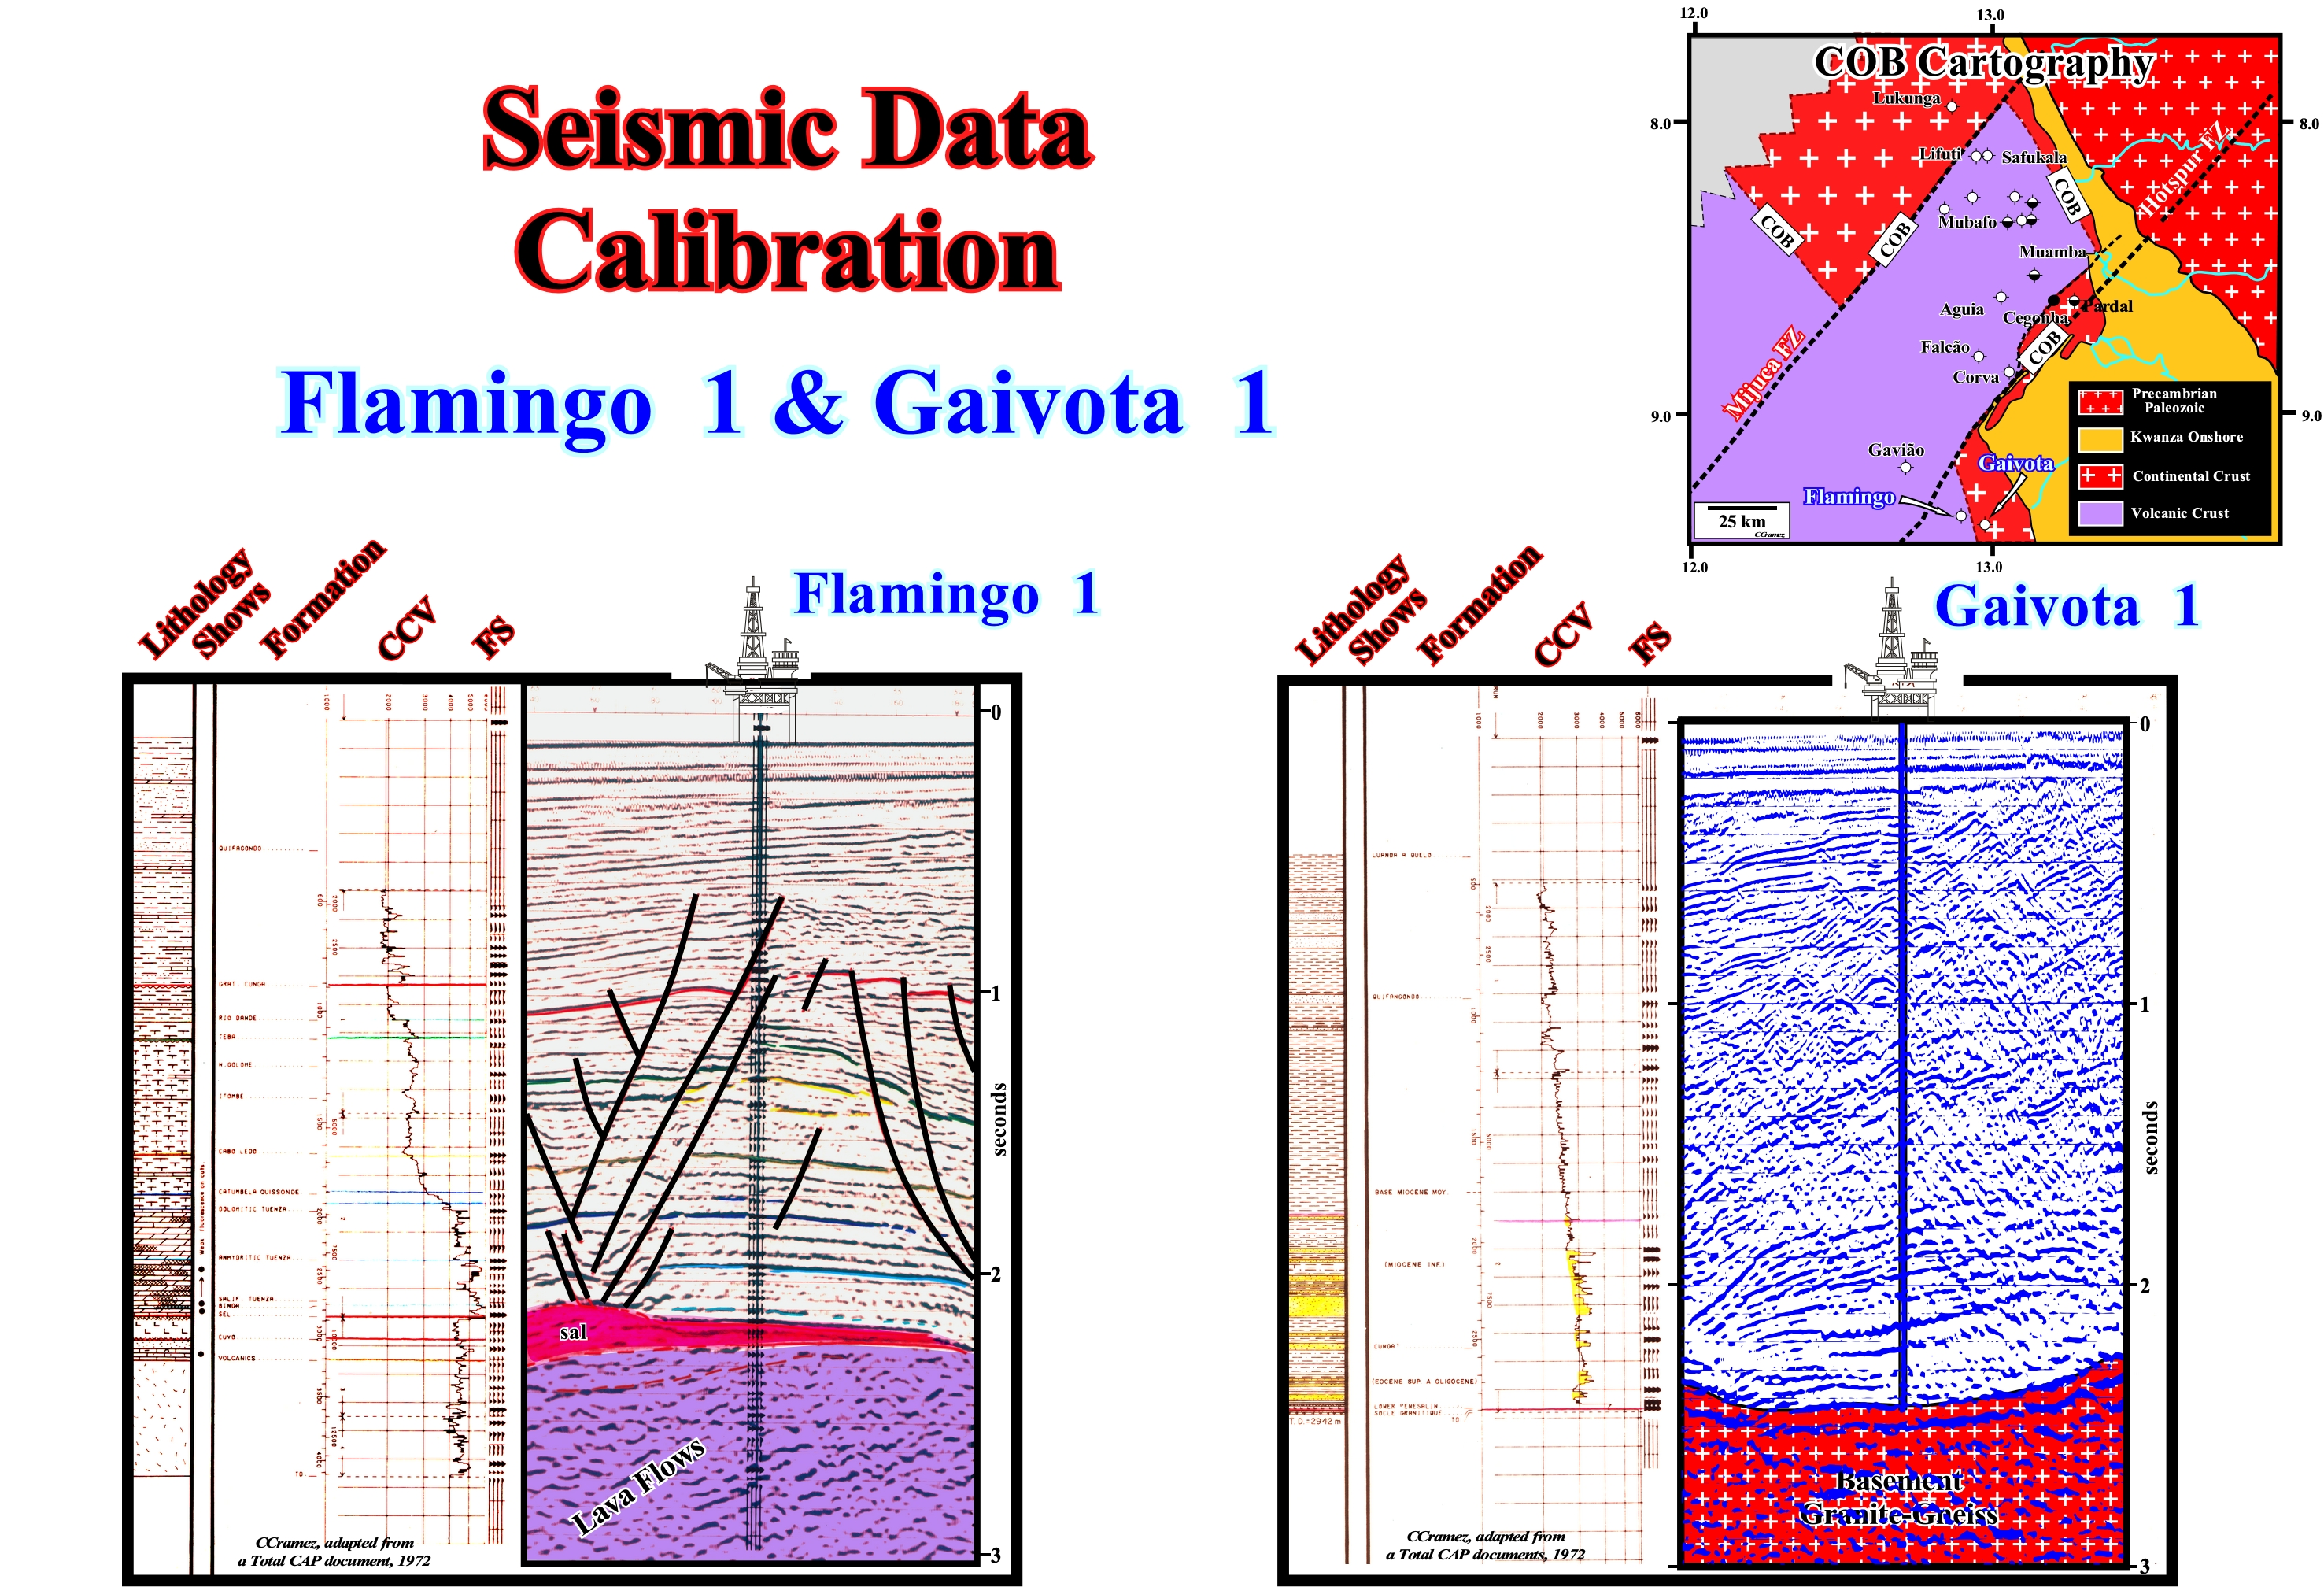
Figure 042- Flamingo-1 well calibrates a Cretaceous tectonic raft, while Gaivota calibrates a Tertiary depocenter. Flamingo ≠1 well recognized about 100 meters of salt, while no salt has been practically found in Gaivota ≠1, since the base of the depocenter corresponds to a salt weld. Under the salt, the Flamingo ≠1 well recognized an thin infrasalt interval (Cuvo formation), which is, practically, non-existent (under the seismic resolution) of Gaivota ≠1. Thick lava flows were found in Flamingo-1, whereas in Gaivotal, under the salt weld, the well entered directly in the Gondwana continental crust (granite-gneiss). This means that the COB ("Continent Oceanic Boundary") that is, here, the boundary between the continental sialic crust and the subaerial volcanic crust passes between Gaivota ≠1 and Flamingo ≠1. This conjecture is outlined on the map illustrating a tentative cartography of the COB, in which three geological provinces (Quenguela, Cegonha and Ambriz), limited by the fracture zones of Hotspur and Mijuca, are visible. The Gaivota ≠1 and Flamingo ≠1wells are located in the geological province of Quenguela, while the Águia -1 and Cegonha -1 are located in Cegonha province, in which the position of the COB is very close to the coastline. Also, between the province of Ambriz and Cegonha, the position of the COB is very different.
6) Chio Well (Angola Onshore)
The geological map and the old onshore seismic lines (non-migrated) shot by Petrangol and Total CAP allow to recognize a certain number of antiform structures. Chio antiform (figure 043) was tested by Chio ≠ 1well.
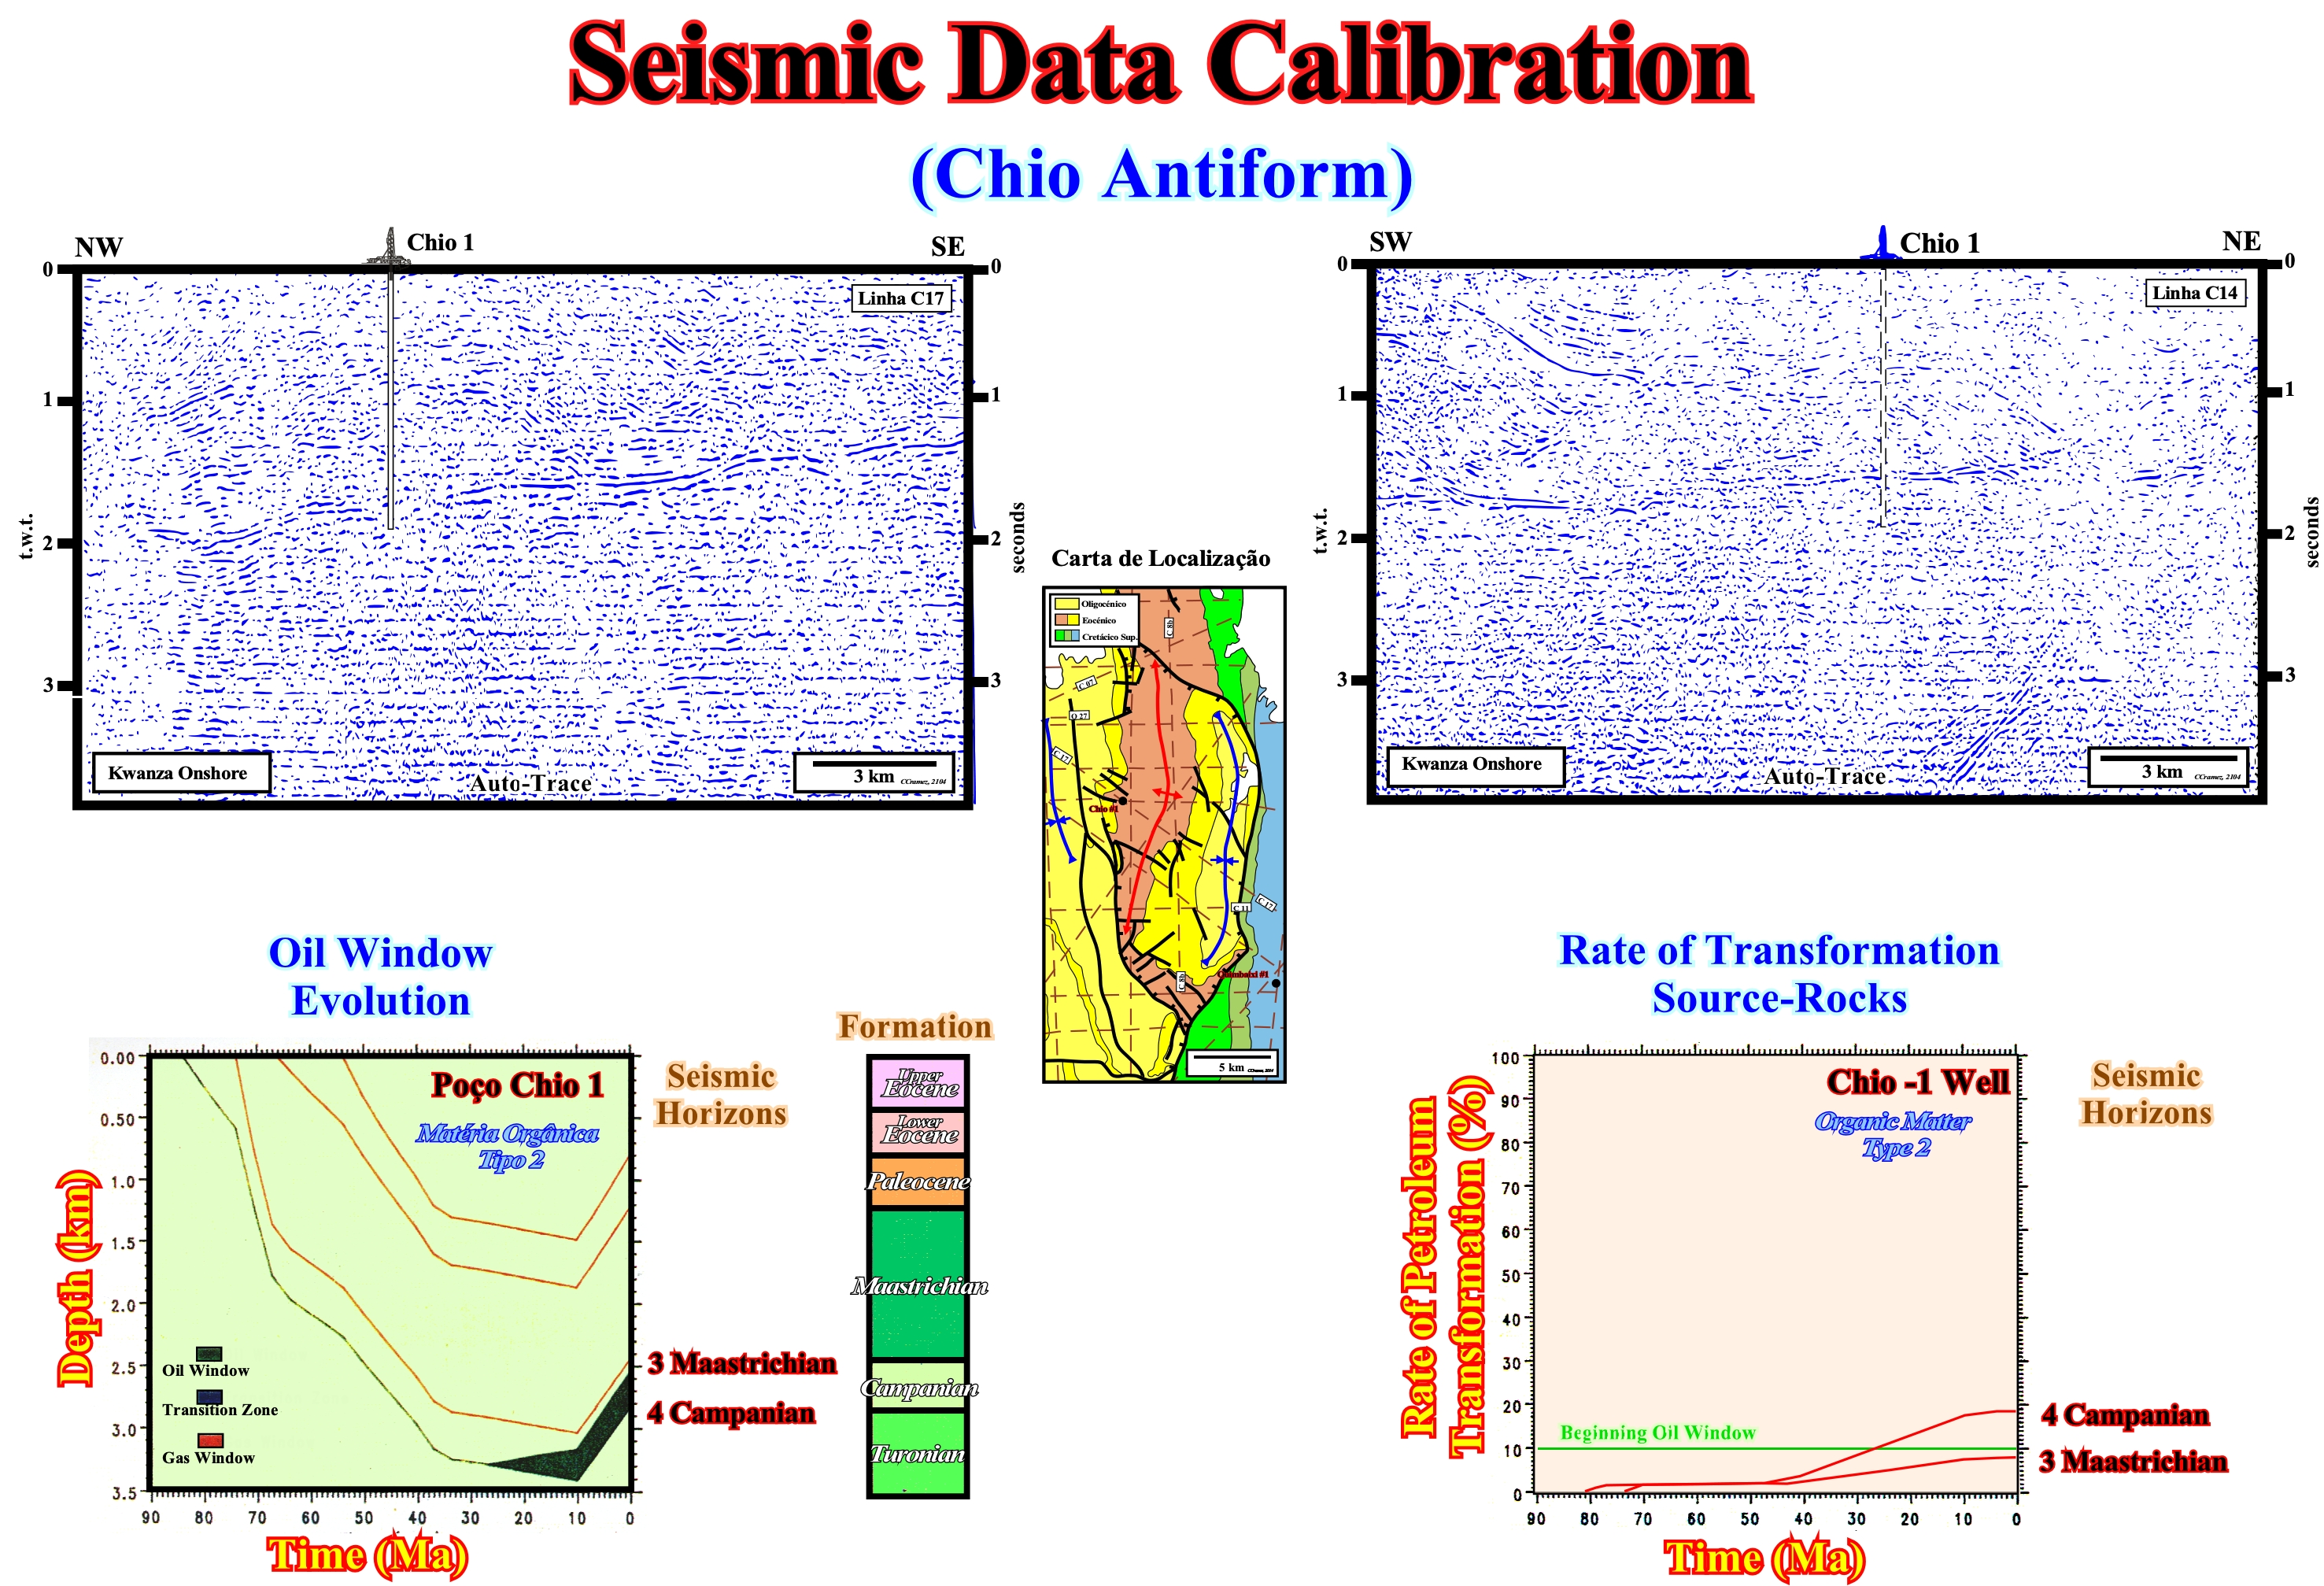
Figure 043- In the Kwanza geographic basin (onshore)there a lot of antiform structures. This type of structure, bell-shaped, result from lengthened of sediments induced by an extensional tectonic regime (σ1 vertical) created by the movements of salt horizon and gravity landslides. In association with the normal faults responsible for the lengthened of sediments, a large number of non-structural traps were formed, particularly, morphological traps by juxtaposition. However, as can be seen on the Canvas auto-trace of the seismic line illustrated herein, the quality of old seismic data do not allow the mapping of most normal faults, which throw is, often, under seismic resolution. Almost all exploration wells were, wrongly, located in the apex of antiforms, since they were considered to be structural traps. All this means that none of the numerous morphological traps juxtaposition was properly tested, which, obviously, increases significantly the remaining petroleum potential of suprasalt sediments. On the other hand, the calibration of seismic horizons is very difficult, since they difficult to pick. In contrast, the cuttings and drill cores, particularly, in Chio-1 well, put in evidence the presence of sedimentary intervals (Campanian and Maastrichtian) with source-rock characteristics (organic matter type 2) and reservoir-rocks (sandstone). Moreover, as can be seen, the diagrams of the rate of transformation of the source-rocks and the evolution of the oil window suggest that the organic matter of the Maastrichtian potential source-rocks never reached the oil window and the organic matter from the potential Campanian source-rocks reached the oil window in Early Miocene (± 20-25 Ma). It is, also, important to note that the diagram of the evolution of oil window shows, in the area of Chio-1, an uplift of the basin of about 1000 meters.
7) Quiçama Wells (Angola onshore)
In Quiçama area, Quiçama-2 well (also called Muxima-2) revealed four organic-rich intervals with organic matter type 2 (Confucian, Cenomanian, Upper Aptian and Barremian) as illustrated in figure 044.
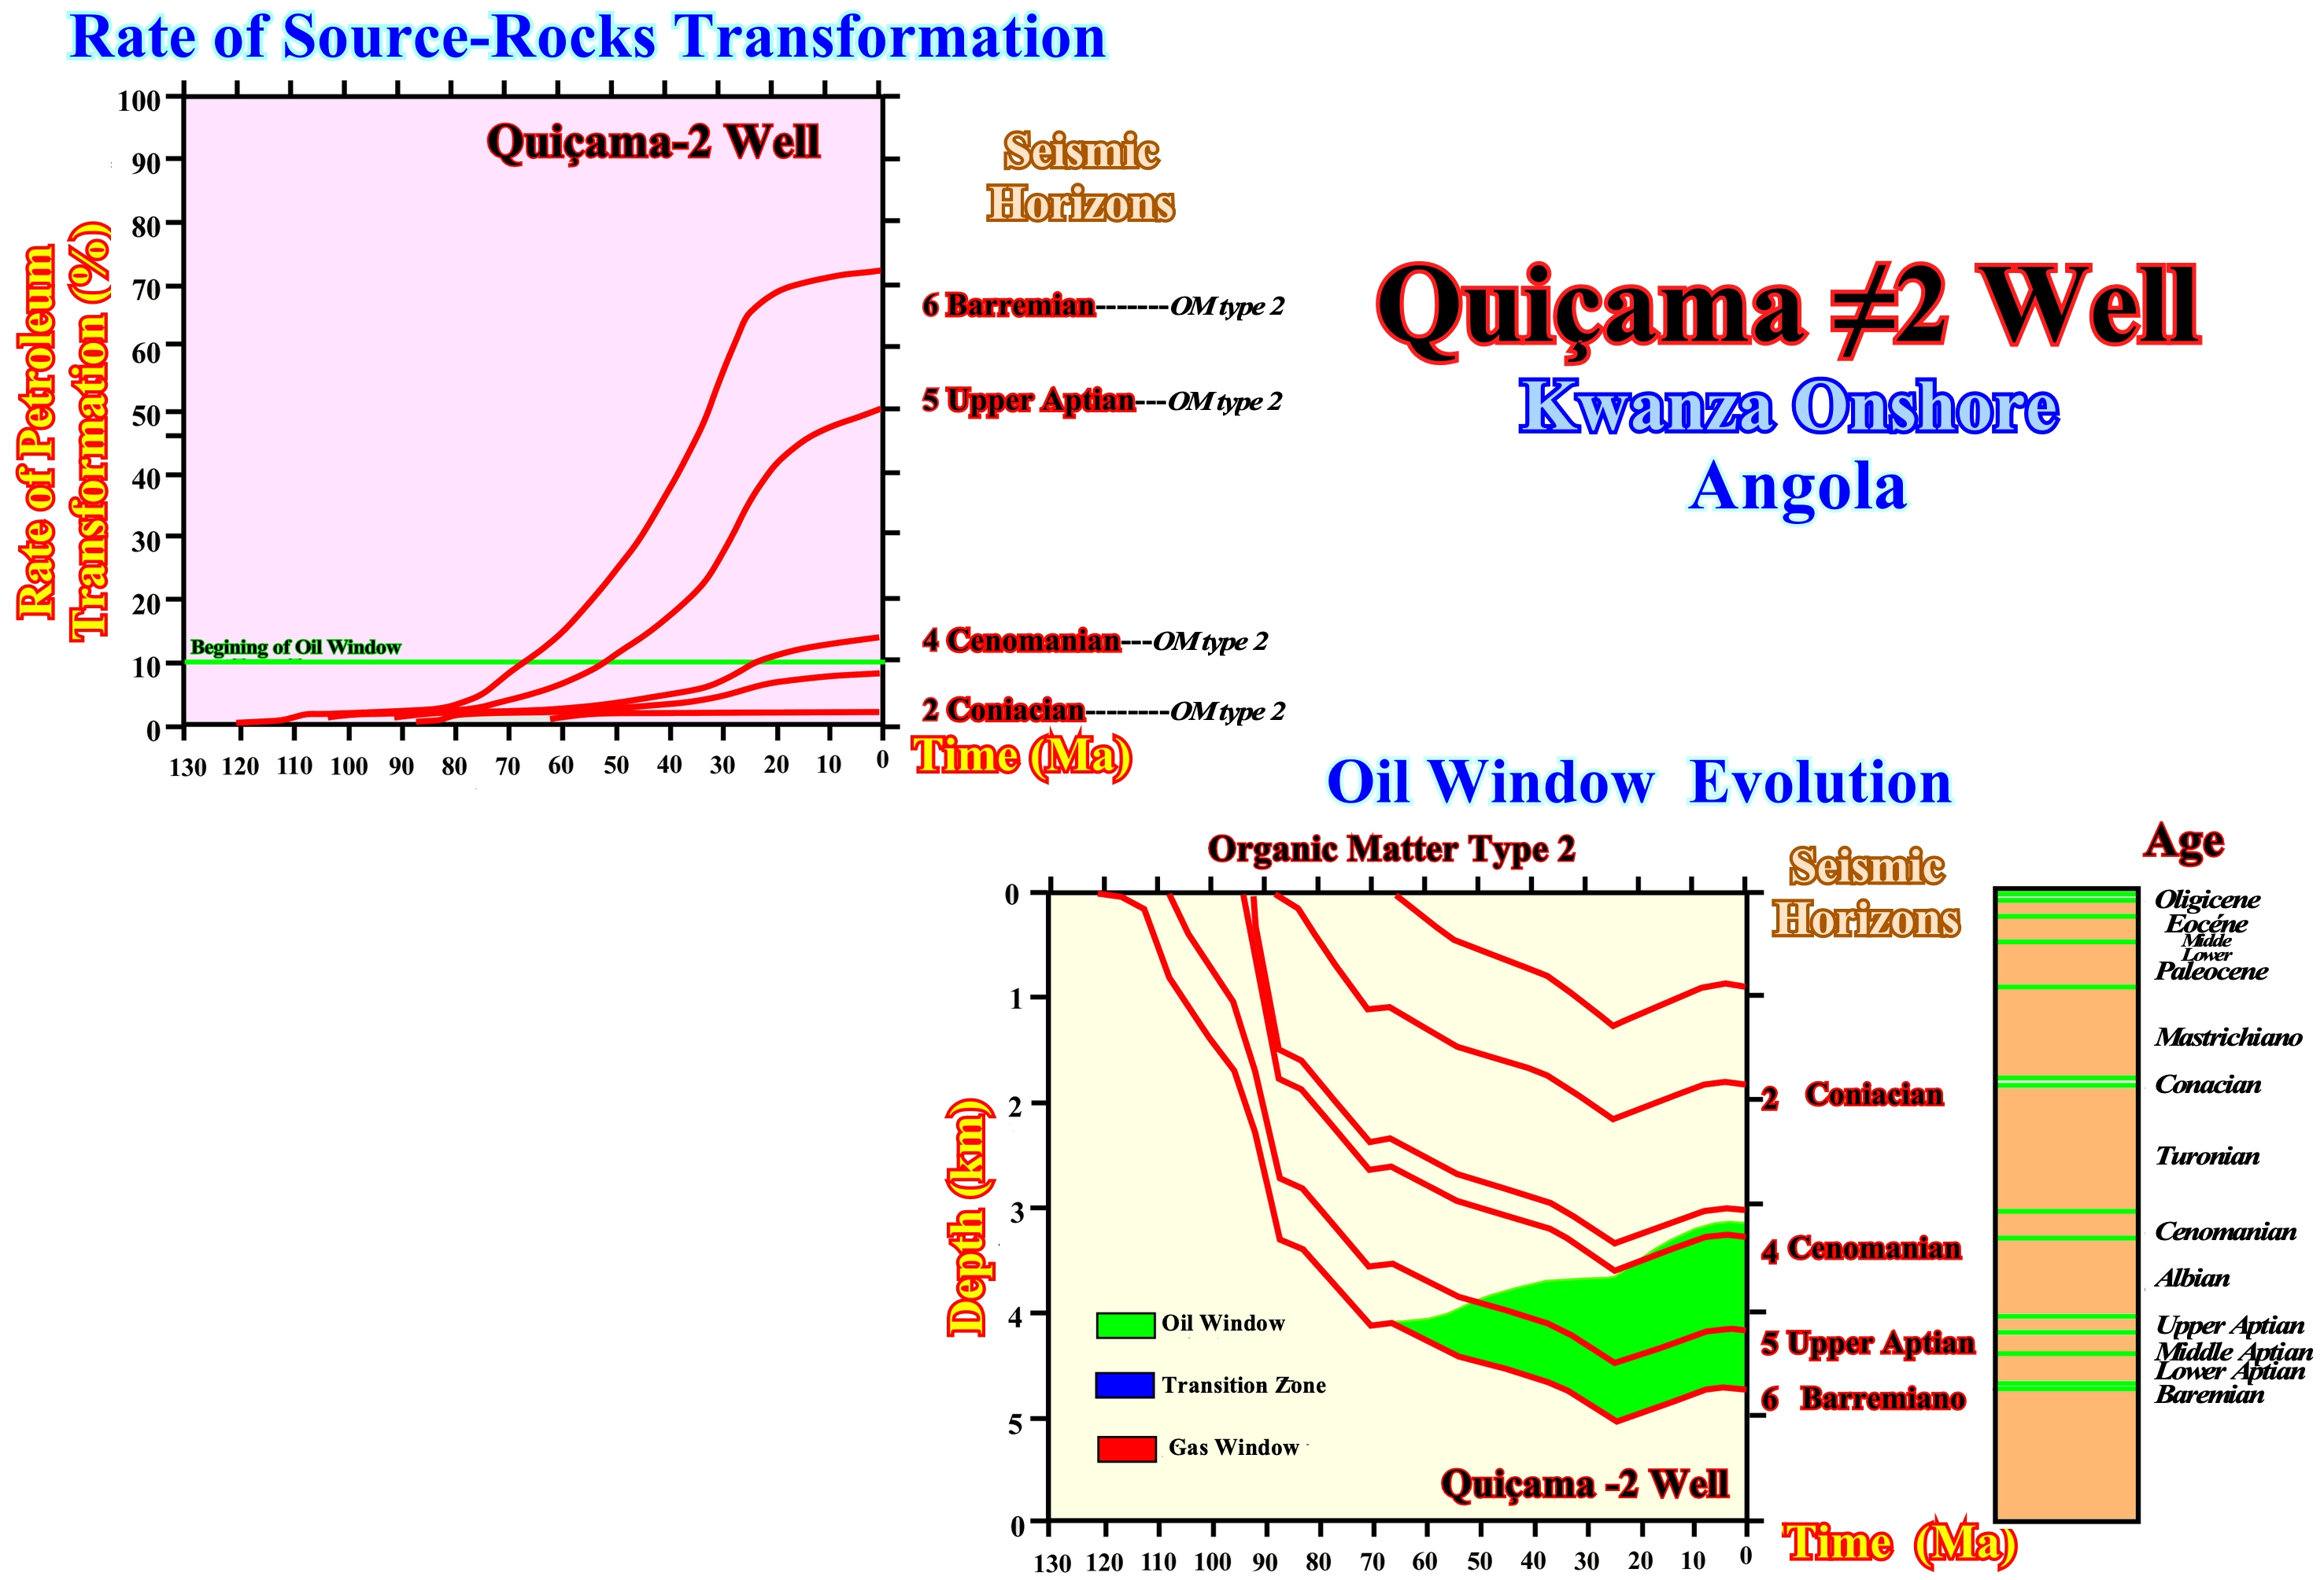
Figure 044- Quiçama-2 well revealed four organic-rich intervals with organic matter type 2 (Confucian, Cenomanian, Upper Aptian and Barremian). Only the Barremian organic matter Barremian, Upper Aptian and Cenomanian reached the oil window, but at different times. The Cenomanian source-rock reached the oil window in Early Miocene (± 20-25 Ma), while Upper Aptian reached maturation about ± 50-55 Ma and the Barremian source-rock about ± 70 Ma. In this area the Late Tertiary uplift of the basin appears to have started earlier than in the Chio area, i.e., ± 20-25 against ± 10 Ma. Furthermore, the amplitude of the uplifting appears to be less important.