
Whenever a small anomaly exists at the top of the salt (a mound, for instance), and the overburden is relatively thick, the salt flows simultaneous up all the flanks toward the crest of the anomaly forming a small dome. Irregularities in the salt-overburden interface produce divergent slopes on the surface of the salt, which creates an anomaly. Then, anomalies will be formed by chain reaction, and the mechanism remains the same even if the irregularities are of small amplitude. Actually, the smaller they are the longer it takes for domes to develop).
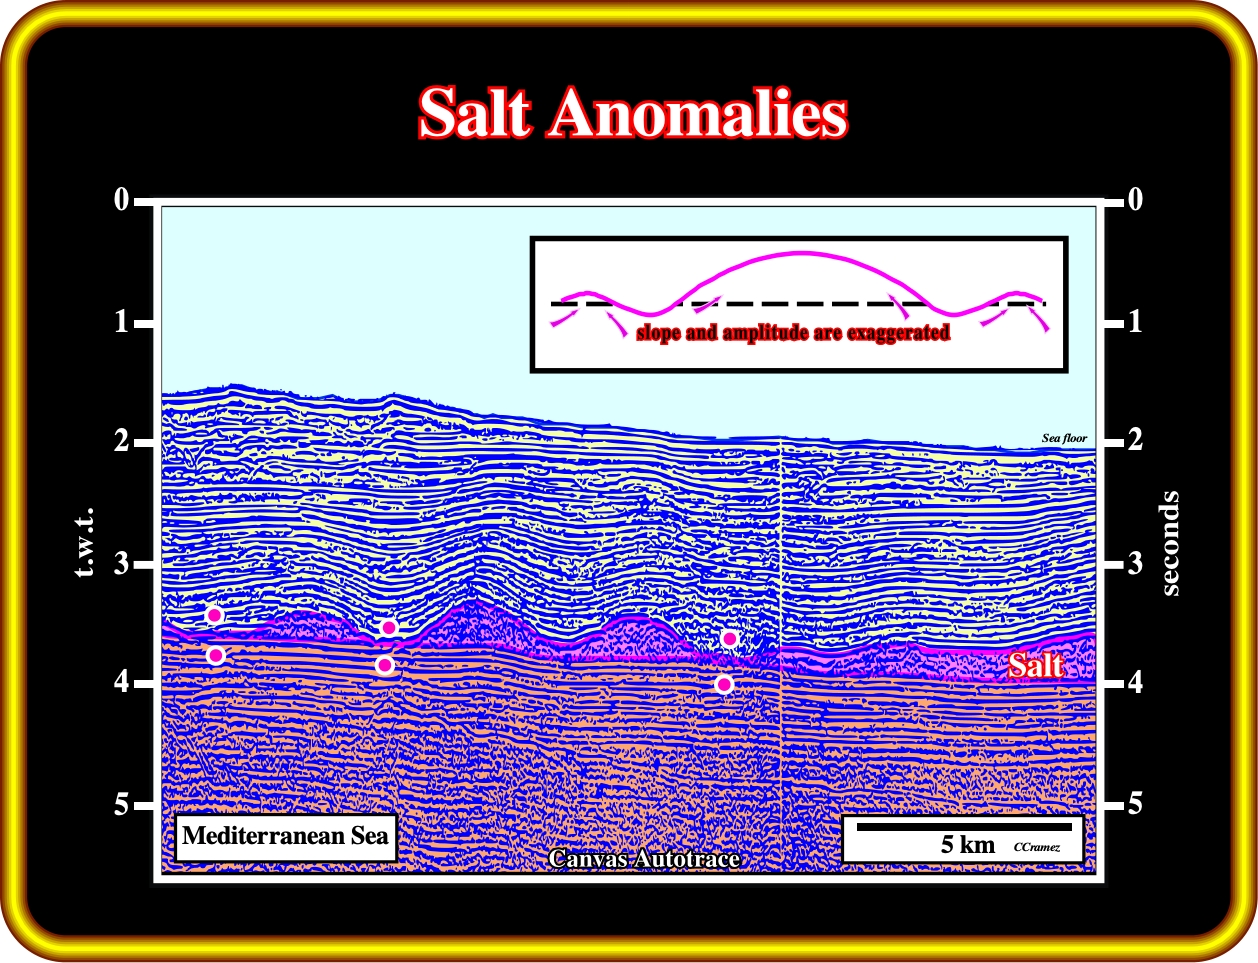
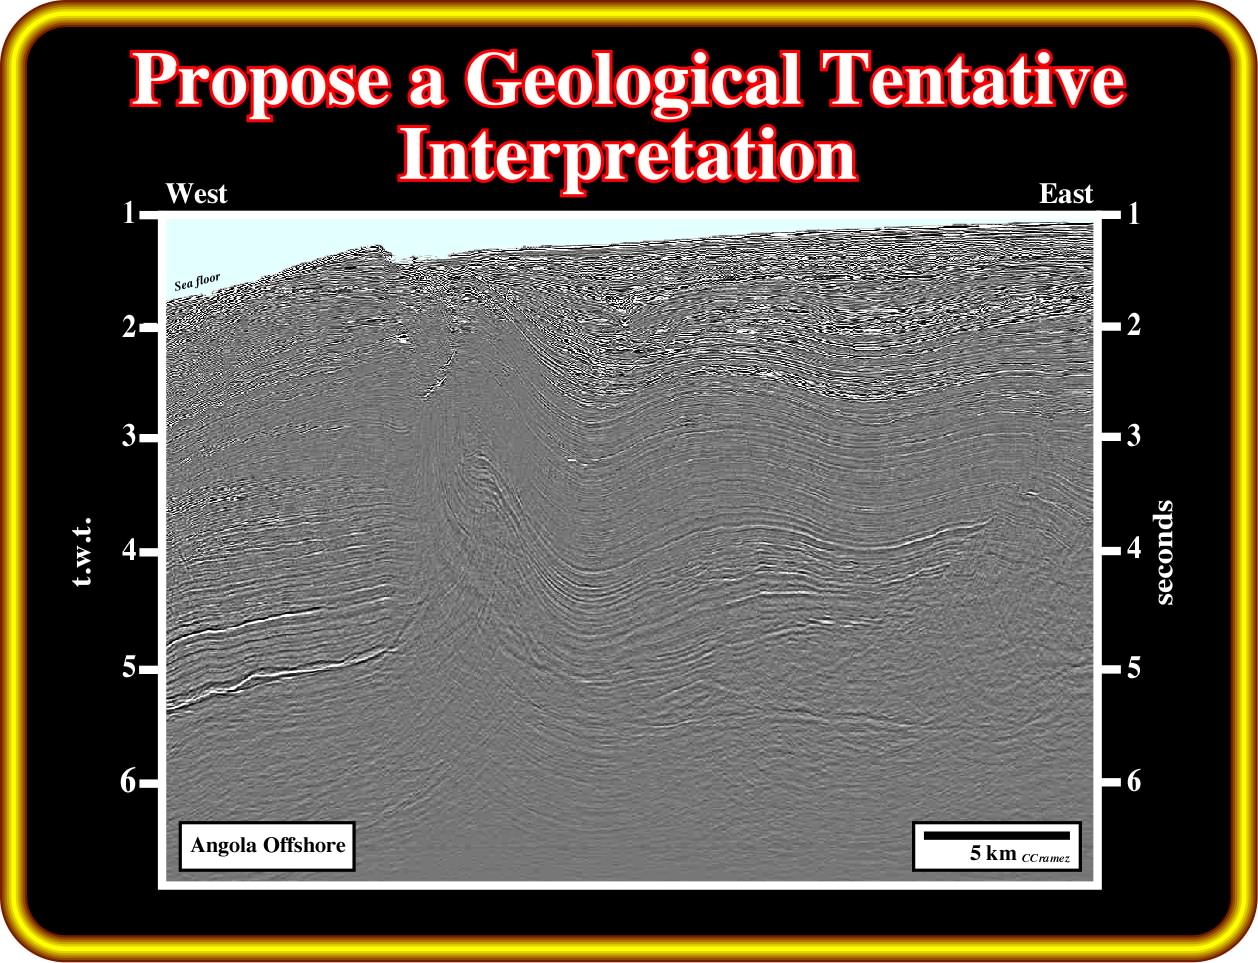
On the left part of the line, Messinian salt anomalies (undulations) are easily recognized. They have a more or less similar amplitude, which seems to be big enough to break, by traction, the bottom of the overburden, particularly when its facies is compact sandstones or carbonates..
If the sedimentary section deposited between, and above, the salt anomalies is thick enough, the average density of the sediments forming the overburden may becomes greater that the salt density (around 2.15 - 2.17). The weight of the overburden forces the salt to migrate towards the top of the anomalies because the thickness of the overburden decreases from the flanks towards the top. The force, obliging the salt to migrate upward, decreases from the flanks to the top. In addition, the thicker the overburden, the denser it is and the greater is the force obliging the salt to migrate. The force acting upon the salt is greater at the deepest part of the salt-overburden interface. Therefore, it is logical that the maximum sinking of the sediments takes place on the dome’s flanks where the salt has been evacuated.
The two sketches illustrated below, depict the withdrawal of the flanks of a salt dome.
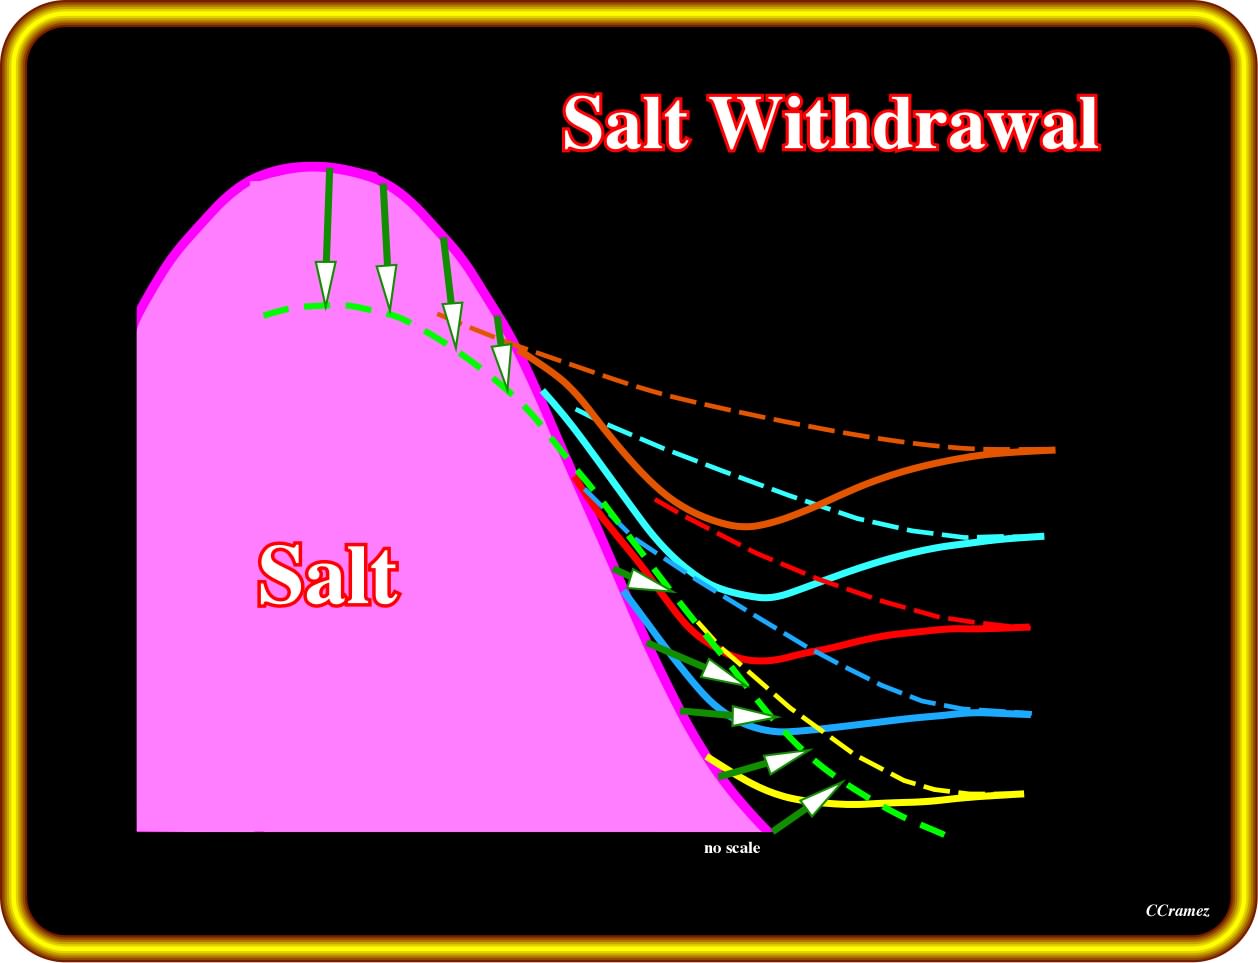
Taking the initial limit of the salt as the dotted green marker, it is easy to recognize that as the flanks of the dome withdrawal, the apex of the dome is uplifted. Such a transfer of salt increases locally the space available for sediments and created local depocenters, as depicted by the collapse of the other coloured markers. The depocenters or rim synclines will be progressively displaced toward the flanks of the dome as sketched next.
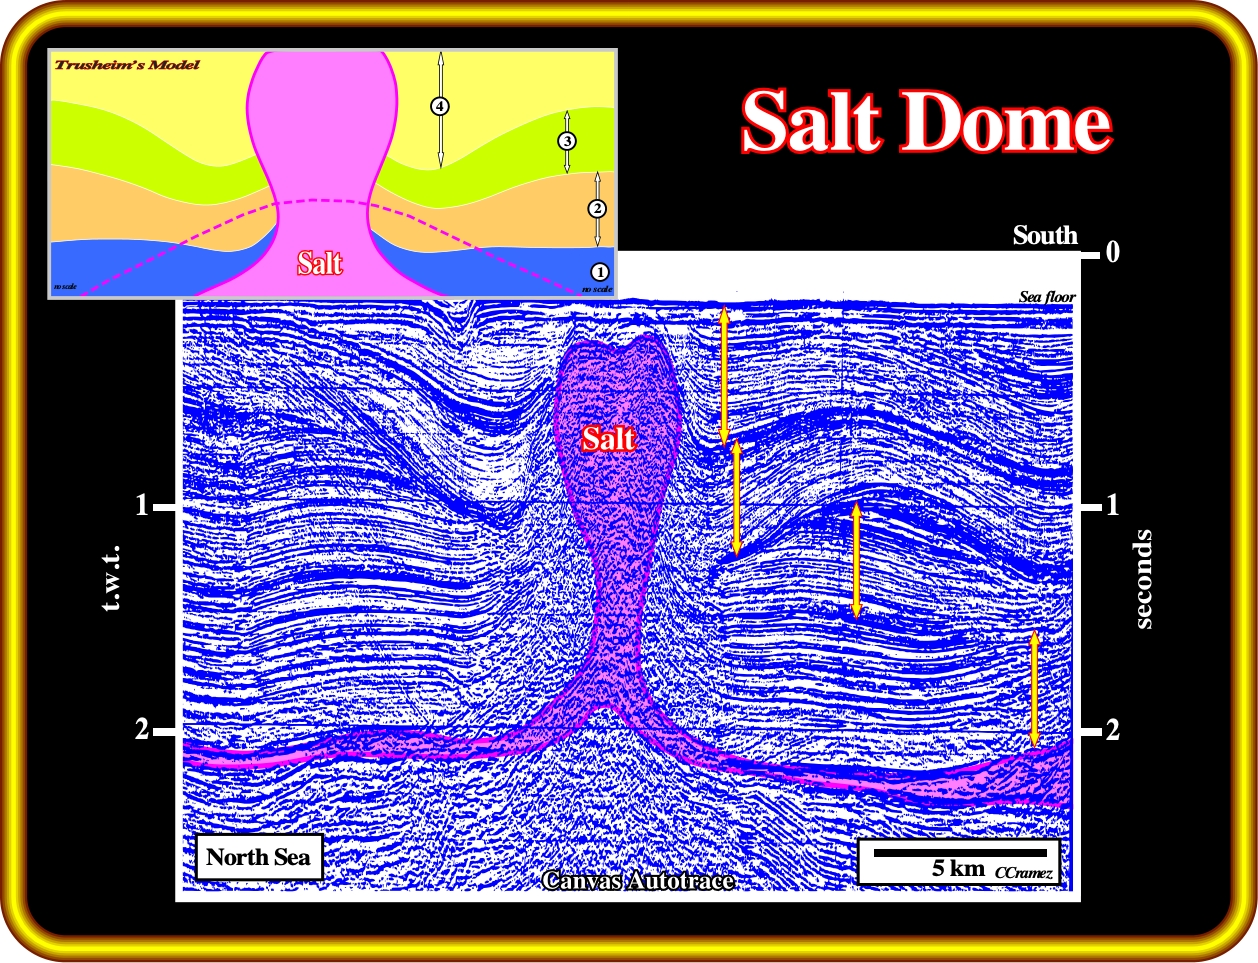
In Trusheim’s model, the successive lateral withdrawal of the flanks of the former salt intumescence (mound), which is underlined by the dashed violet line, can be recognized by the displacement of the depocenters, located each side of the salt dome. The depocenters were induced by the compensatory subsidence created by the salt flowage as depicted in the last plate. The final result of the withdrawal of flanks of a pristine salt mound and the coeval vertical salt flowage to form a dome are here well pictured. The lateral displacement of the successive depocenters (yellow arrows) is easily recognized, in spite of the erosional surfaces between them. The asymmetry of the depocenters suggests a different evolution of the flanks of the former salt anomaly. The reflection free area below top of the dome requires a hypothetical-deductive approach (Theory precedes Observation). Indeed, in Geology there are not un-interpreted observations. All seismic interpretations are theory impregnated.
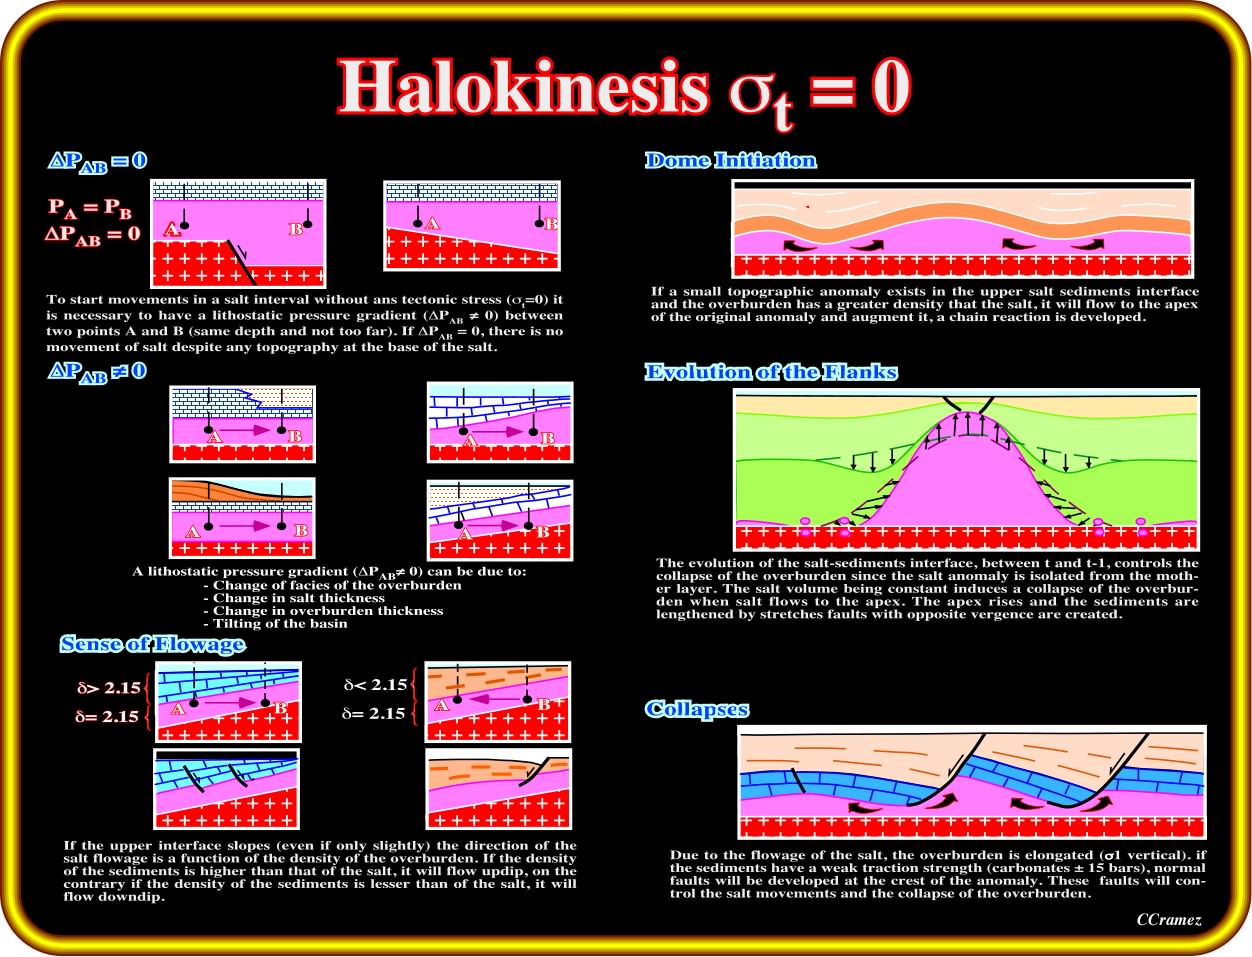
This plate summarize the sense of salt flowage, the dome initiation, the evolution of the dome's flanks as well collapses of the overburden.
In the overburden, the geostatic pressure increases with depth and the average density of the sedimentary layers. Taking into account the wildcat as reference, the geostatic pressure (in blue) shows in depth three sharp breaks. They are associated with the stratigraphic boundaries, the last of which is associated with the interface between the autochthonous salt and the overburden.

This plate, taken from Goguel, illustrates the evolution in depth of the vertical pressure in the wildcat and in the salt dome are quite different as illustrated in the cross plot Depth vs Pvertical. As one can see, at a given depth, the vertical pressure in the dome is smaller that the vertical pressure of the overburden.
Similarly, the geostatic pressure calculated along a hypothetical well through the salt dome, is illustrated in red above. As depicted, two sharp breaks are visible. The first is associated with the cap rock. The second corresponds to salt. In the salt, the geostatic pressure keeps a constant slope, since the density of the salt does change with depth. Two profiles of the geostatic pressure (overburden and salt) illustrated on the depth/pressure diagram, define an inversion point. Above this point, the density of the salt is higher than the average density of the overburden. Below the inversion point, the density of the sediments is higher than the salt. In other words, one can say:
(i) Above the inversion point, the lateral pressure the salt exerts against the sediments is not balanced by the lateral pressure the sediments exert against the salt ;
(ii) Below the inversion point, the lateral pressure that the sediments exert against the salt is balanced by the lateral pressure that the sediments exert against the salt ;
Additionally, one can say, that a salt dome with vertical sides, as the one suggested in the above plate, as stated previously, is unlikely. Such geometry represents a mechanical instability due to the presence of an inversion density point.
The difference between the geostatic pressure of the overburden and that of a theoretical salt dome (P) growing from an autochthonous mother layer, as illustrated in the plate below, can be easily calculated. Goguel (1983) knowing:
a) The average density of the overburden (d) ;
b) The density of the salt (d’) ;
c) The height of the dome (H) ;
d) The height of the topographic anomaly induced by the salt dome (h) ;
calculated ΔP using the following formula:
ΔAB = H (d-d’) - hd
The difference of pressure ΔP is one of the driving forces that induce the salt to flow toward the dome until it reaches a pseudo equilibrium state with the overburden.
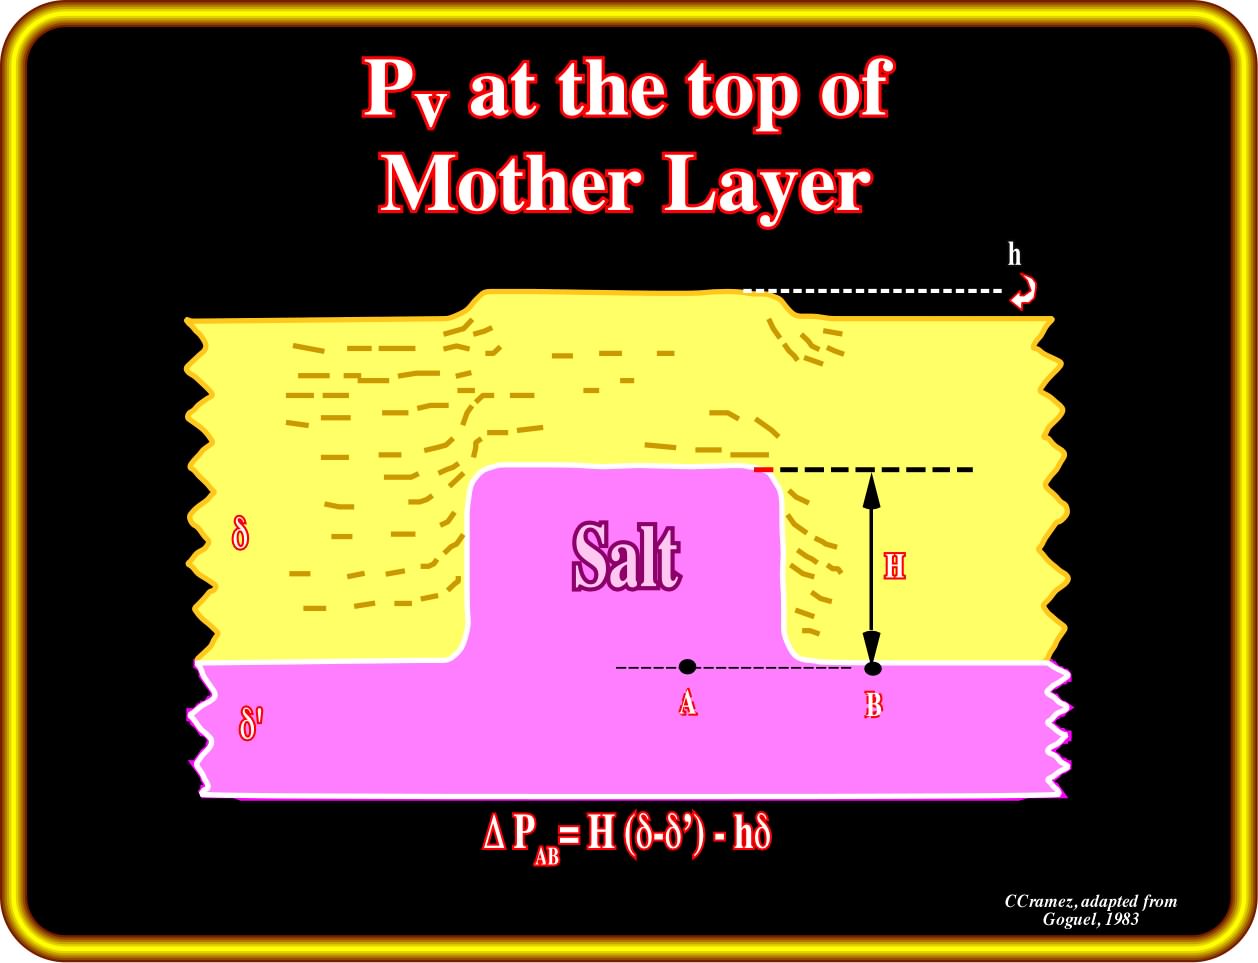
Goguel calculated the vertical pressure at the bottom of a dome (A, top mother layer) and bottom of the overburden (B) and then ΔPAB=H(∂-∂’)-h∂. Theoretically, the topographic (or bathymetric) anomaly above the salt dome compensates the ΔP between (A) and (B).
Seismic examples corroborate the hypothesis that vertical flanks are unlikely since they correspond to an unstable geological situation:
(i) Above the inversion point, the salt flows laterally (toward the sediments), creating overhang structures ;
(ii) Below the inversion point, as the lateral pressure of the sediments is not balanced by the lateral pressure induced by the salt, the salt flows vertically.
Such a flowage can disconnect the diapir from the underlying mother layer and create a salt drop structure, which requires also a contraction or collapse of the salt stem, by pressure of the sediments and not just by vertical flow.
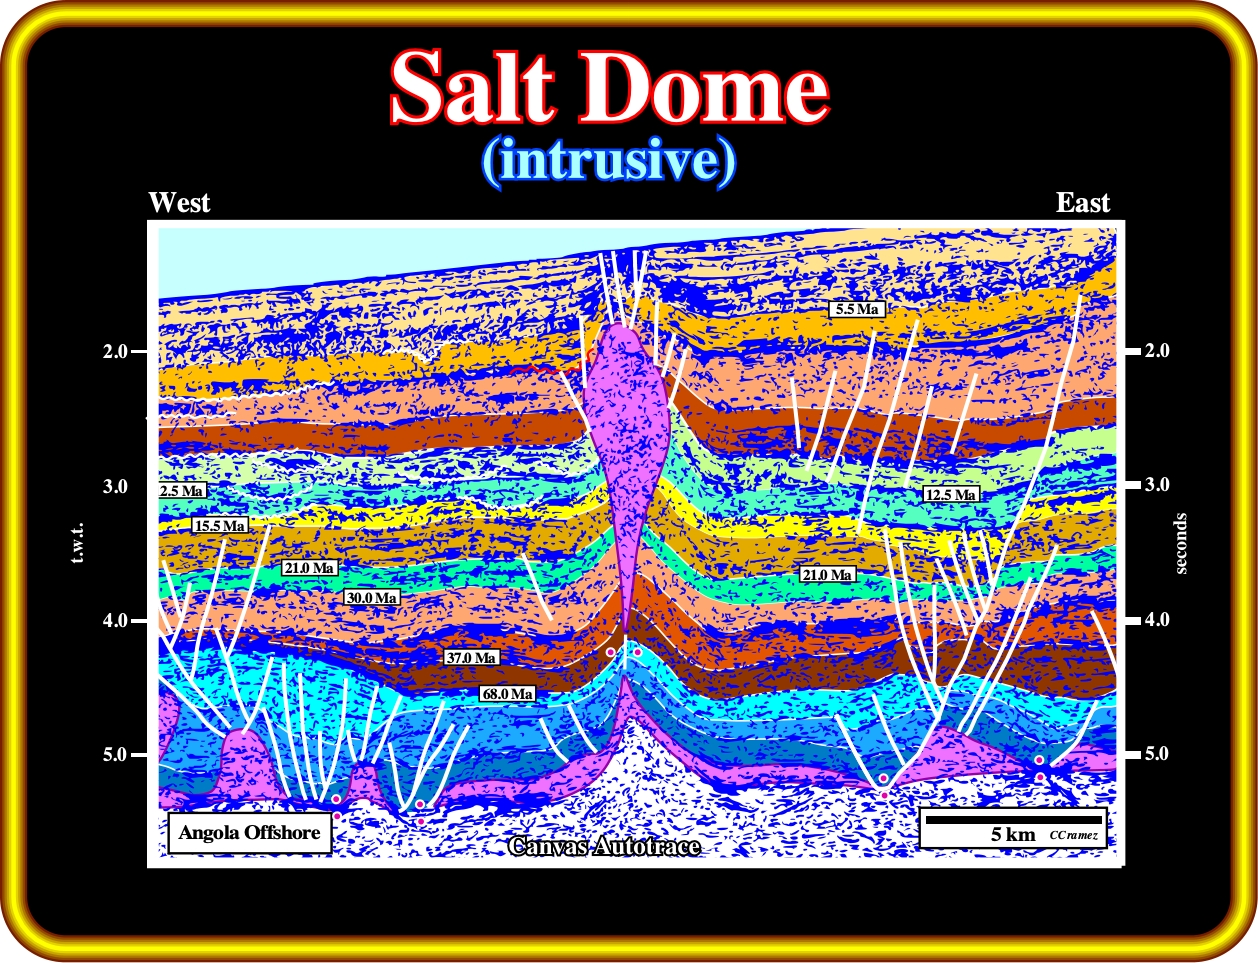
In this geological tentative interpretation, vertical secondary salt weld underline the disconnection of the salt dome from the salt mother layer. In fact, as said previously, as the density of the salt is more or less constant with depth, below the inversion point the pressure of the sediments against the salt is not balanced by the pressure of the salt against de sediments. Consequently, the salt has the tendency to flow upward creating, often a salt drop structure. Above the inversion point, the salt is denser than the sediments and so, the salt flows laterally.
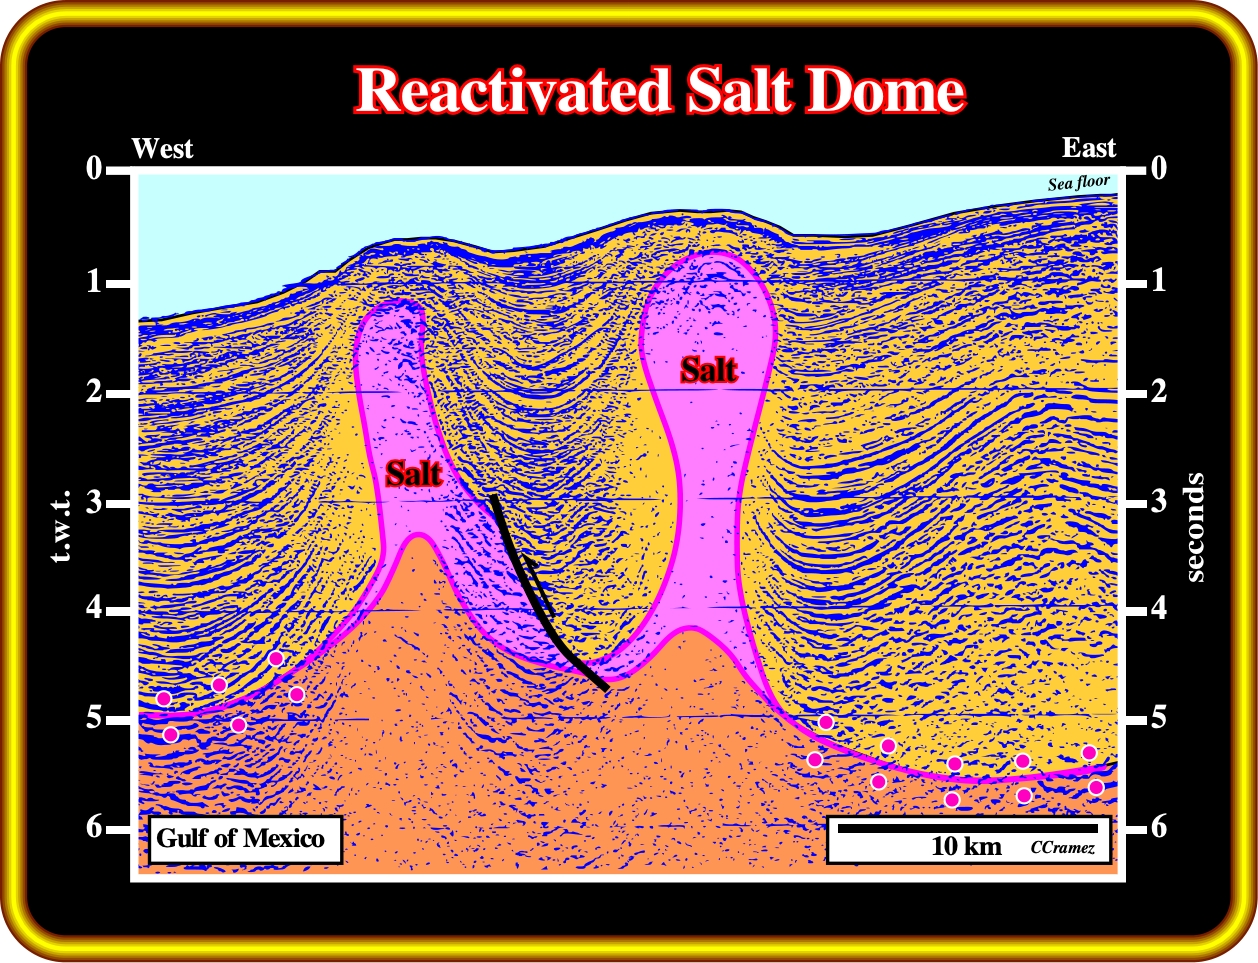
These salt domes are related with an allochthonous salt nappe, which at present time is mainly represented by an horizontal secondary salt weld. The right rim syncline of the left dome (on the right) suggests that the right dome is slightly younger. Indeed, it looks that there is any rim syncline, or depocentre, in the left end of the line. Notice that a late local compressional tectonic regime seems to have reactivated the salt domes. An evident angular unconformity is visible in the upper part of the line.
Salt domes can be intrusive or extrusive. Intrusive salt domes never outcrop. They do not reach the surface. Extrusive salt domes reach the surface. They induce an apparent diapirism as sedimentation progresses.
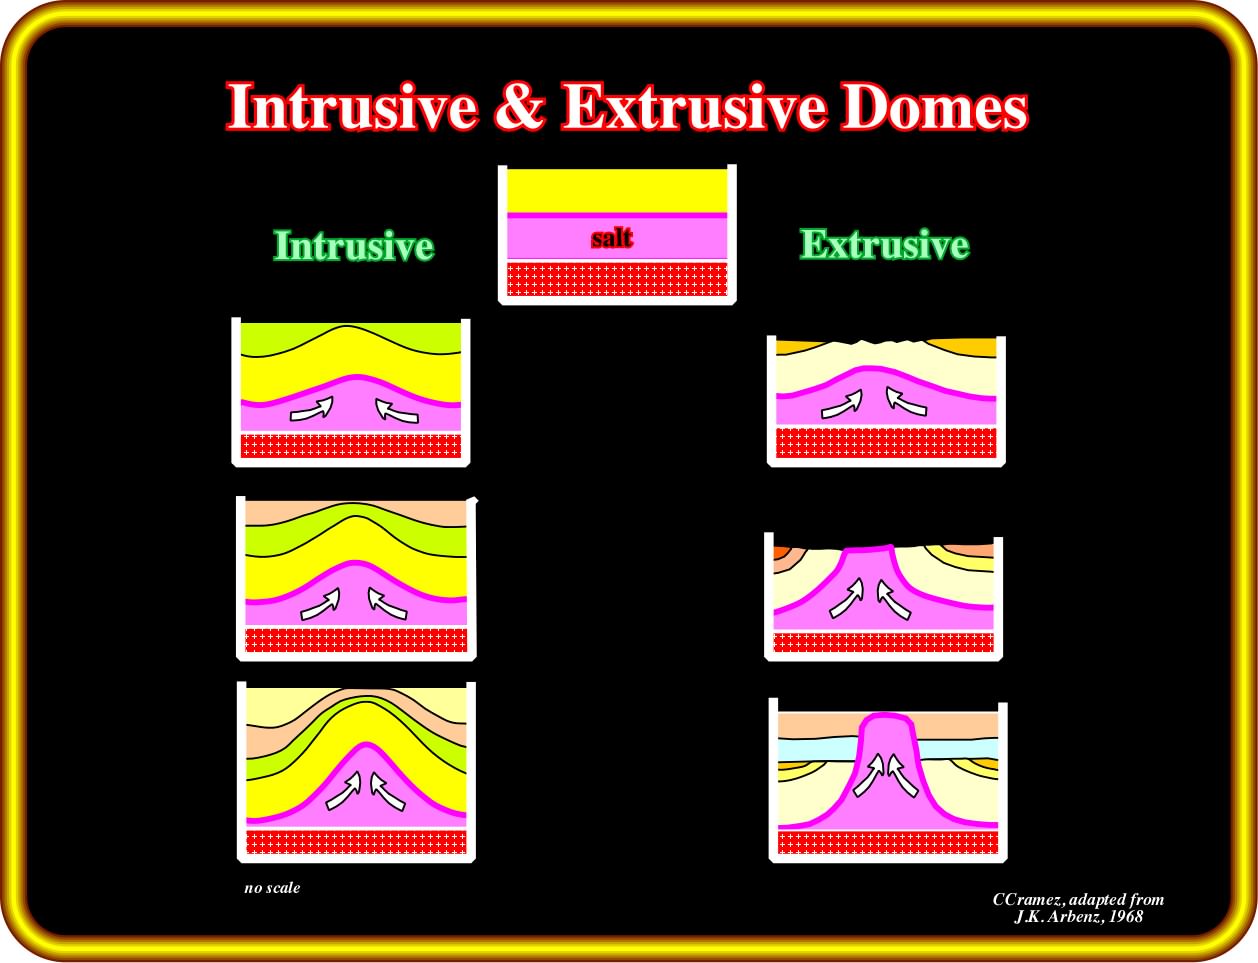
Intrusive salt domes buckle the sediments of the overburden. Deformation decreases upward. Extrusive domes do not deform all overburden. Overburden deformation stops once the dome reaches the surface. Then, when the dome becomes disconnected from the mother salt layer, upward growing of the dome stops. However, lateral salt displacements are possible.
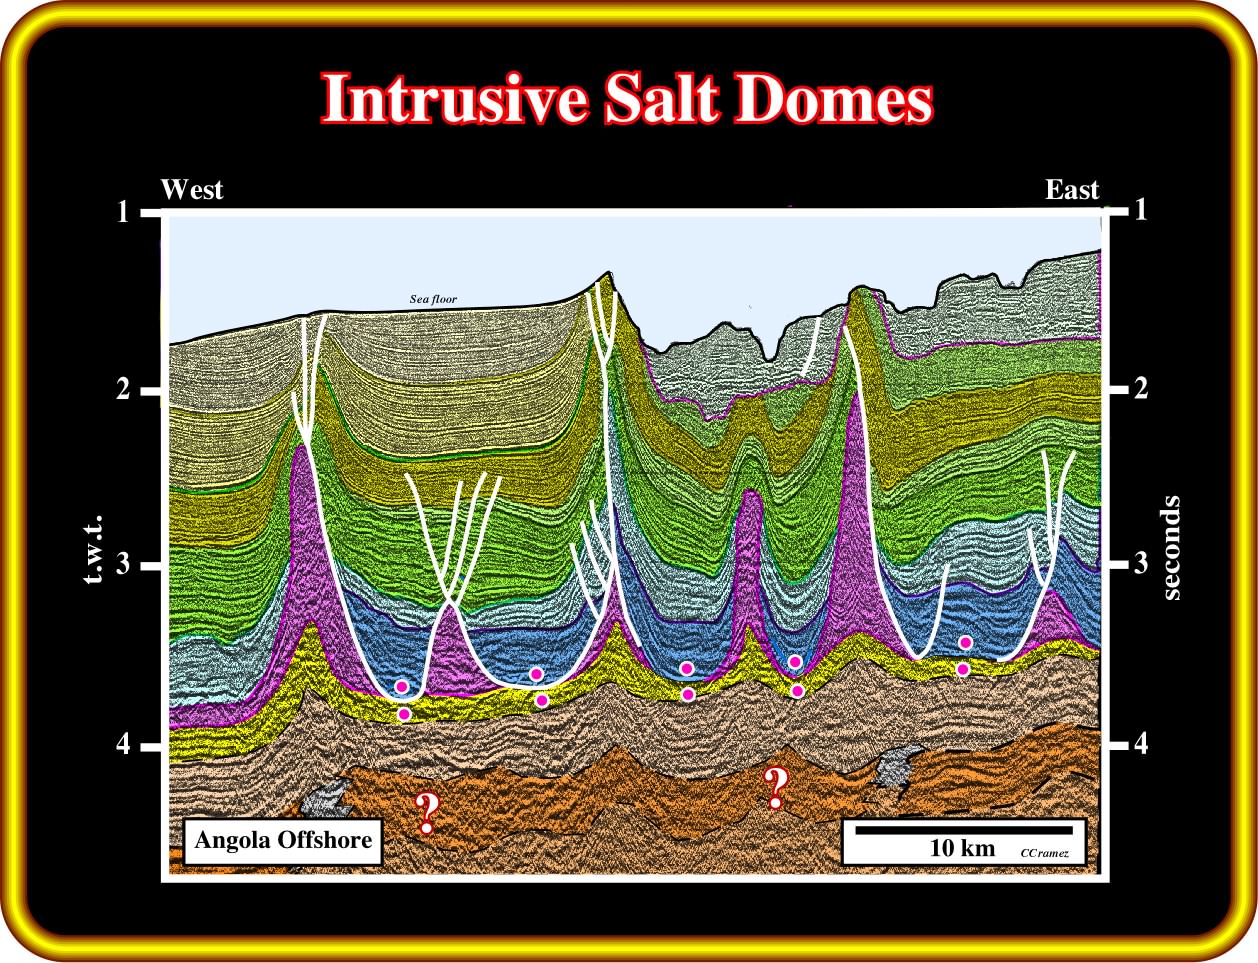
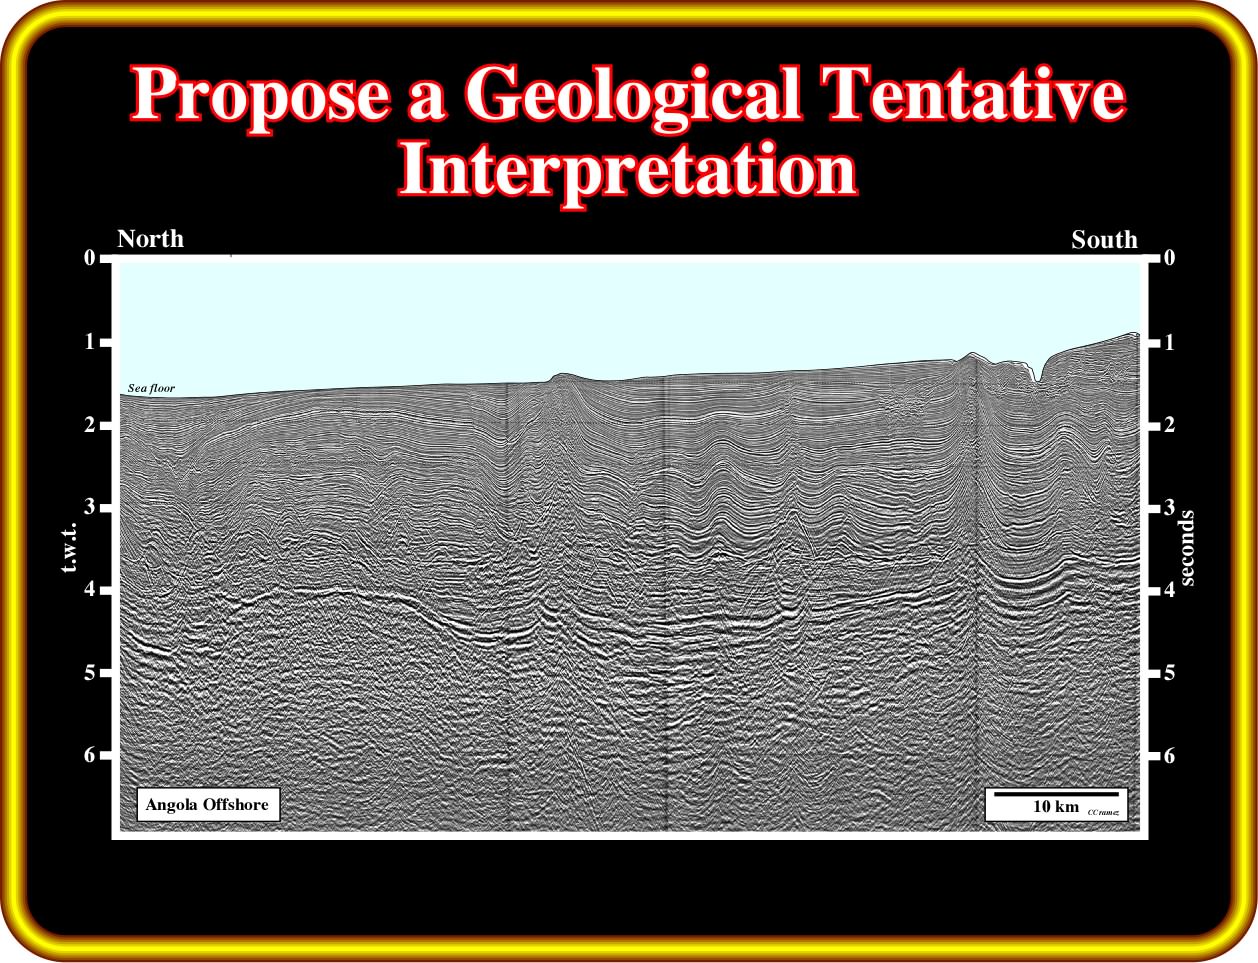
The tectonic disharmony between the infra-salt strata and the cover strongly suggests that halokinesis is here dominant. Some of diapirs seem to be slightly squeezed. Notice, the distance between the salt structures is more or less constant (Rayleigh-Taylor Instability, that is to say, the hypothesis that a dense fluid overburden having negligible yield strength sinks into a less dense fluid salt layer, displacing it upward ; indeed, a layer of viscous fluid of uniform density overlying a compositionally less-dense layer is unstable ; small perturbations in the horizontal interface become amplified at a rate, represented by an eigenvalue, i.e., the special value variable parameter for which the solution of an equation is nontrivial, that depends on the thickness, density, and viscosity of every layer, size of initial perturbation, and time elapse.).
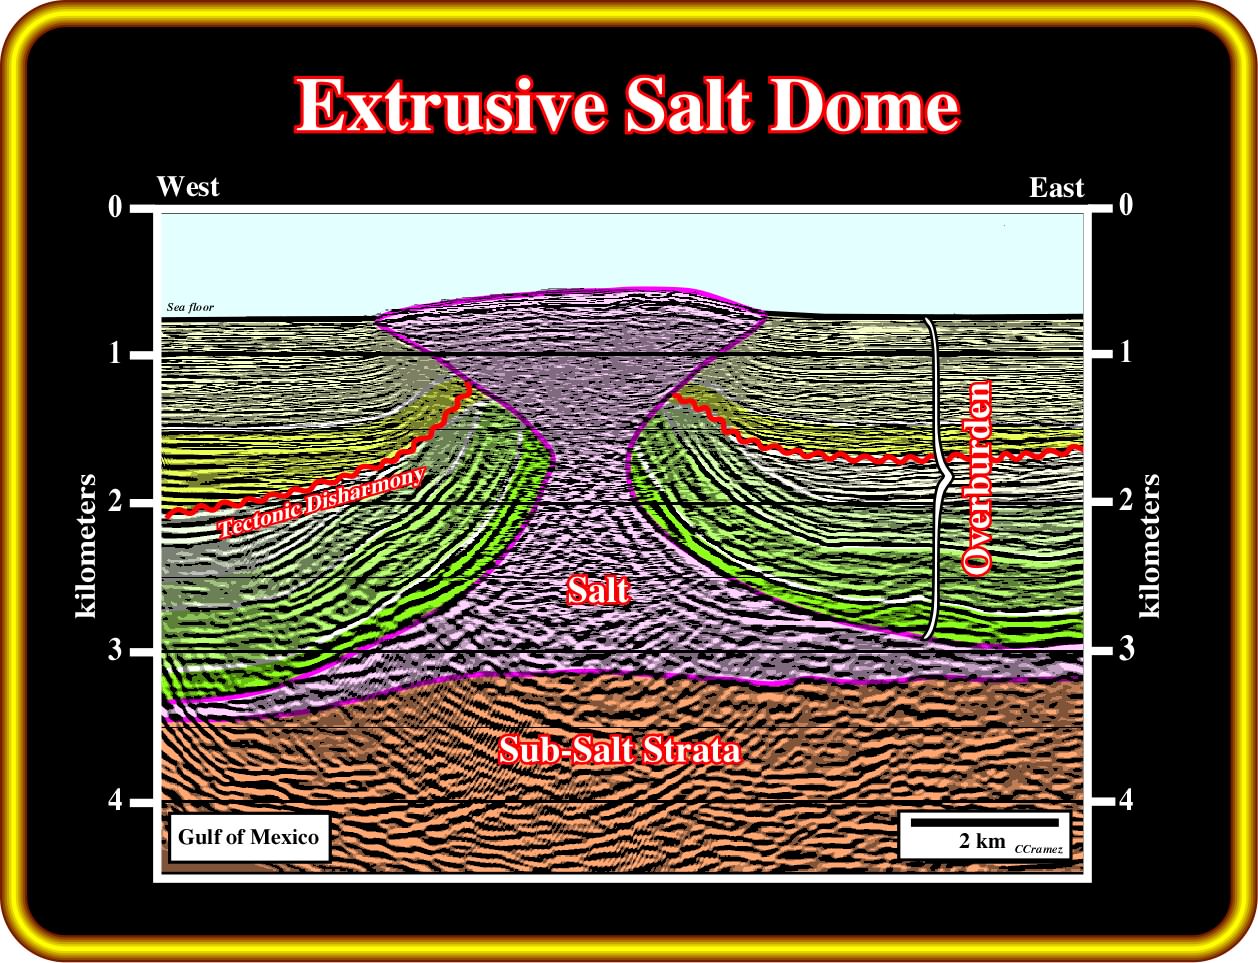
The tectonic disharmony emphasizing the outcropping of the salt dome, was significantly deformed. Such geometry suggests (i) a passive diapirism and (ii) a contraction during the late phase of the salt movement. Indeed, a passive diapirism can be proposed since the beginning of overburden deposition as illustrated next
The extrusive salt structure illustrated in the previous plate, can be explained assuming an early passive diapirism. The salt reached the surface since the onset of the overburden deposition. A first compressive tectonic phase exaggerated the overburden deformation creating an angular unconformity between the interval 4 and 5. A second compressive tectonic phase was responsible from the deformation of the angular unconformity. Summing up : Top 1, initiation by differential sedimentary loading or extension ; Top 3, Diapirism ; Top 4, diapirism and contraction (?), salt dome reaches surface (glacier possible) ; Top 5, Passive diapirism ; Top 6, Passive diapirism and contraction.
Trusheim’s model was advanced to explain salt structures observed in Central Graben (North Sea). In this model there is no significant extension of the overburden (see plate below). The salt flows mainly by density contrast and differential pressure.
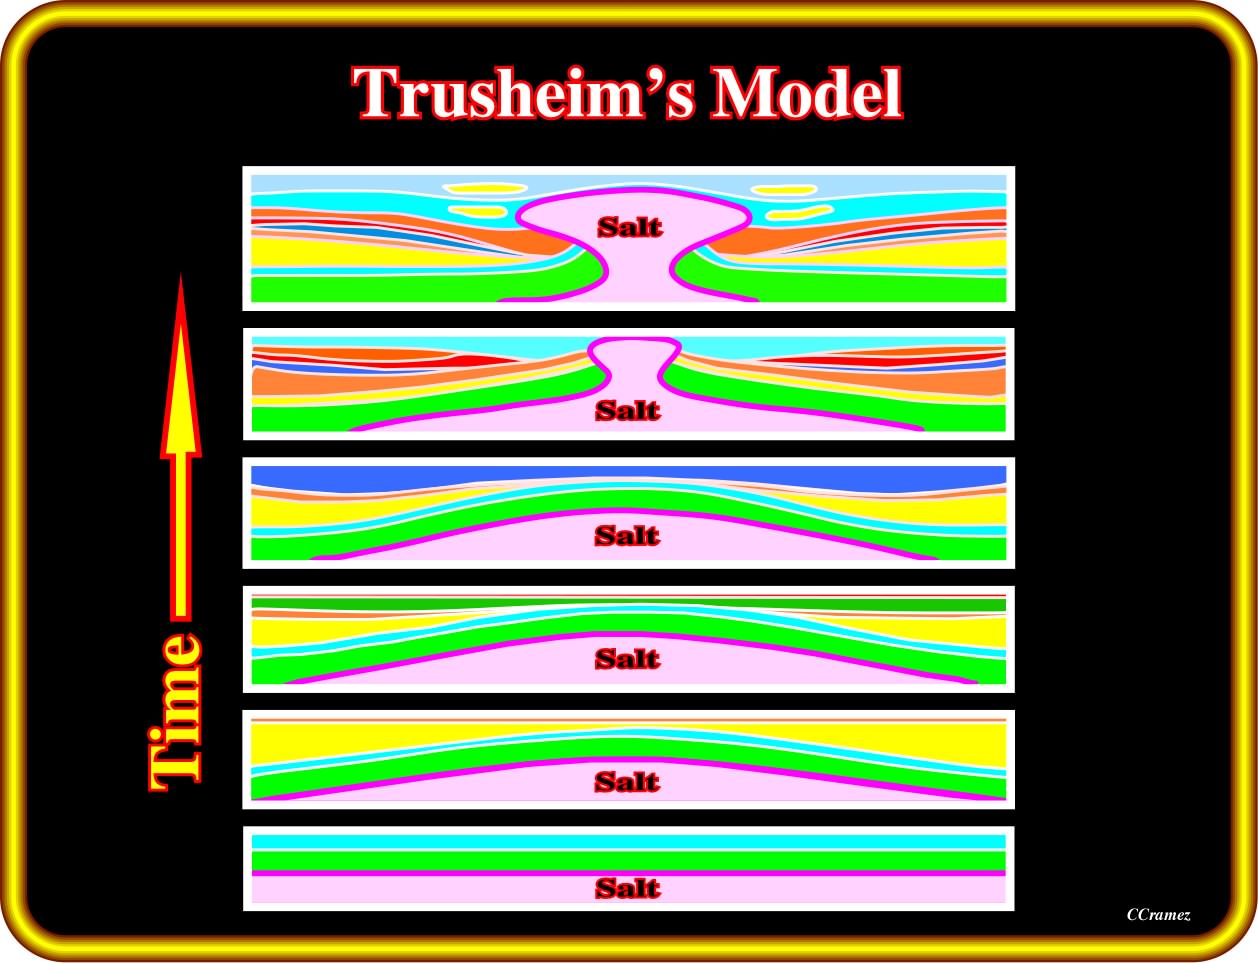
Trusheim’s geological model explains certain salt structures without significant lengthening (extension) of the overburden. Halokinesis is the main mechanism. It explains not only the salt structures but the overburden depocentre as well.
In Trusheim’s model, three main geological stages can be recognised:
a) Mound Stage: the salt flowage creates a salt mound ;
b) Salt Dome Stage; the upward salt flowage creates a salt dome and adjacent rim synclines (overburden depocenters) ;
c) Post-Dome Stage; the upper part of the salt dome flows laterally creating an overhang, enhancing the turtle-back structures.
The seismic line illustrated in the next figure is an example of salt structures, which can easily be explained by the Trusheim’s model. Indeed, the tectonic disharmony, at the bottom of the salt layer, as well as prekinematic and synkinematic sedimentary intervals of the overburden are recognised without difficulty. Rim synclines are located around the salt structures, where the compensatory subsidence is higher, within the synkinematic overburden intervals.
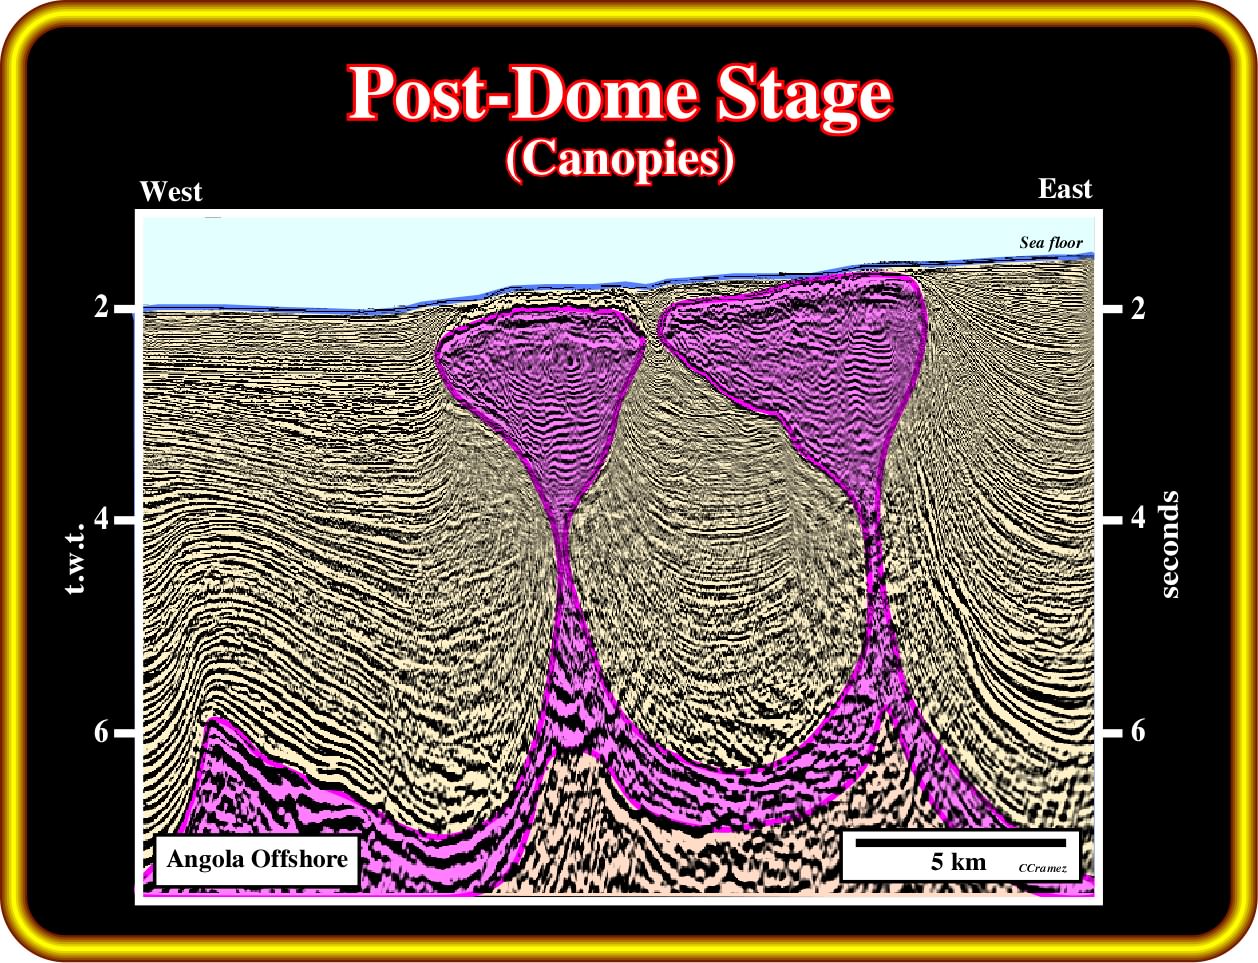
This seismic line illustrates the last step before two salt bulbs coalesce to form a salt stock (pluglike salt diapir with subcircular planform) canopy. It corresponds to a post-dome stage. Indeed, the upper part of the salt dome flows laterally creating an overhang, enhancing the possible turtle-back structures.
In the model below, proposed by Vendeville and Jackson (1992), salt domes are developed in association with a lengthening of the overburden, thereby, one cannot speak in halokinesis but in salt tectonics, since a significant tectonic stress is taken into account.
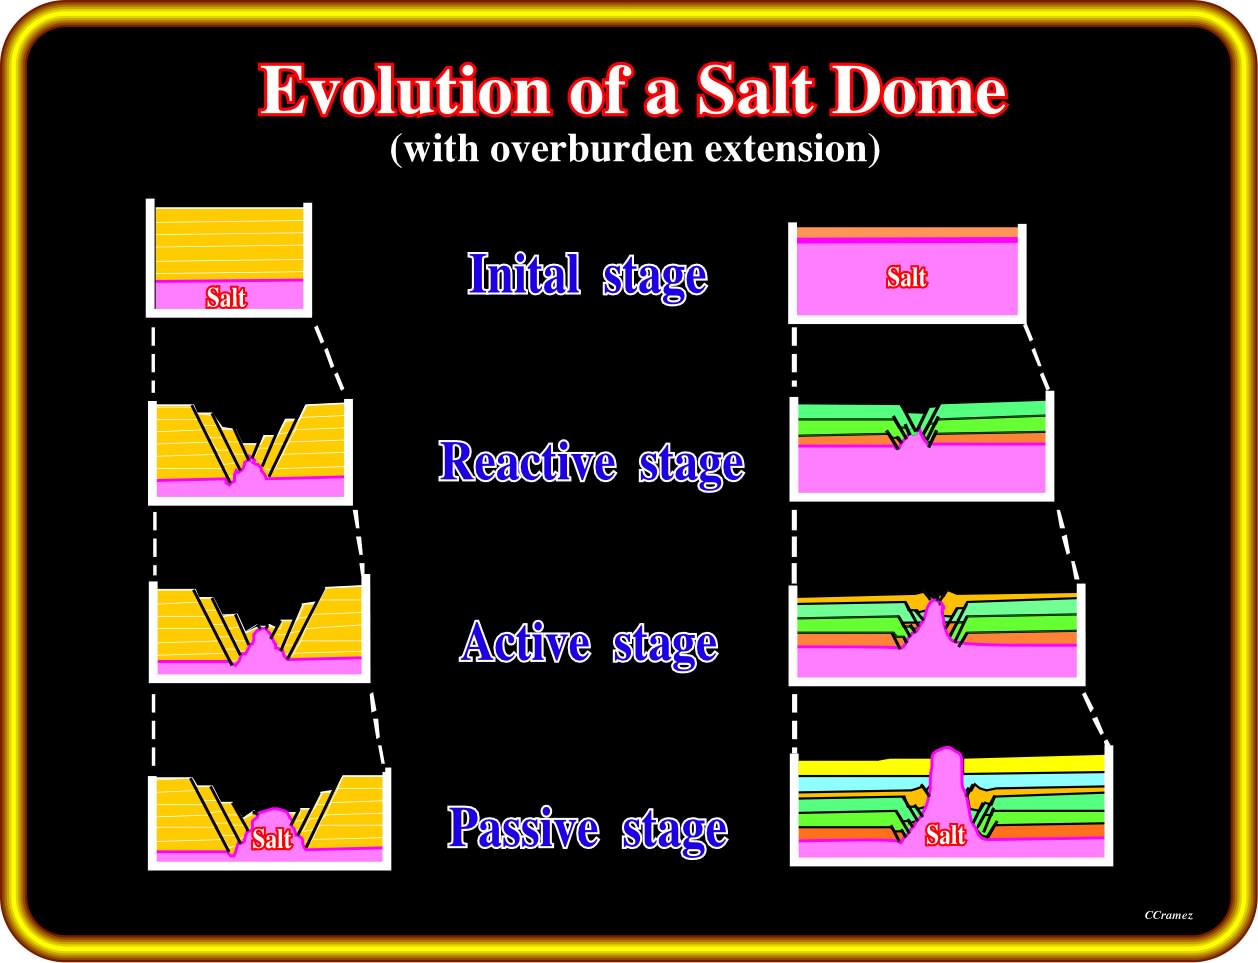
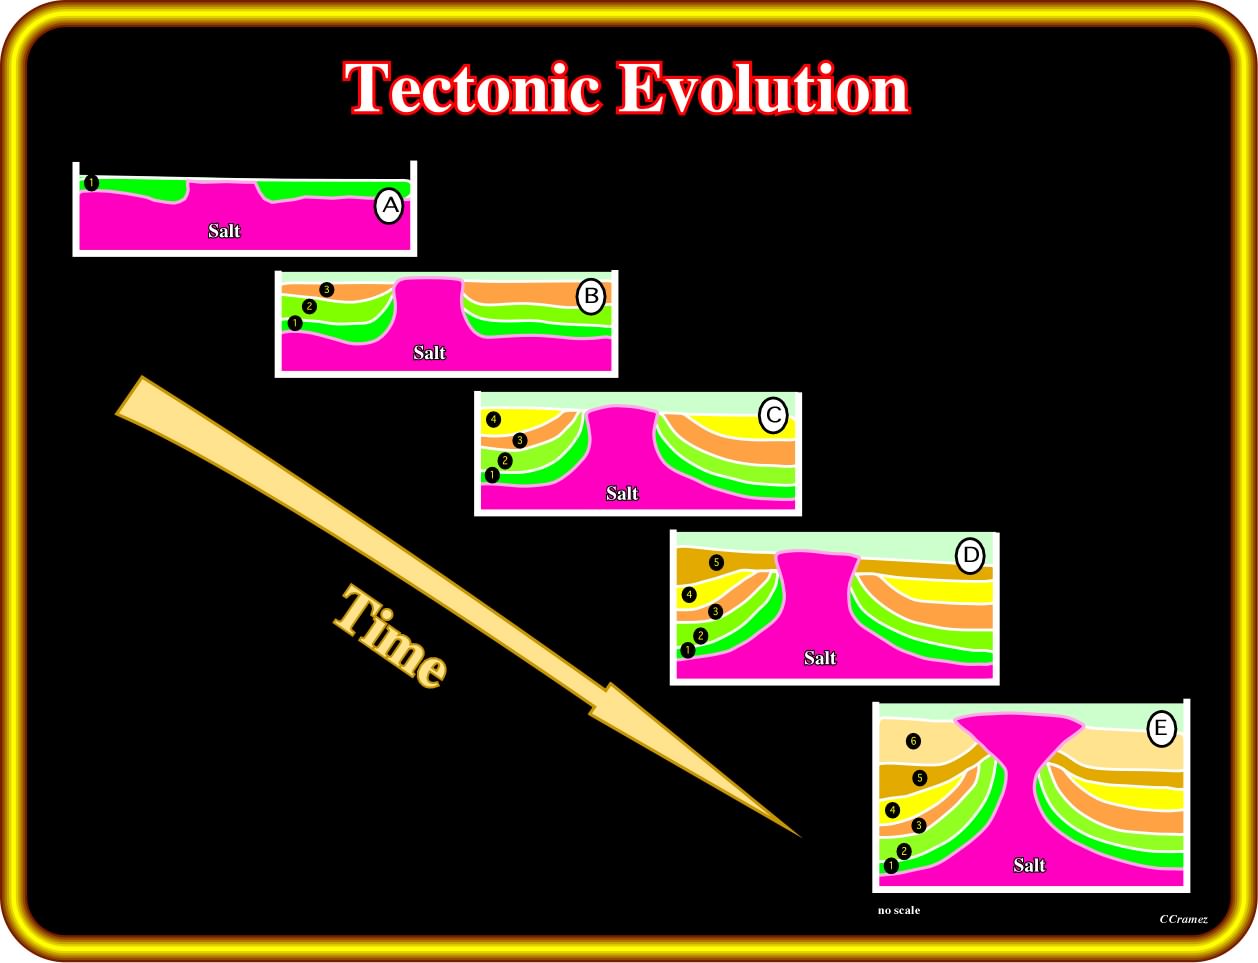
Geological model proposed to explain some diapiric salt structures when the overburden and the salt mother layer are lengthened by an extensional tectonic regime (σ1 vertical). This geological model explains a lot of salt structures observed in the South Atlantic margins particularly in the offshore Angola. The authors considered three main evolutionary stages: (i) Reactive Stage, the overburden is extended (normal faulting) ; Small anomalies at the top of the salt can locally extend the overburden by normal faulting ; (ii) Active Stage, the salt flows upward and arrives at the surface (or sea floor) ; (iii) Passive Stage. This passive stage creates apparent diapirism ; the salt does not deform the sediments of the overburden ; salt flows upward as sedimentation progresses on the condition that the salt dome is connected with the mother layer.
Goguel, in his experiment, using an aquarium, superposed two liquids with different density, to simulate a mother salt layer and an overburden, as illustrated below:
(i) At the bottom, he poured oil (the lighter liquid, and
(ii) At the top, he poured water, the denser liquid.
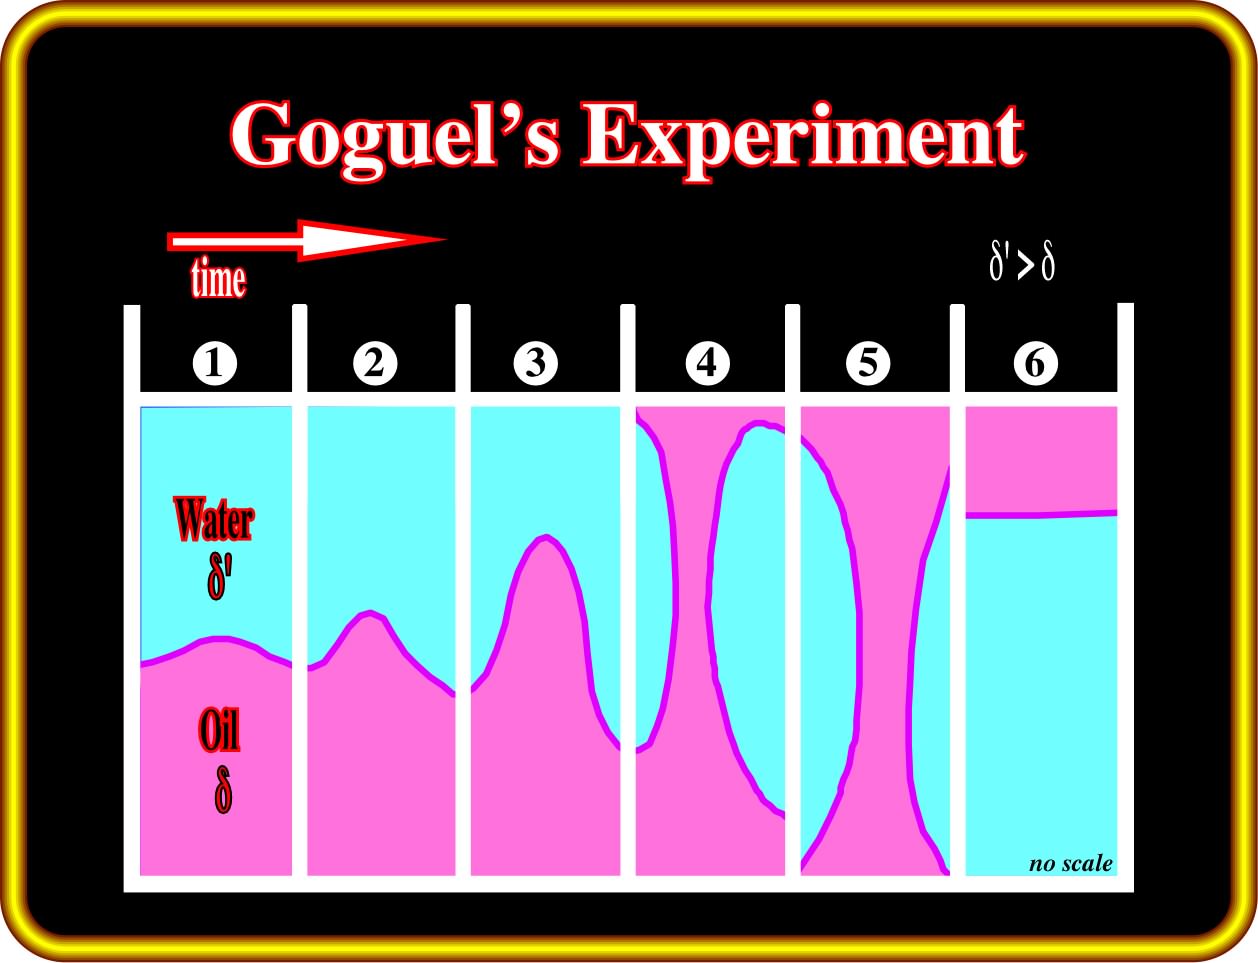
With time, in the Goguel’s experience, the lighter liquid (oil, in green) will displace the denser liquid (water), in the top of the aquarium. During the inversion, the interface oil-water show different morphologies ranging from a mound to a post-dome morphology, before all oil will be transferred to the top, that is to say, until the liquids reach stability.
Such a situation, i.e. a lighter fluid under a denser one is an unstable situation. Thereby, with time, the lighter fluid will become to surface, while the denser goes to the bottom. During such an inversion, several steps or stages can be considered:
a) Small Positive Anomalies: at the oil-water interface small equidistant (Rayleigh-Taylor instability) anomalies develop (1) ;
b) Mound Stage: the anomalies grow-up forming mounds characterized by its relatively flat flanks (2) ;
c) Dome Stage: growing, the mounds become domes. Their flanks reach a quite high dip, near the vertical (3) ;
d) Post-Dome Stage: since a dome arrives at surface, the oil starts to flow laterally, creating post-dome structures; some of these structures become disconnected from the mother oil layer (4 and 5) ;
e) Canopy Stage: at surface, the oil flowing in opposite direction creates canopy structures similar to those created by ascendant convection currents (5) ;
f) Stable Stage: Finally, all oil will be transferred at surface, reaching an equilibrium state (6).
The last three steps simulate the development of allochthonous salt layers, which can be connected or disconnected with the mother salt layer
Exercise 1:
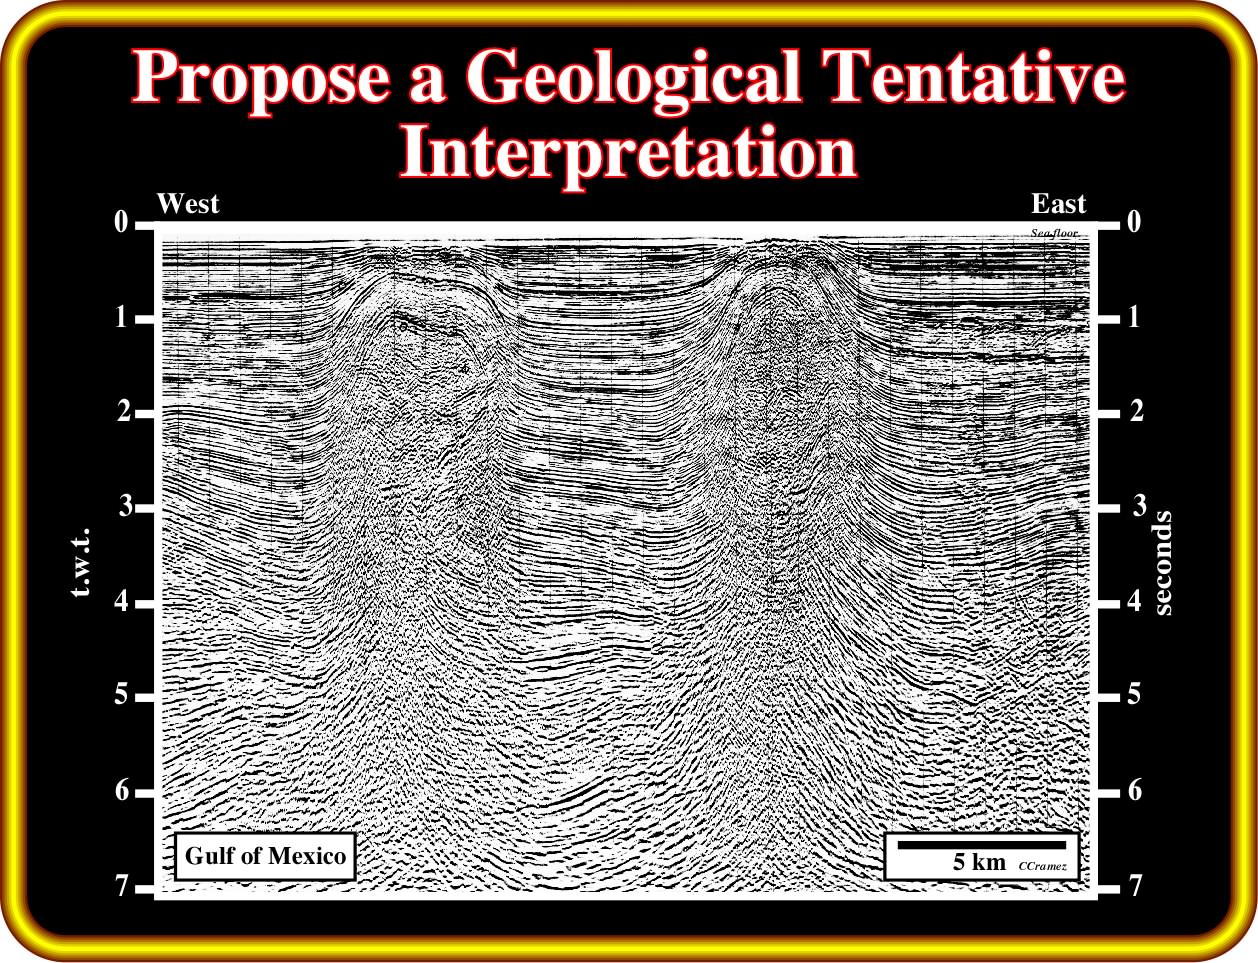
In the geological tentative interpretation of this seismic line from the Gulf of Mexico, you must pick the limits of the allochthonous and autochthonous salt, as well a,s the potential secondary salt welds connecting them. Is there a primary salt weld ? Explain the drop shape of the allochthonous salt, as well as, the origin of the normal faults located in the east part of the line.
Exercise 2:

Below the allochthonous salt, there is no evident of seismic reflectors. However, using the reflectors visible below the two salt allochthonous windows, try to give the more likely position of the top of the autochthonous salt, locating the secondary salt welds.
Exercise 3:
In your tentative interpretation, you should not forget:
(i) The bottom of the autochthonous salt ;
(ii) The breakup unconformity ;
(iii) The rift-type basins ;
(iv) The limits of the allochthonous salt ;
(v) The more likely secondary salt welds.
Finally, explain the morphology of the bottom of the sea.
Exercise 4:
Do not forget to pick :
(i) The breakup unconformity ;
(ii) The bottom of the salt :
(iii) To explain the more likely salt displacement mechanism ;
(iv) The potential source rocks in the rift-type basin sediments ;
Explain the diapirism. Is it passive (no significant extension of the overburden) or active diapirism (significant overburden extension) ?
to continue press
next
![]()
Send E-mail to carloscramez@gmail.com or to carlos.cramez@bluewin.ch with questions or comments about this workshop (Salt Tectonics Workshop for Kwanza and South Congo basin).
Copyright © 2013 CCramez
Last modification: June-July, 2013