
Part II: Salt Tectonics Interpretation Workshop associated with Salt
C) Pattern Recognition & Interpretation of Seismic Slice Data
C.3- Basic Block Diagram Exercises
Surface geologic maps were first used to infer sub-surface geology. Later, as seismic data and well's results became available, geologists constructed more accurate sub-surface maps and geologic profiles. The following exercises involving drawing of profiles from maps, and maps from profiles, will help geoscientists in charge of seismic interpretation, in which interactive interpretations of time slices and seismic lines are indispensable.
Exercise 1
All students of Prof. C. E. Wegman of Neuchâtel University (Switzerland) of the 1960's, certainly remember this exercise that our dear Master made us to do in order to develop our the spatial vision so useful in geology.
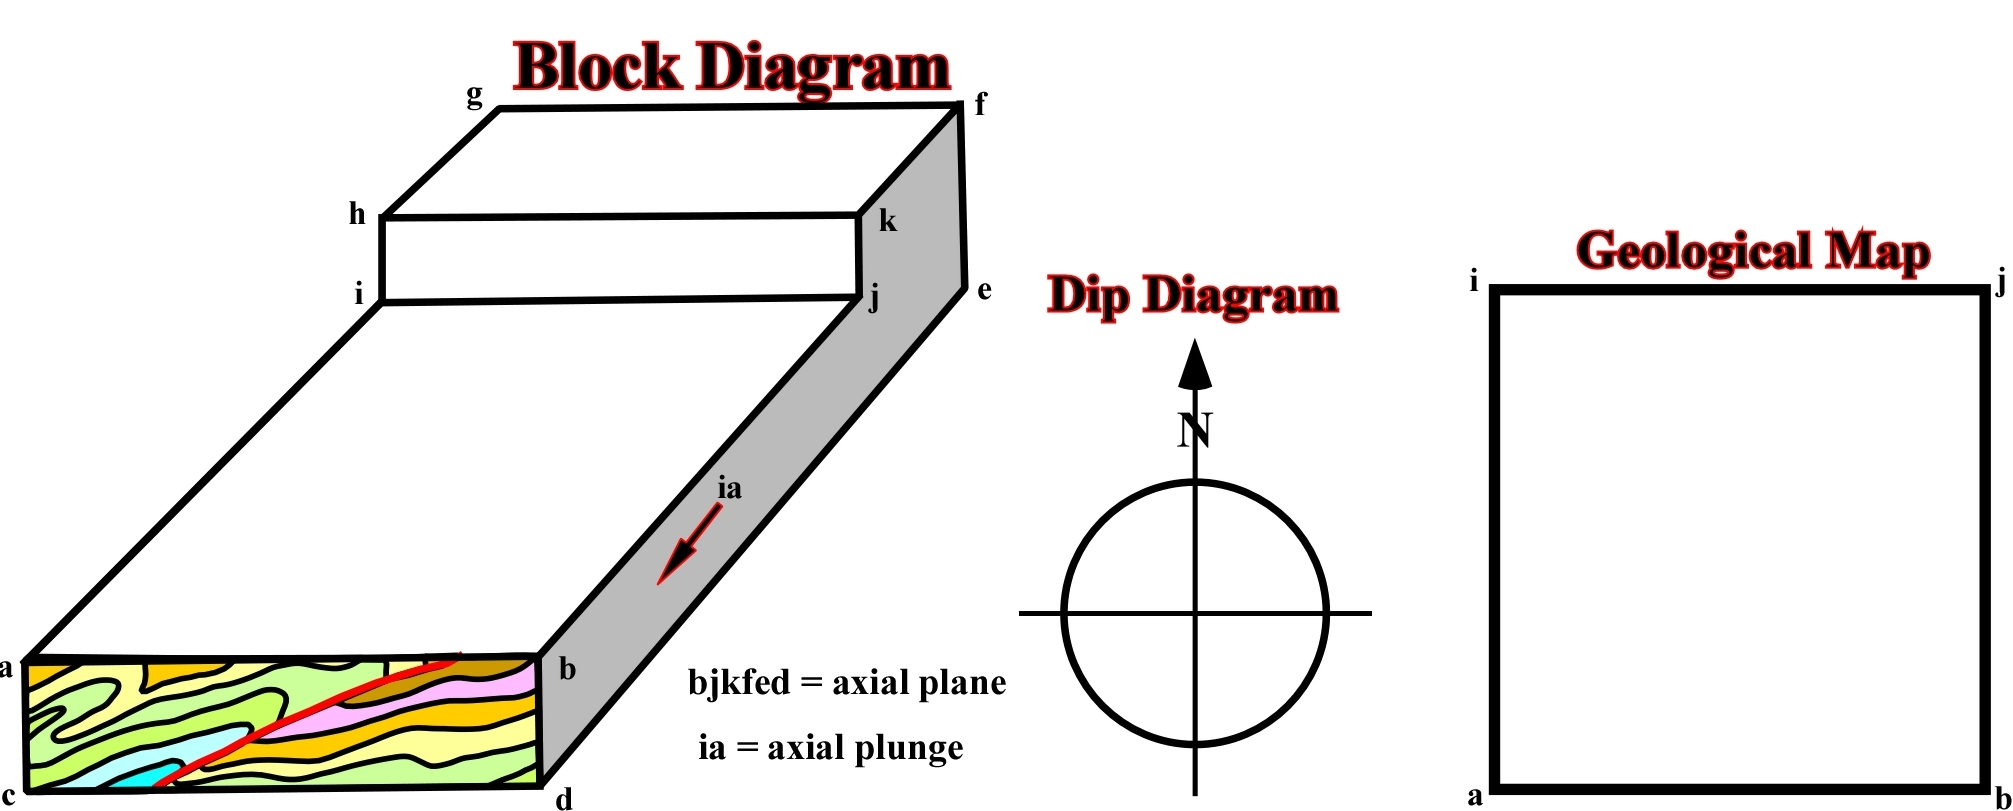
Assuming that the folding is concentric and knowing the axial plane and axial plunge determine the geological map from the tentative geological interpretation of the depth seismic line illustrated on the frontal part of the block-diagram. After drawing the geology on all sides of the block-diagram propose the more likely dip diagram. Finally, propose the more likely geologic map locating the areas with more significant dips.
Exercise 2
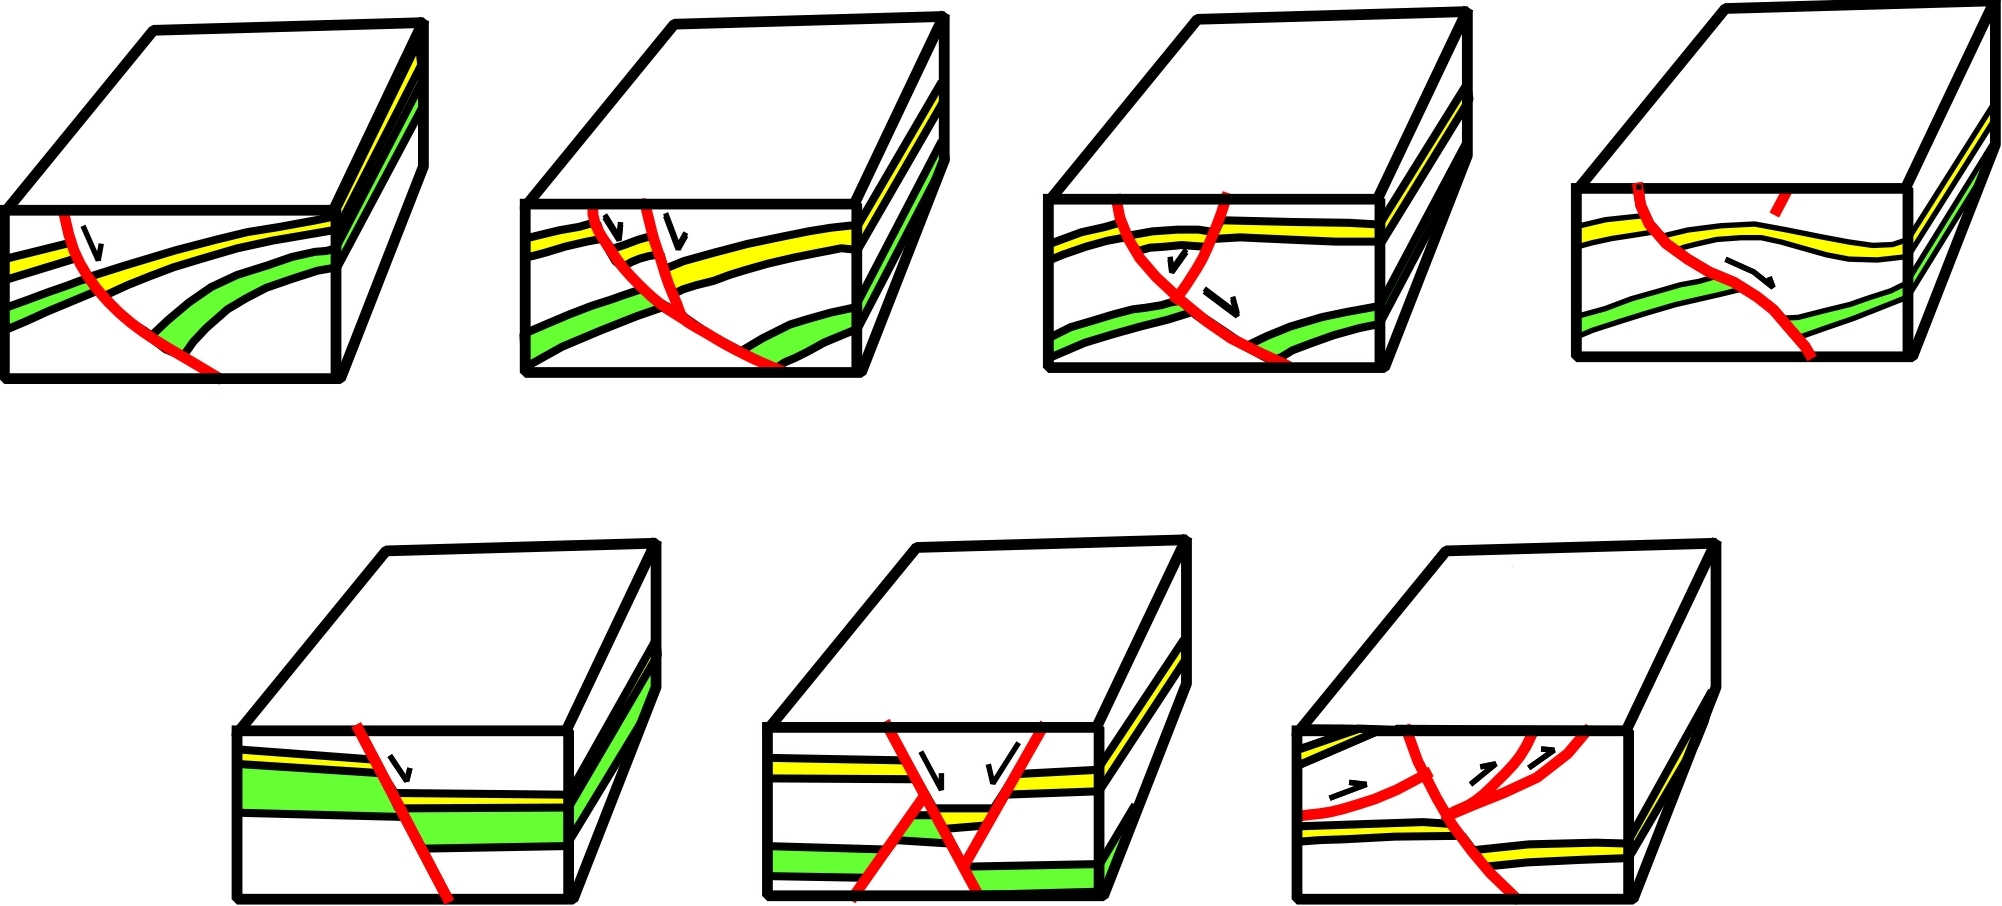
In each of these blocks diagrams using the strike and dip tentative geological interpretation of the depth seismic lines, map the more likely geometry of the fault planes on the time slices (top of each block diagram).
Exercise 3
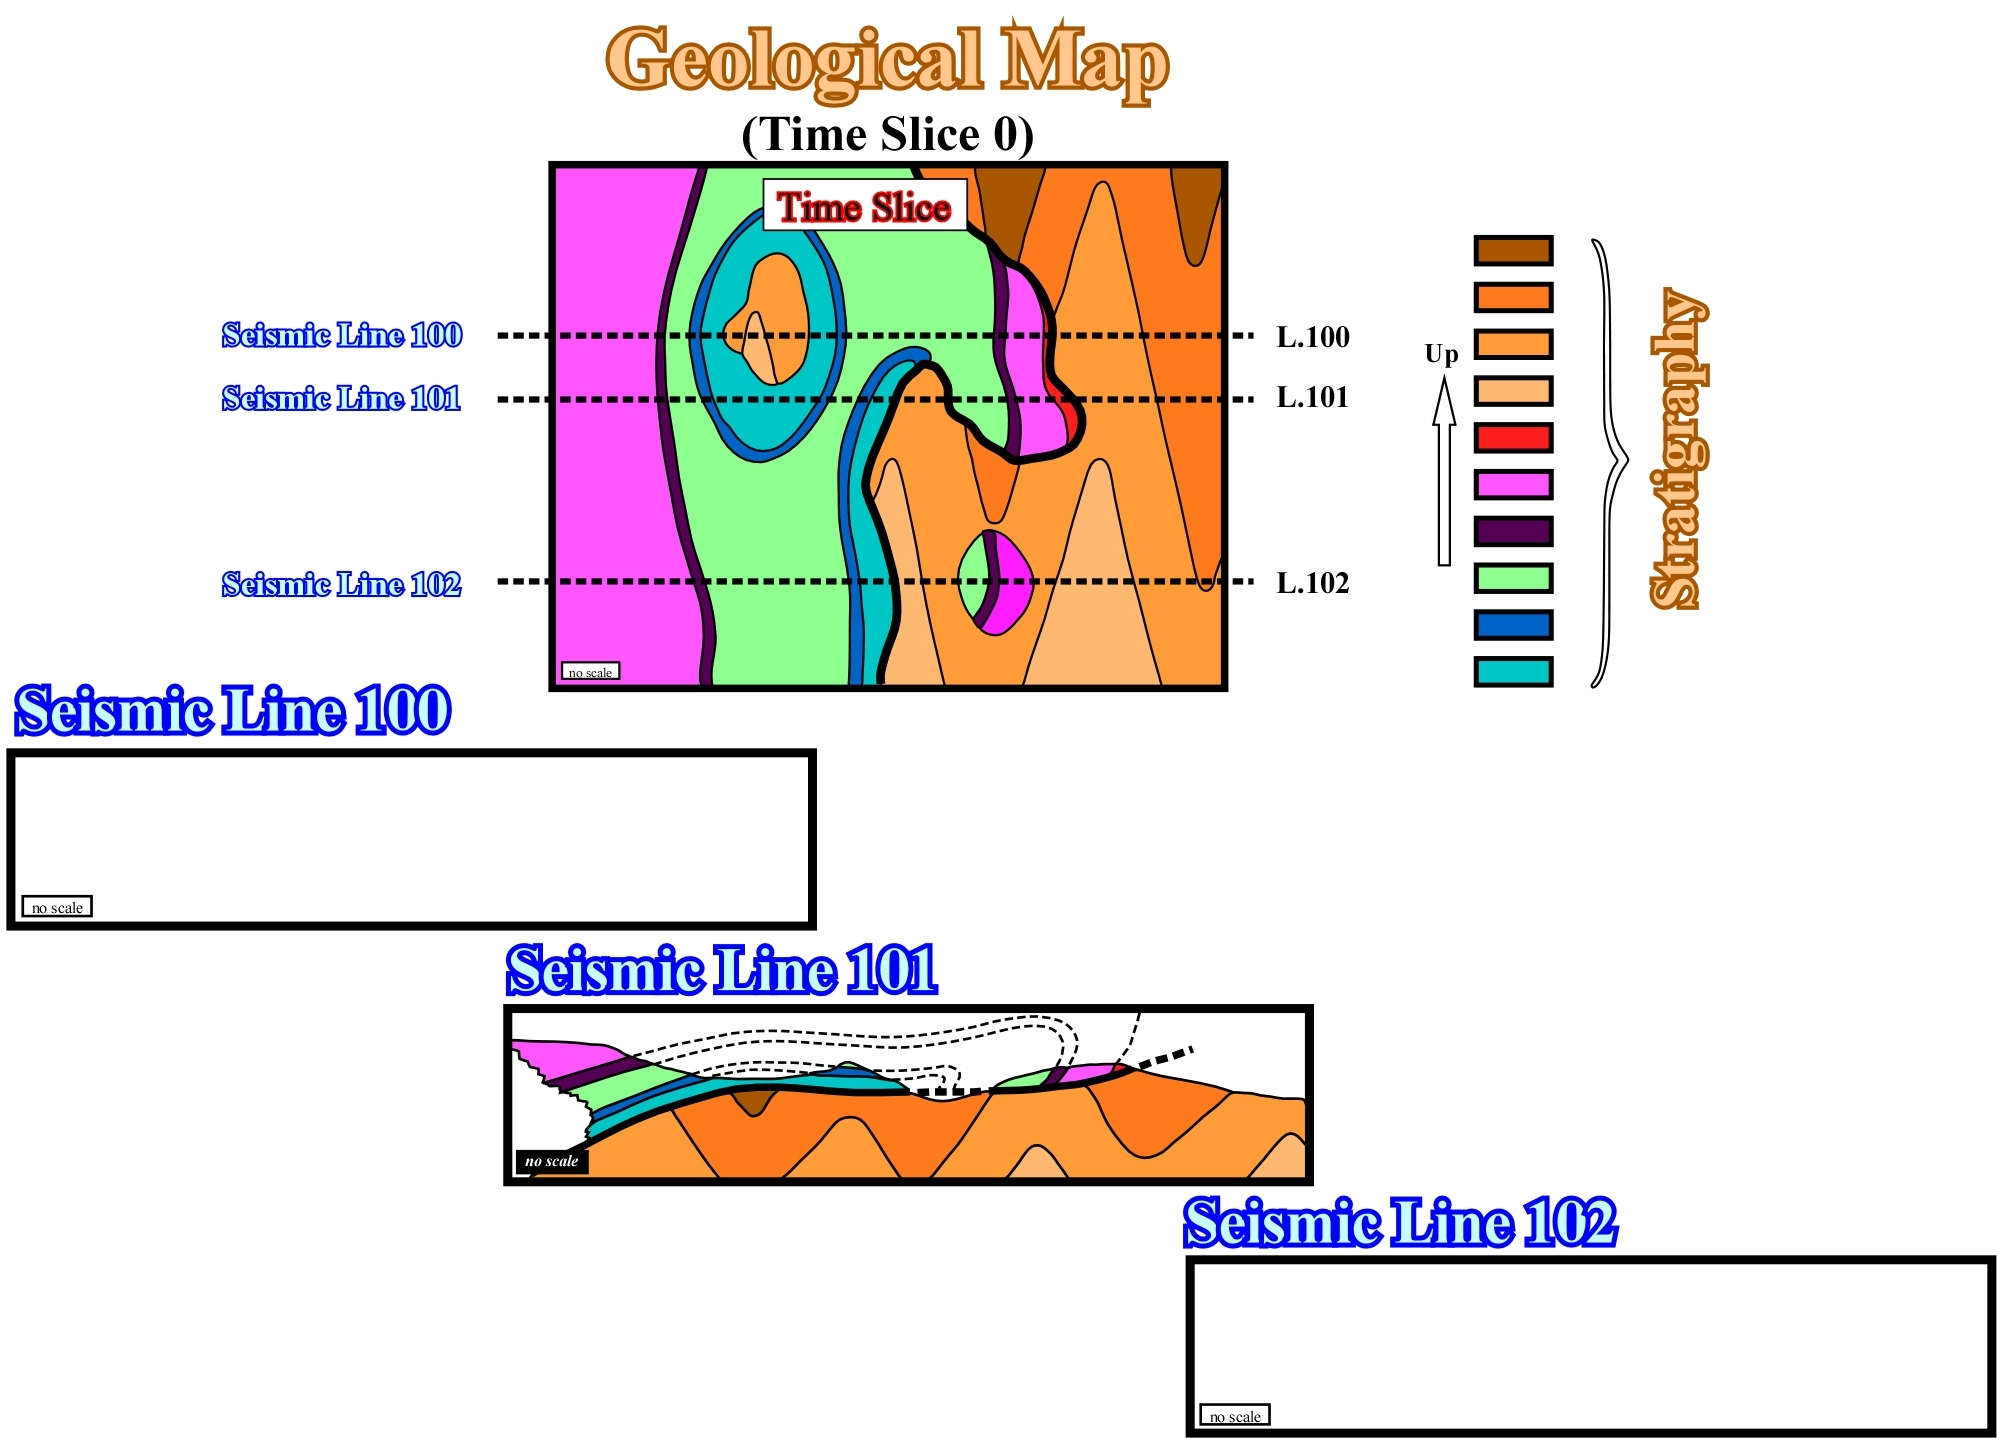
In a given sedimentary basin, characterized by a compressional tectonic regime (σ1horizontal, σ2 horizontal and σ3 vertical) and a relatively flat topography, knowing the stratigraphy and the geological map, which corresponds to time slice zero, as well as, the tentative geological interpretation of the seismic line 101, draw the more likely tentative geological interpretation of seismic lines 100 and 102.
Exercise 4
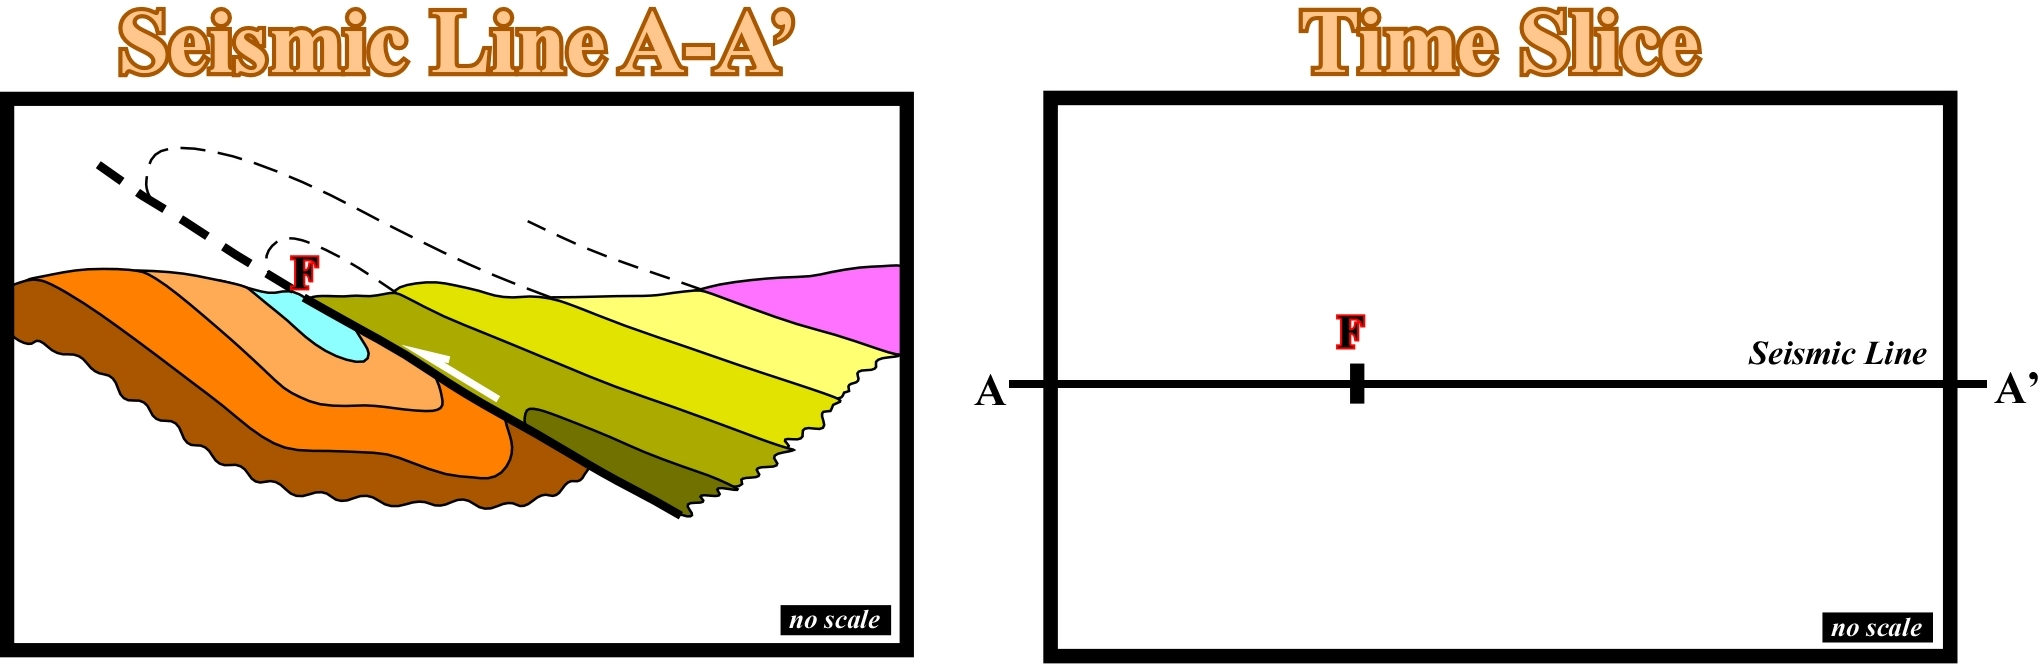
In a given sedimentary basin, characterized by a compressional tectonic regime (σ1 horizontal striking West-East, σ2horizontal striking North-South and σ3 vertical) and a relatively flat topography, the geological maps can be considered as a zero (0) time slice (surface). Knowing: (i) The tentative geological interpretation of the seismic line A-A' ; The trace of the seismic line on the geological map and (iii) The position of the fault on the seismic line, draw the more likely surface time slice (geological map).
Exercise 5
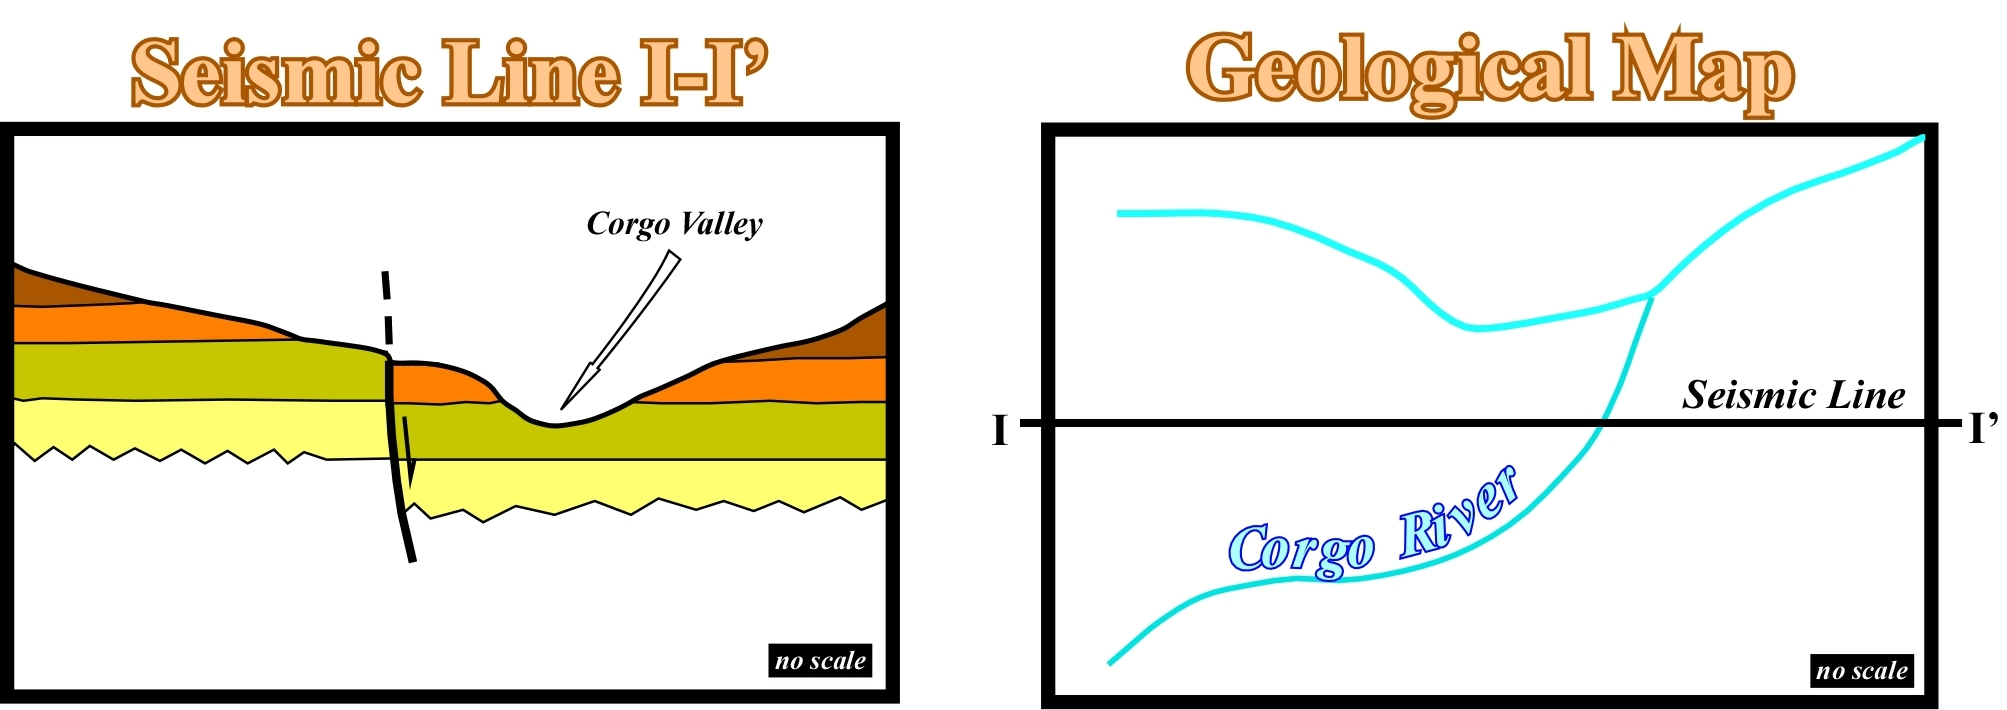
The tentative geological interpretation of the seismic line I-I' comes from a sedimentary basin characterized by an extensional tectonic regime (σ1 vertical, σ2 horizontal striking North-South and σ3 horizontal striking West-East). The sediments were lengthened. Knowing : (i) The tentative geological interpretation of the seismic line I-I' ; (ii) The trace of the seismic line on the geological map and (iii) the mapping of the path of two major rivers, draw the more likely surfaces time slice (geological map).
Exercise 6
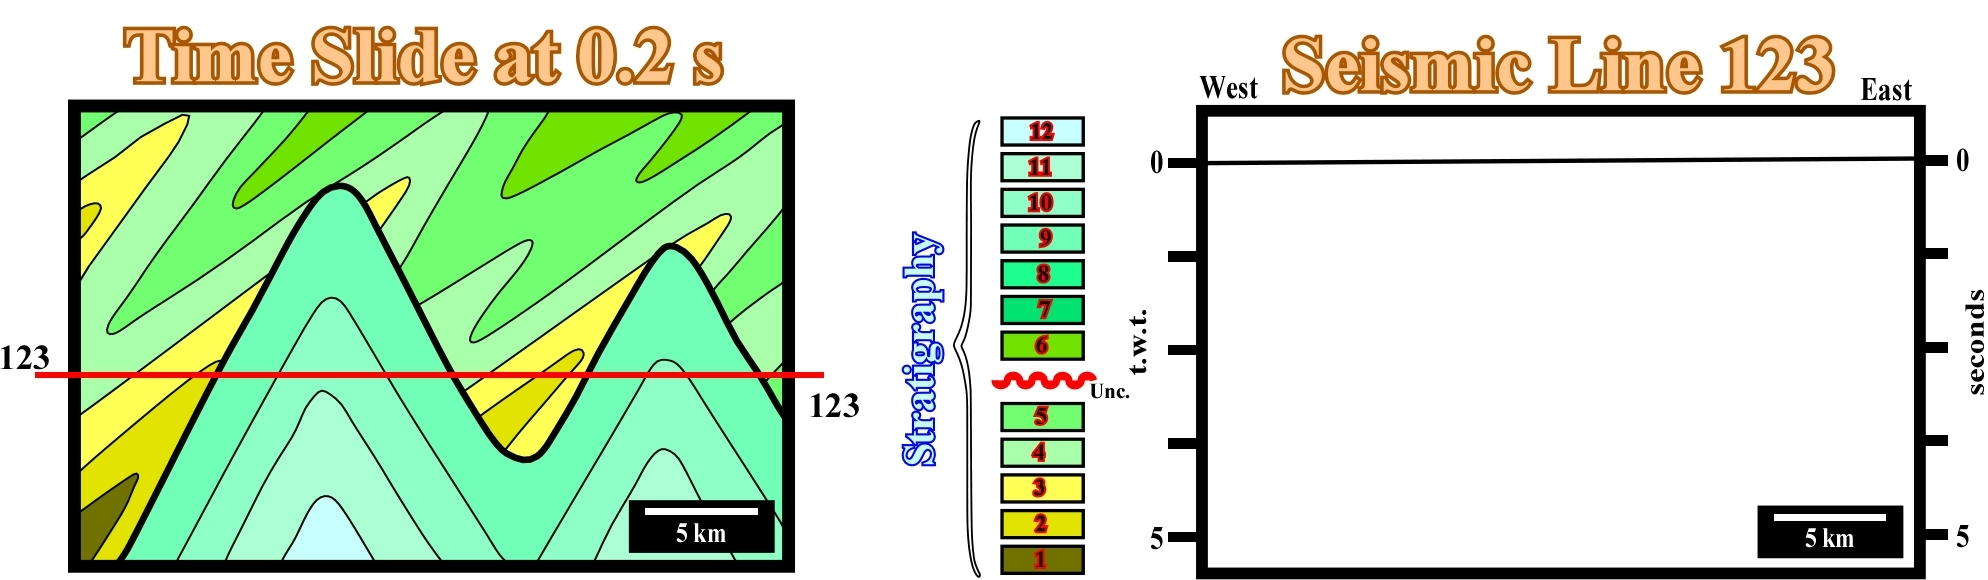
A Mesozoic cratonic basin was deposited above a Paleozoic fold-belt. A later compressional reactivation of the fold belt slightly shortened the cratonic basin. Knowing : (i) The more likely time slice at 0.2 seconds (t.w.t.) ; (ii) The location of the seismic line 123 and (iii) the stratigraphy of both basins (1-6 and 7-12), draw the more likely tentative geological interpretation of the seismic line 123 and give the more likely age of the unconformity separating both basins explaining your answer.
Most likely solution
Exercise 1
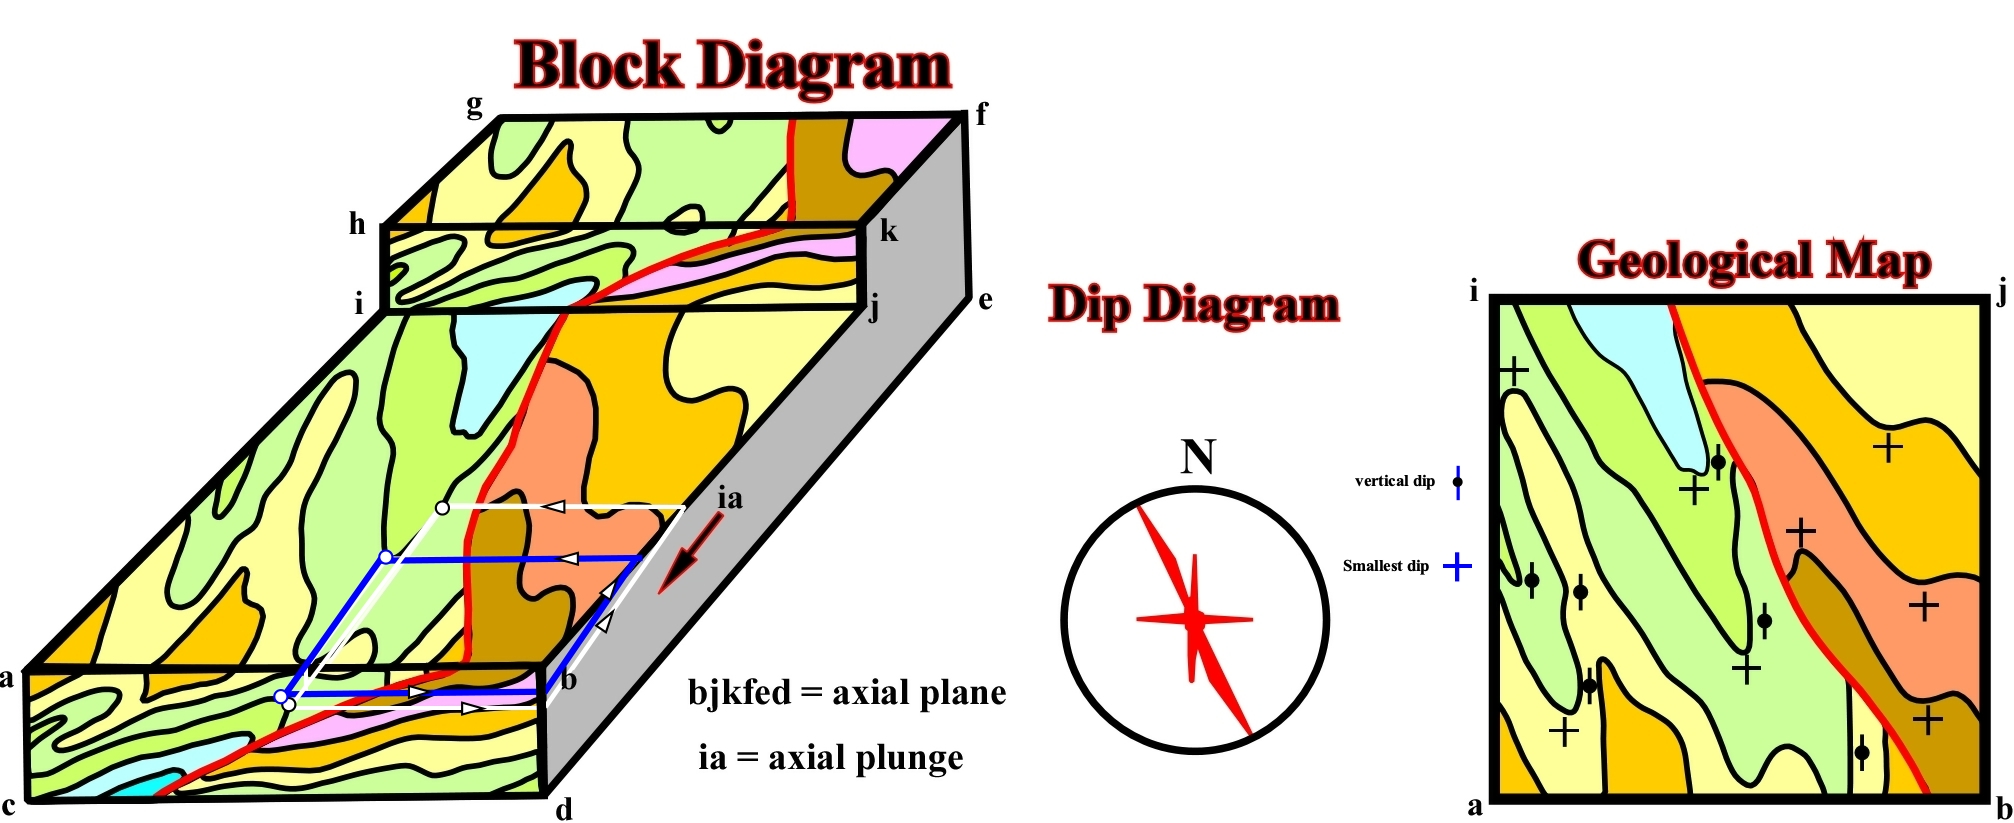
Fig. 343- As the right side of the block-diagram is the axial plane on which " ia" is the axial plunge and the folding is concentric, each point of the tentative geological interpretation (vertical frontal side "abcd" of the block-diagram) can be projected on the horizontal side "abji", i.e., on the geological map of the area, following the indicate white trajectory, for instance. On other words, 1) following a trajectory parallel to "ab", you can project an point A of the tentative interpretation on the axial plane (distance x), 2) then, following the axial plunge, on the axial plane, the intersection point is projected on the horizontal line "bj" (distance y), 3) finally, the last intersection point is displace on the plane "abji" of a distance x following a trajectory parallel to "ab". The final position of the initial point A after such a path, is its projection of the on the first horizontal side of the block diagram, i.e., its position in the geological map. Making this operation for the more significant points of the tentative geological interpretation of the seismic line, you can build-up the more likely geological map. In addition, these steps are also valid for each point of the reverse fault (in red) of the tentative interpretation, since it is not only coeval but induce as well by the same tectonic regime that deformed the strata. As you can see on the geological map illustrated as more likely solution, the vertical dips indicate the strike of the axial plane of the folding and smallest dip indicate the axial plunge.
Exercise 2
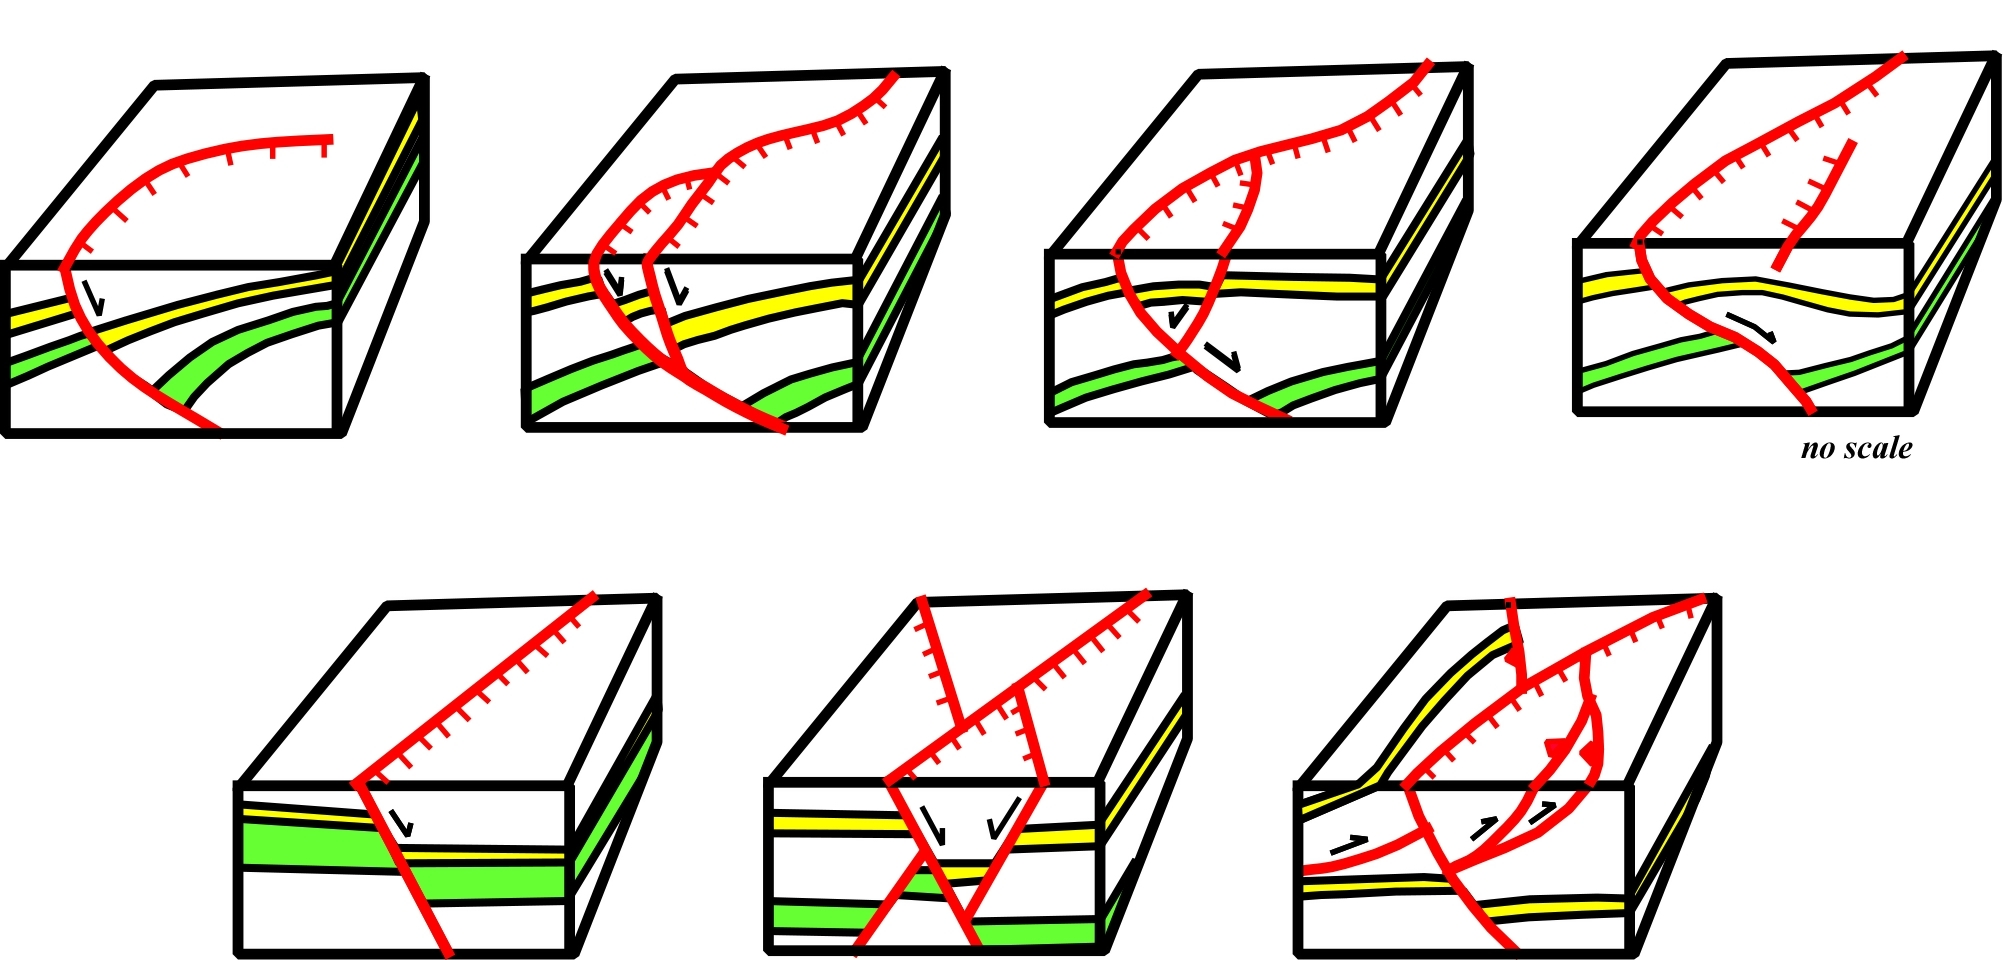
Fig. 344-In an homogeneous tectonic compartment (it always possible to subdivide an geology body in different compartment having a typical tectonic) (i) a curvilinear growth fault in a time slice (geological map without topography), will have, in an seismic line perpendicular to the fault, a decreasing dip in depth, i.e., dip of the fault flattens in depth ; (2) the connection of two curvilinear faults in a time slice is, also, recognized on a seismic line perpendicular to the faults, (3) A curvilinear fault with an associated curvilinear antithetic fault defining a graben structure in a time slice, will be recognized on a perpendicular seismic line with an antiform structure between the faults with opposite vergences ; if on the time slice the faults are not connected (4), on the seismic line they will be not connected either, (5) a rectilinear normal fault on a time slice, will have a constant dip in depth, on a more or less perpendicular (taking into account the velocity increasing of the seismic intervals in depth), (6) Two intersecting normal faults of different age ("x faults") on a time slice, in a more or less perpendicular seismic define a graben structure over an horst structure, which is not true if the older fault is a reverse fault as illustrated on the lower right block-diagram.
Exercise 3
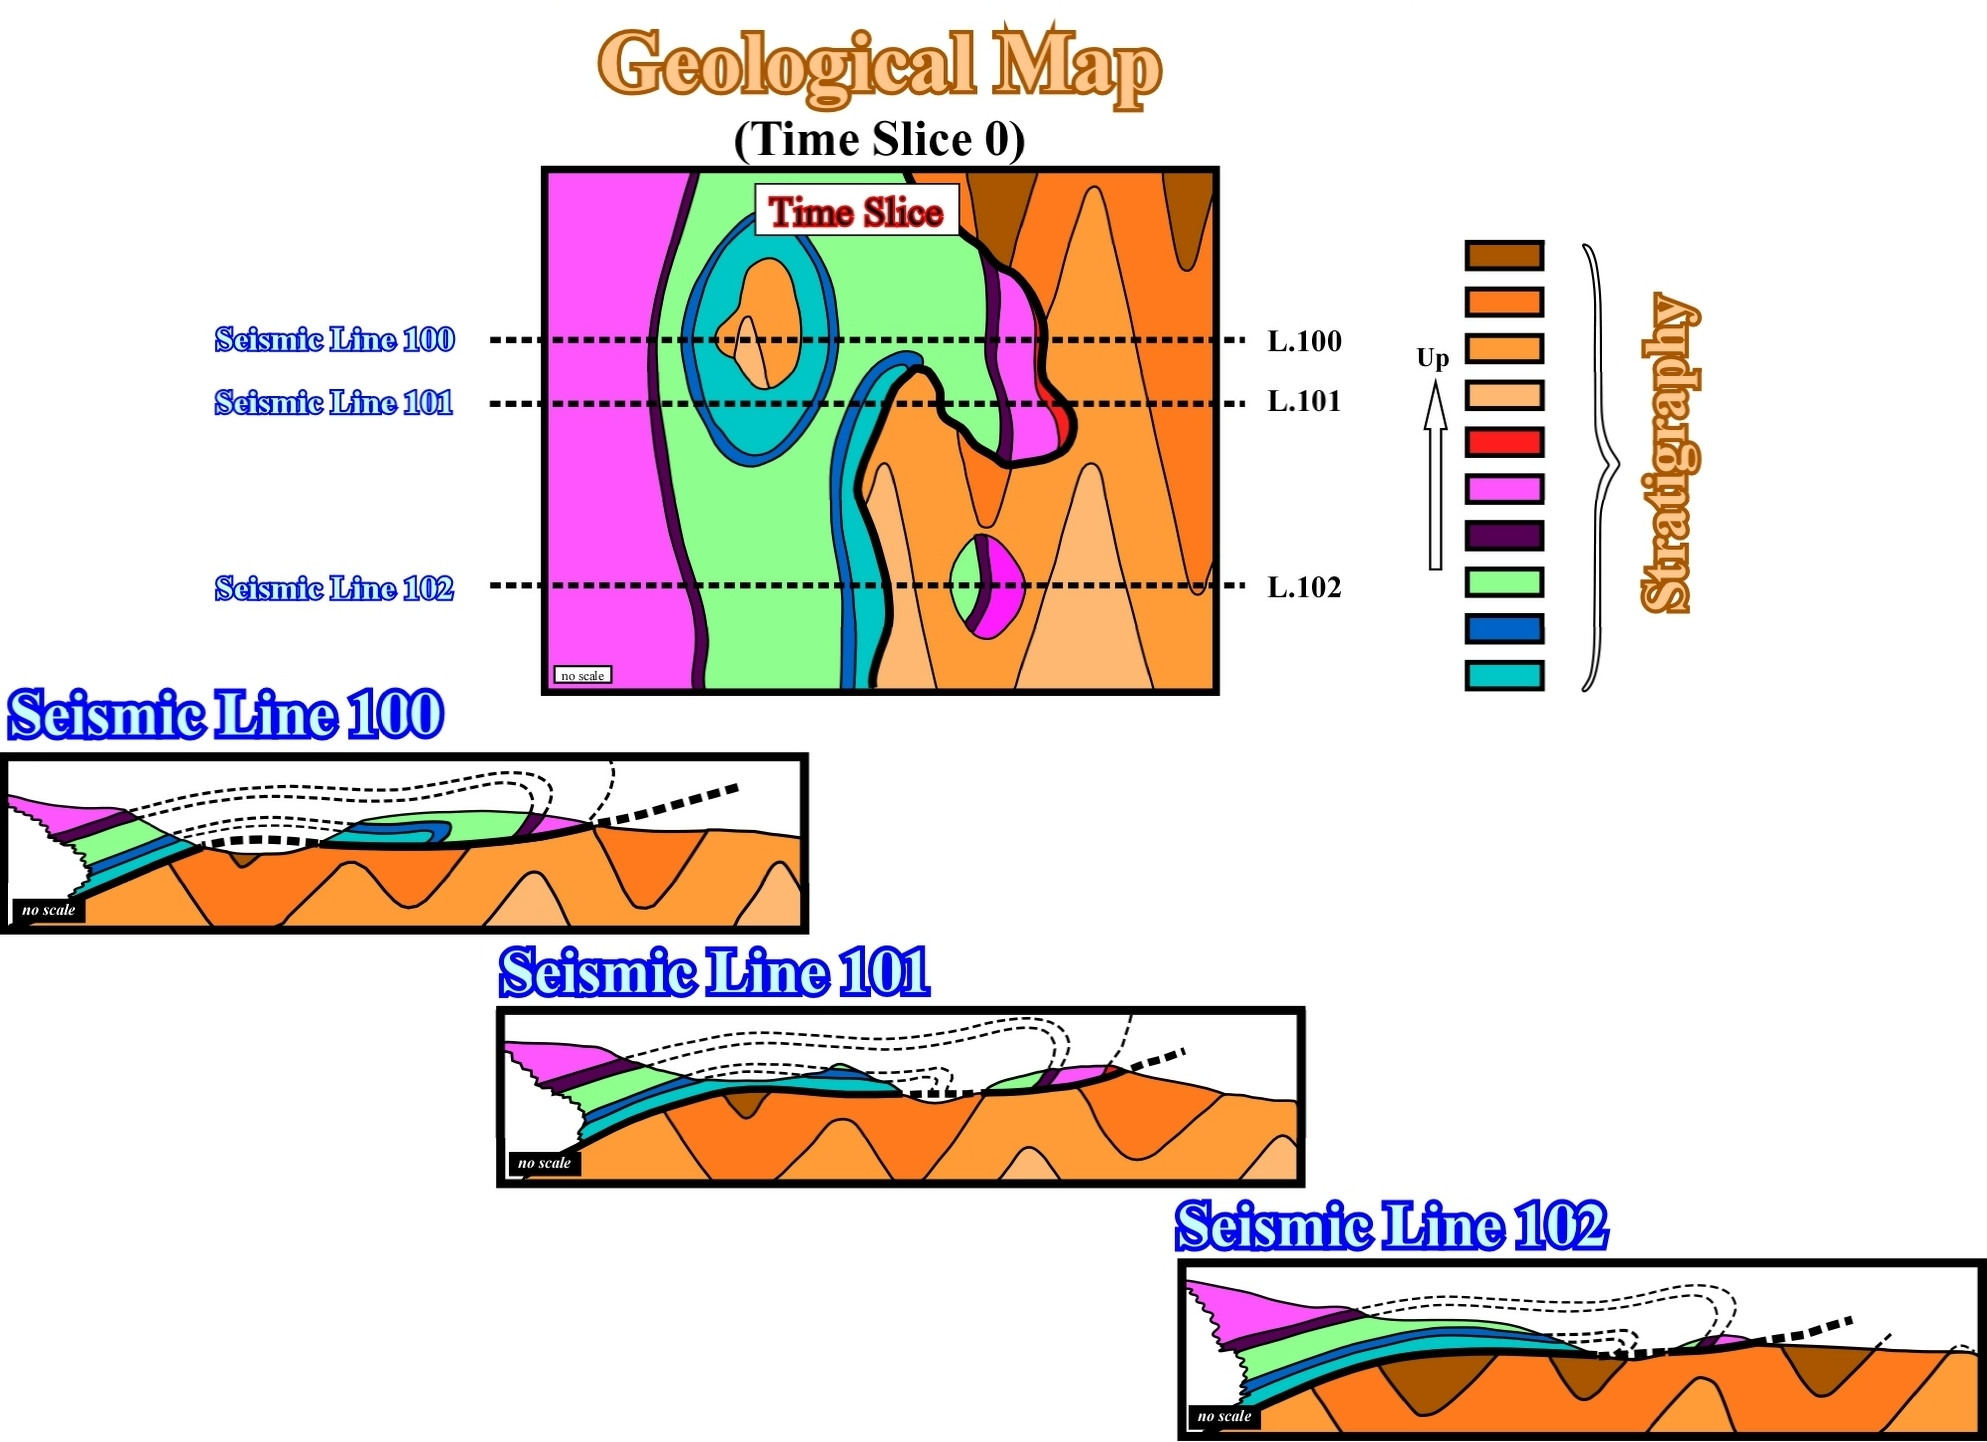
Fig. 345- Having recognized on the geological map the detachment plane of the thrust fault which overlain the fold belt, the geometry of the seismic lines is quite easy knowing that (a) in an anticline structure the older layer are in core of the structure and (b) the fold belt outcrops on the sedimentary windows crossed by by the seismic lines.
Exercise 4
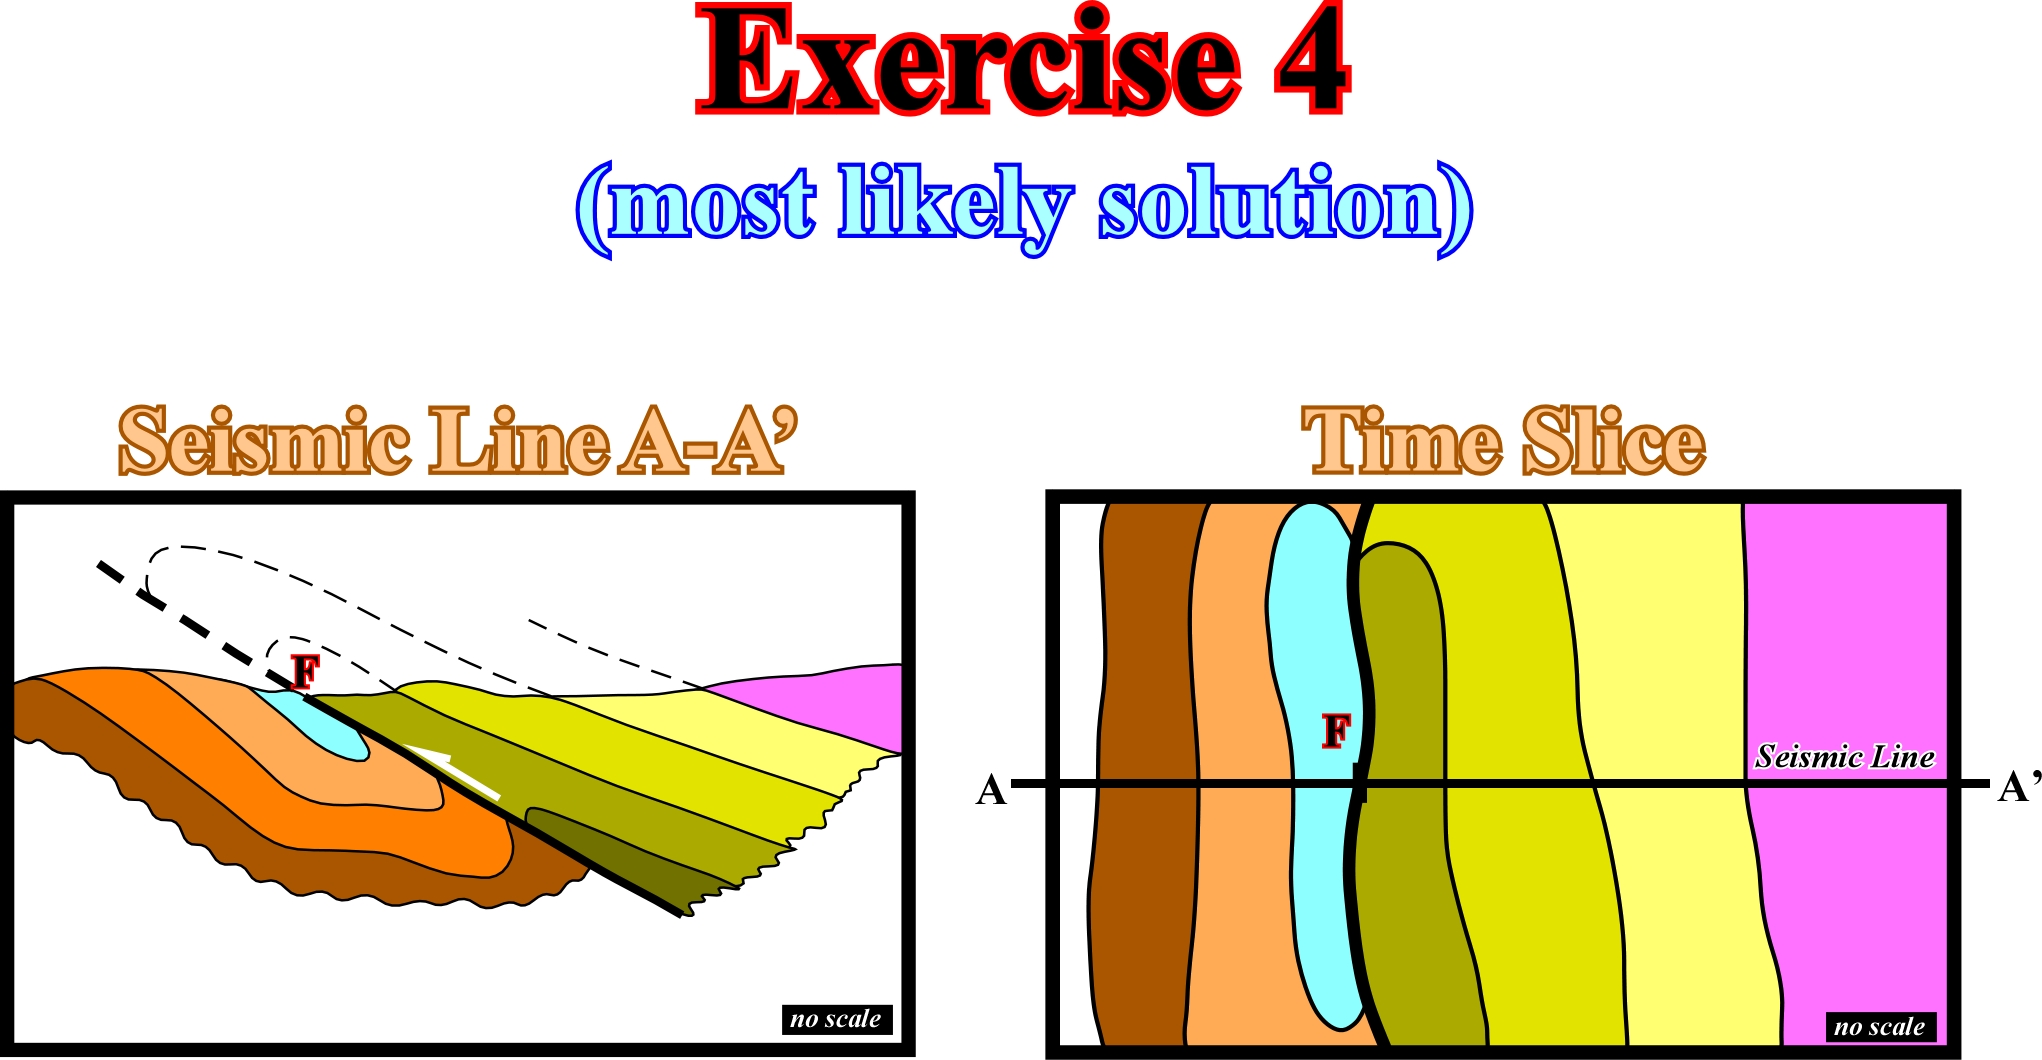
Fig. 346- Assuming the thrust fault is coeval and induced by the same compressional tectonic regime than deformed the strata and knowing that in a geological map, with quite flat topography, in a syncline structure the younger layers form the core of the structure and in an anticline are the older layers that are on the centre of the structure, the proposed solution is likely. However, such a solution implies not only a more or less concentric folding and that the seismic line is located near the top of a changing of the axial plunge.
Exercise 5
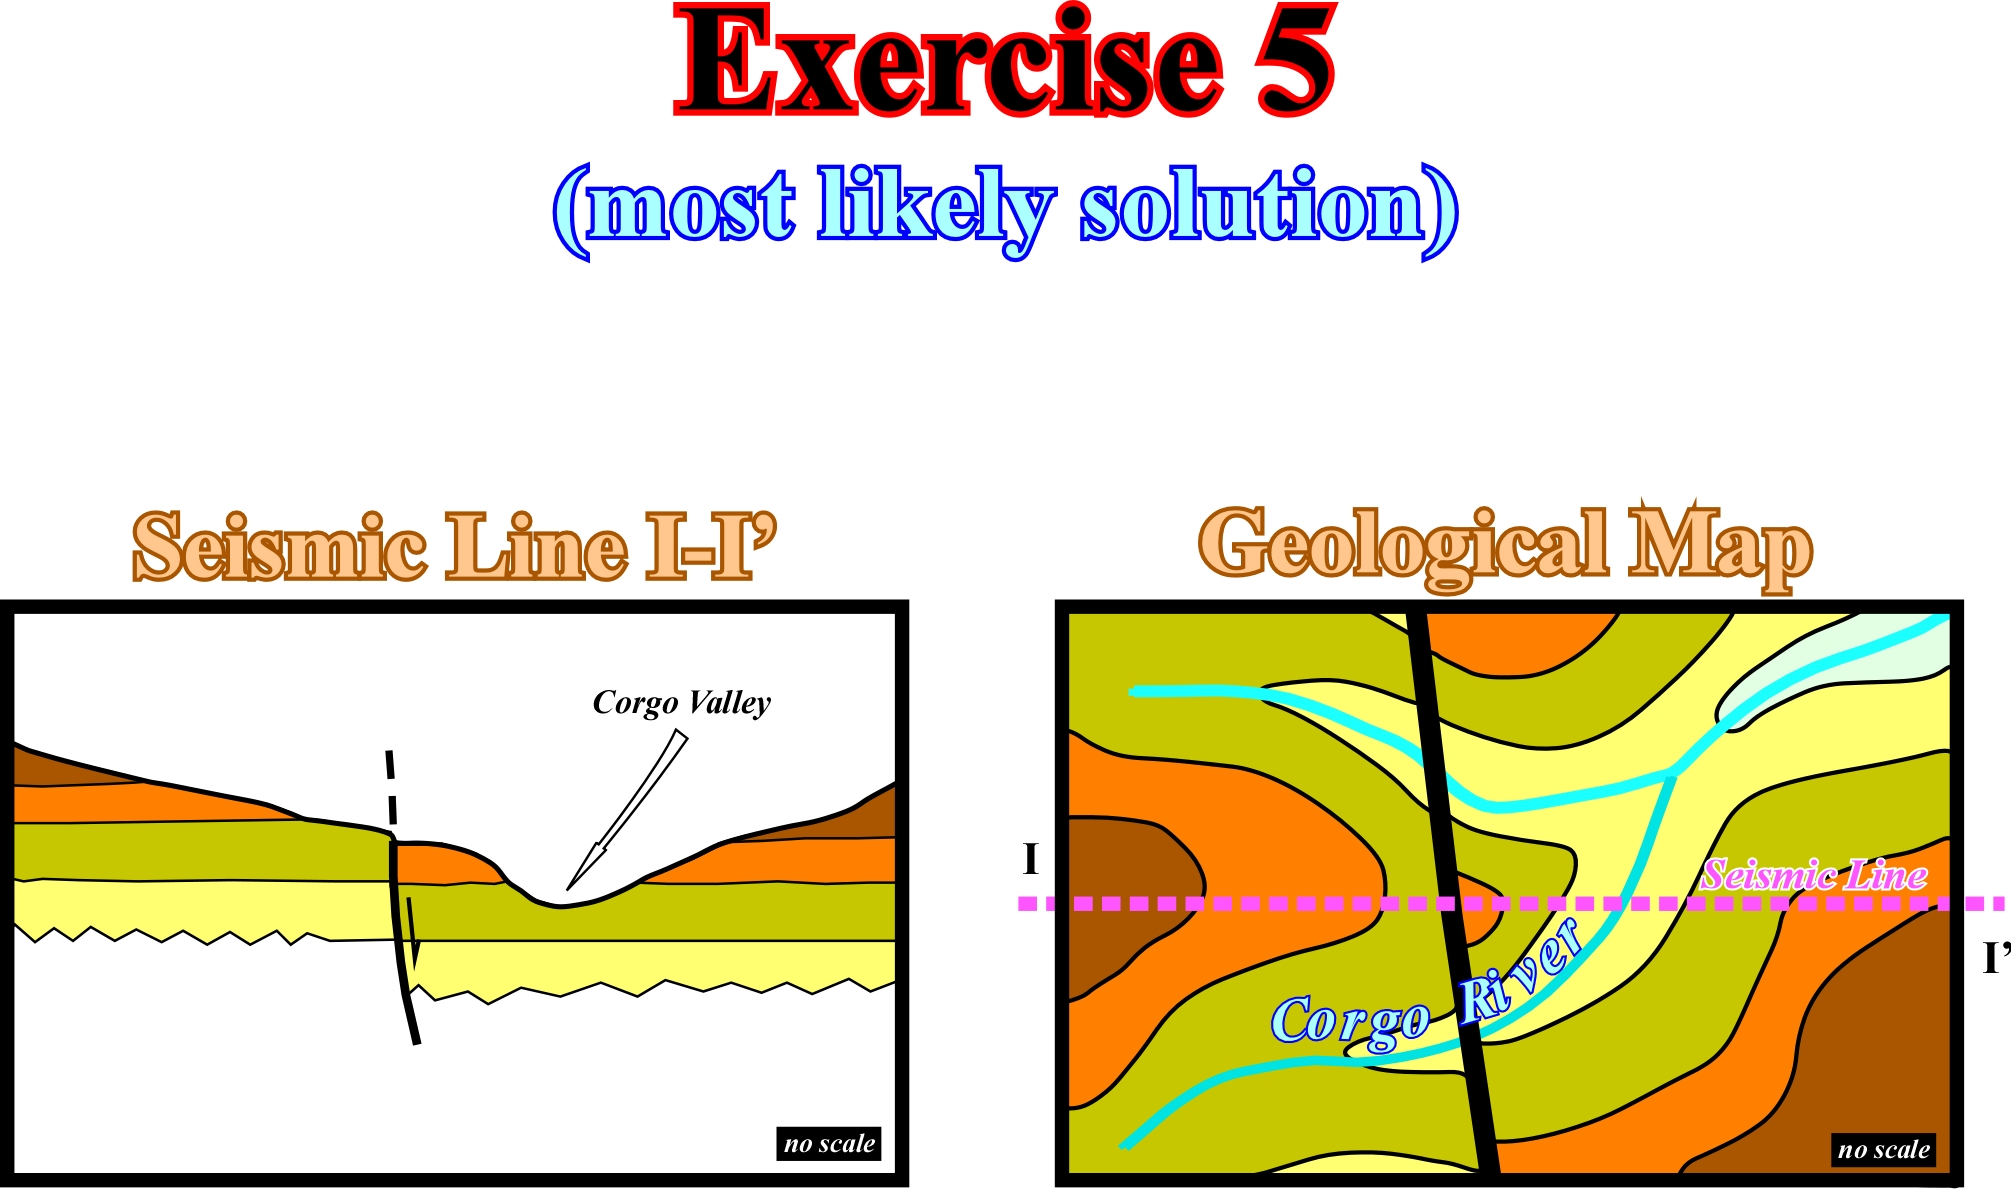
Fig. 347- Knowing, (i) the erosional surface (unconformity in sequential stratigraphy) is, in this particular example, induced, mainly, by an absolute sea level fall (eustasy), since the strata are horizontal and (ii) the river valleys correspond to incised valleys dipping seaward, the proposed solution, which takes into account the late normal faulting, seems quite likely.
Exercise
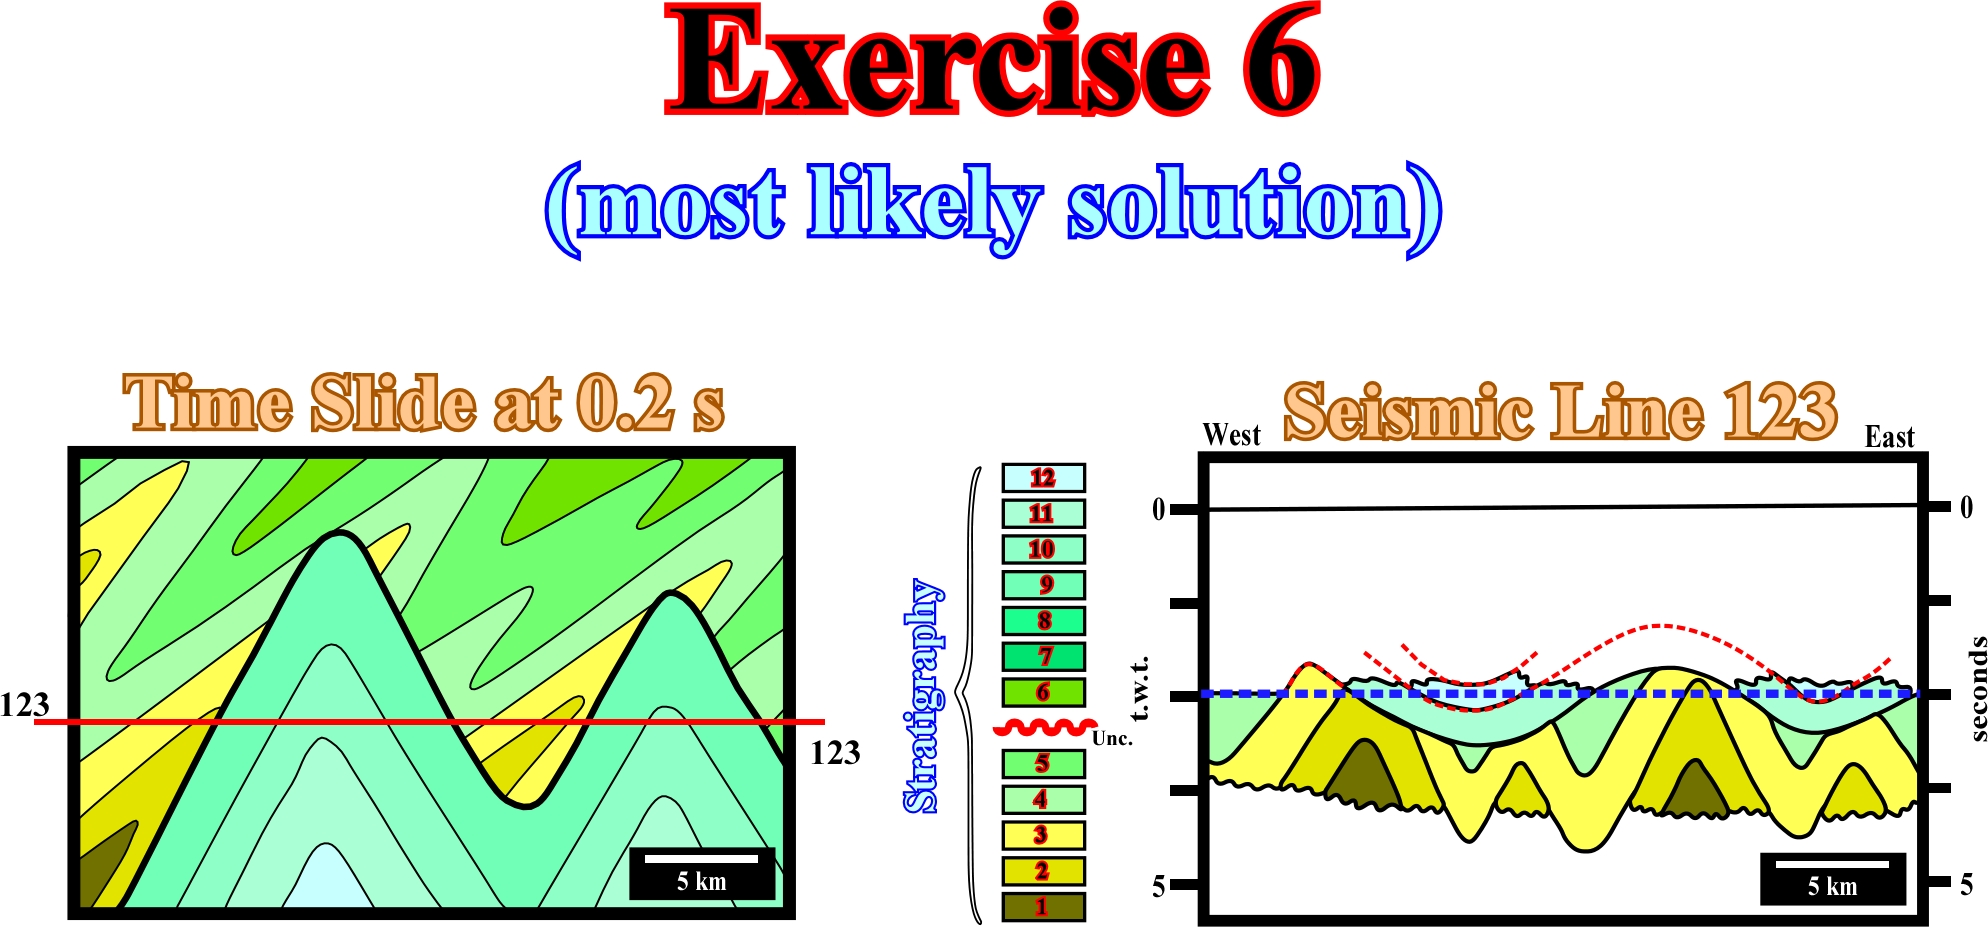
Fig. 348- Knowing the stratigraphy of both fold belts and the tectonically enhanced unconformity (angular unconformity) between them, and that in a time slice the axial plane is given by the stacking the different hinge lines (where the limbs of the fold meet), the proposed solution seems plausible, since the folds of each fold belt have different axial planes and axial plunges.
to continue press
next
![]()