
Part II: Salt Tectonics Interpretation Workshop associated with Salt
C) Pattern Recognition & Interpretation of Seismic Slice Data
C.4- Serial Profile Demonstration
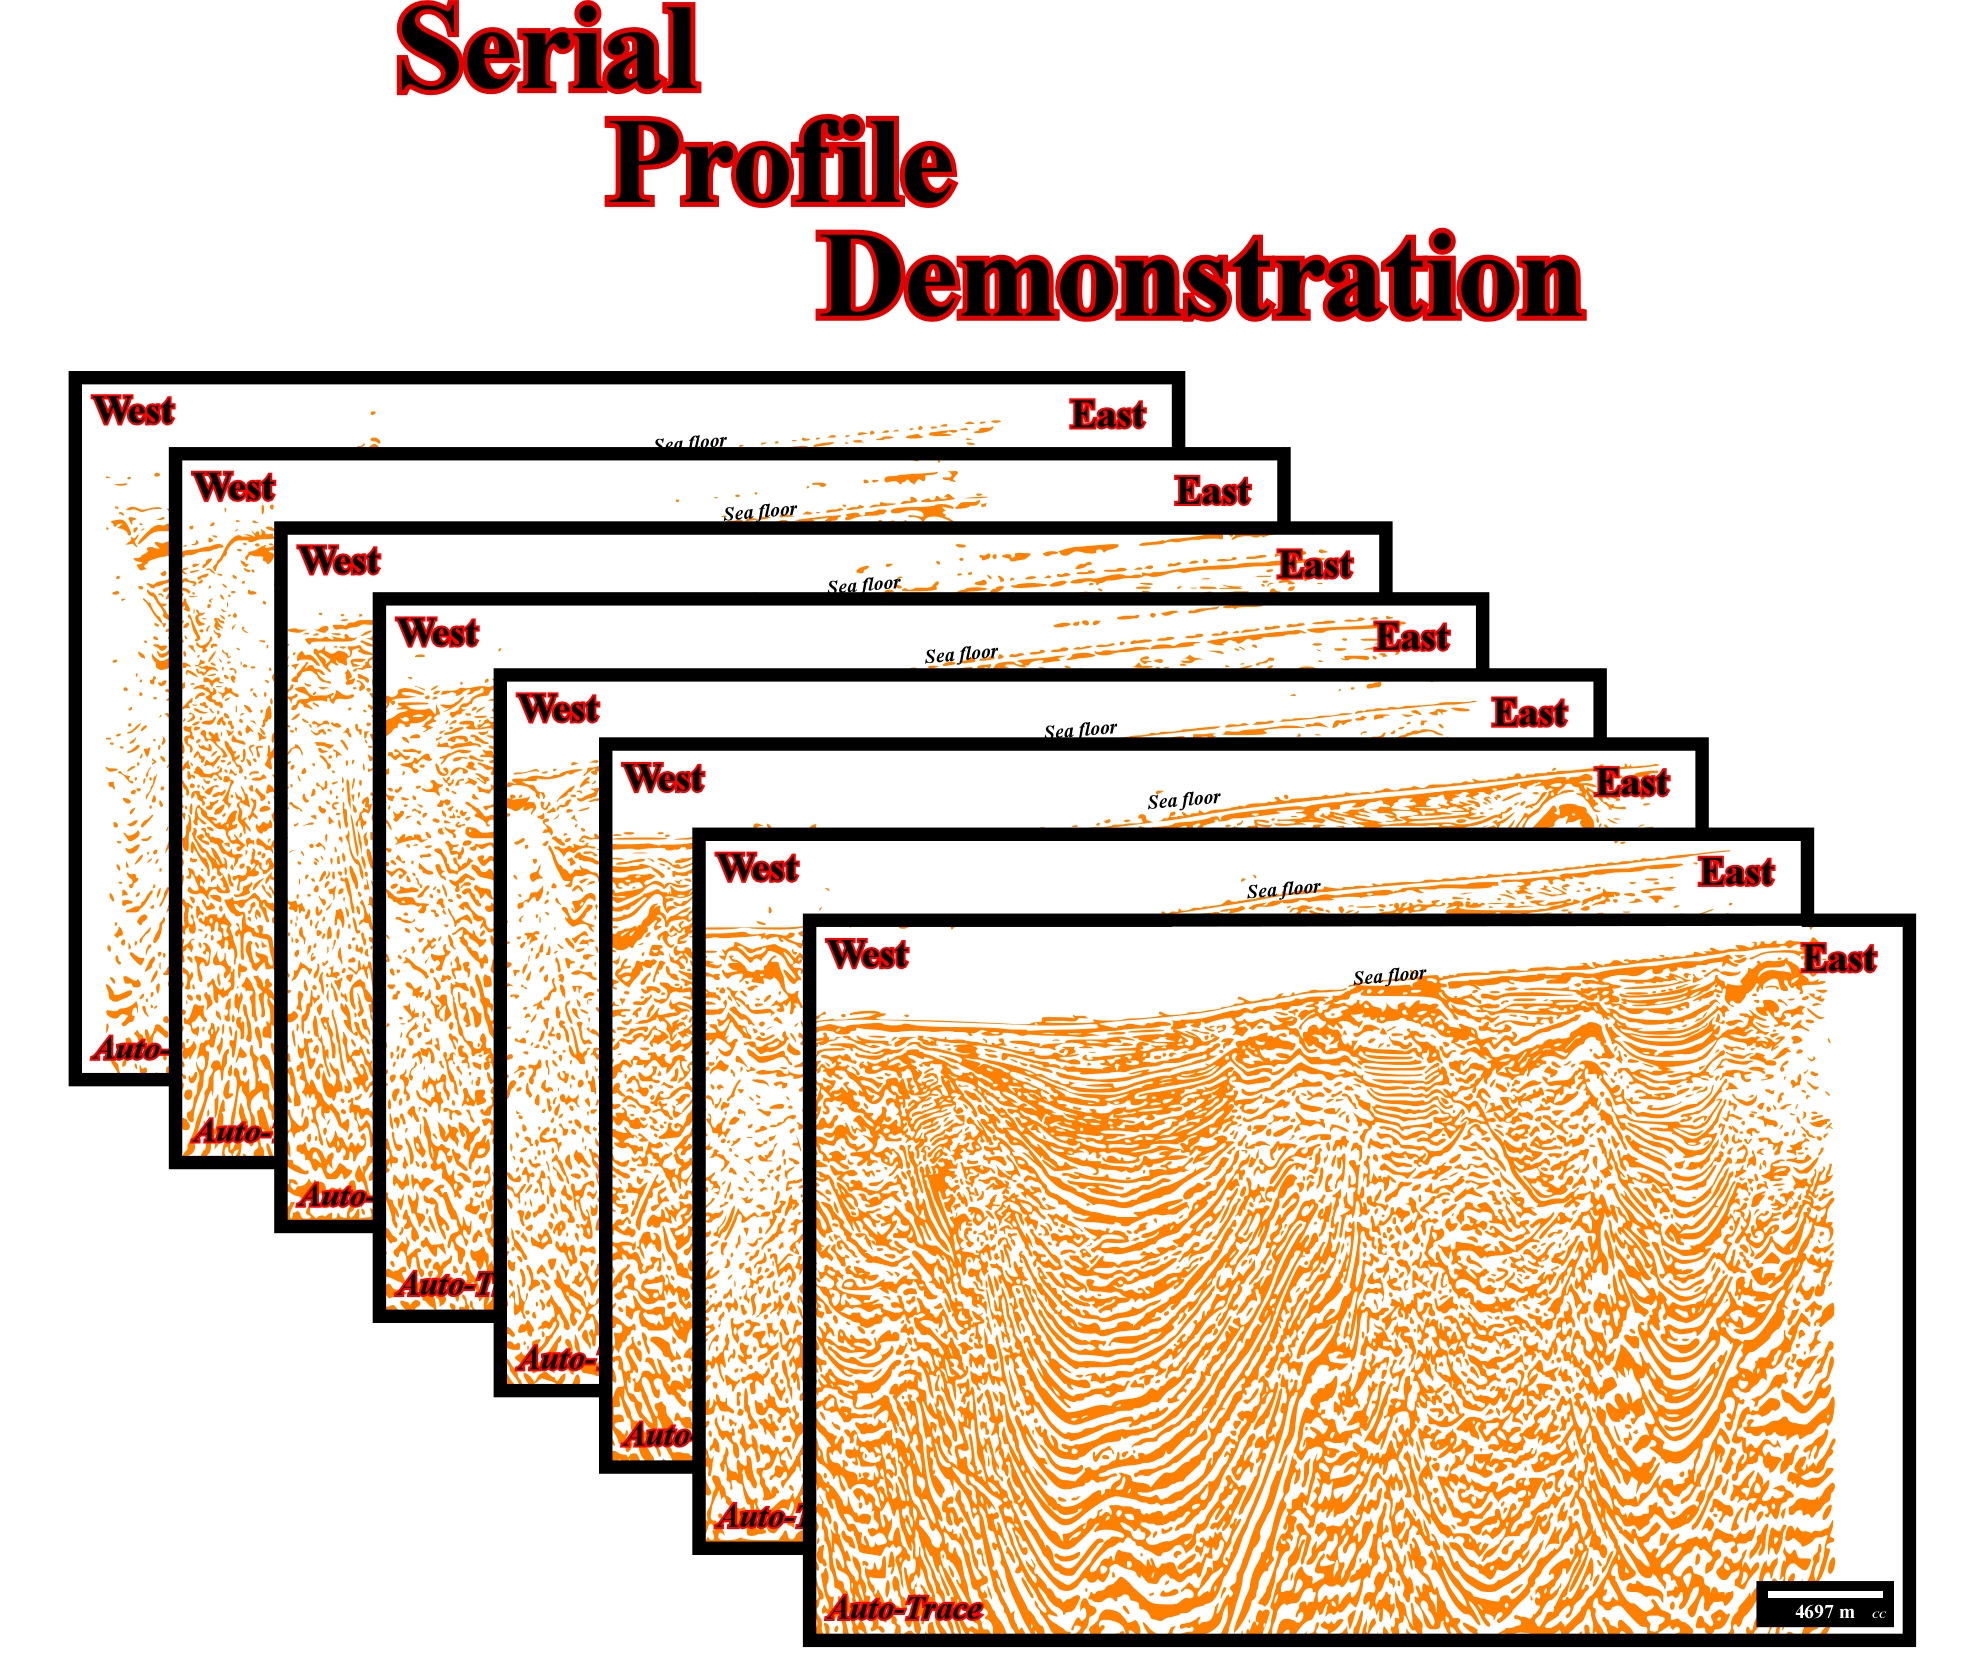
Fig. 349- A series of Canvas autotraces of Angola offshore seismic lines allows to better understand the spatial evolution of salt structures present in the area illustrated by the Canvas autotrace of the 4.5 seconds time slice (fig. 350). Take into account that for confidential reasons the time vertical scale was omitted.
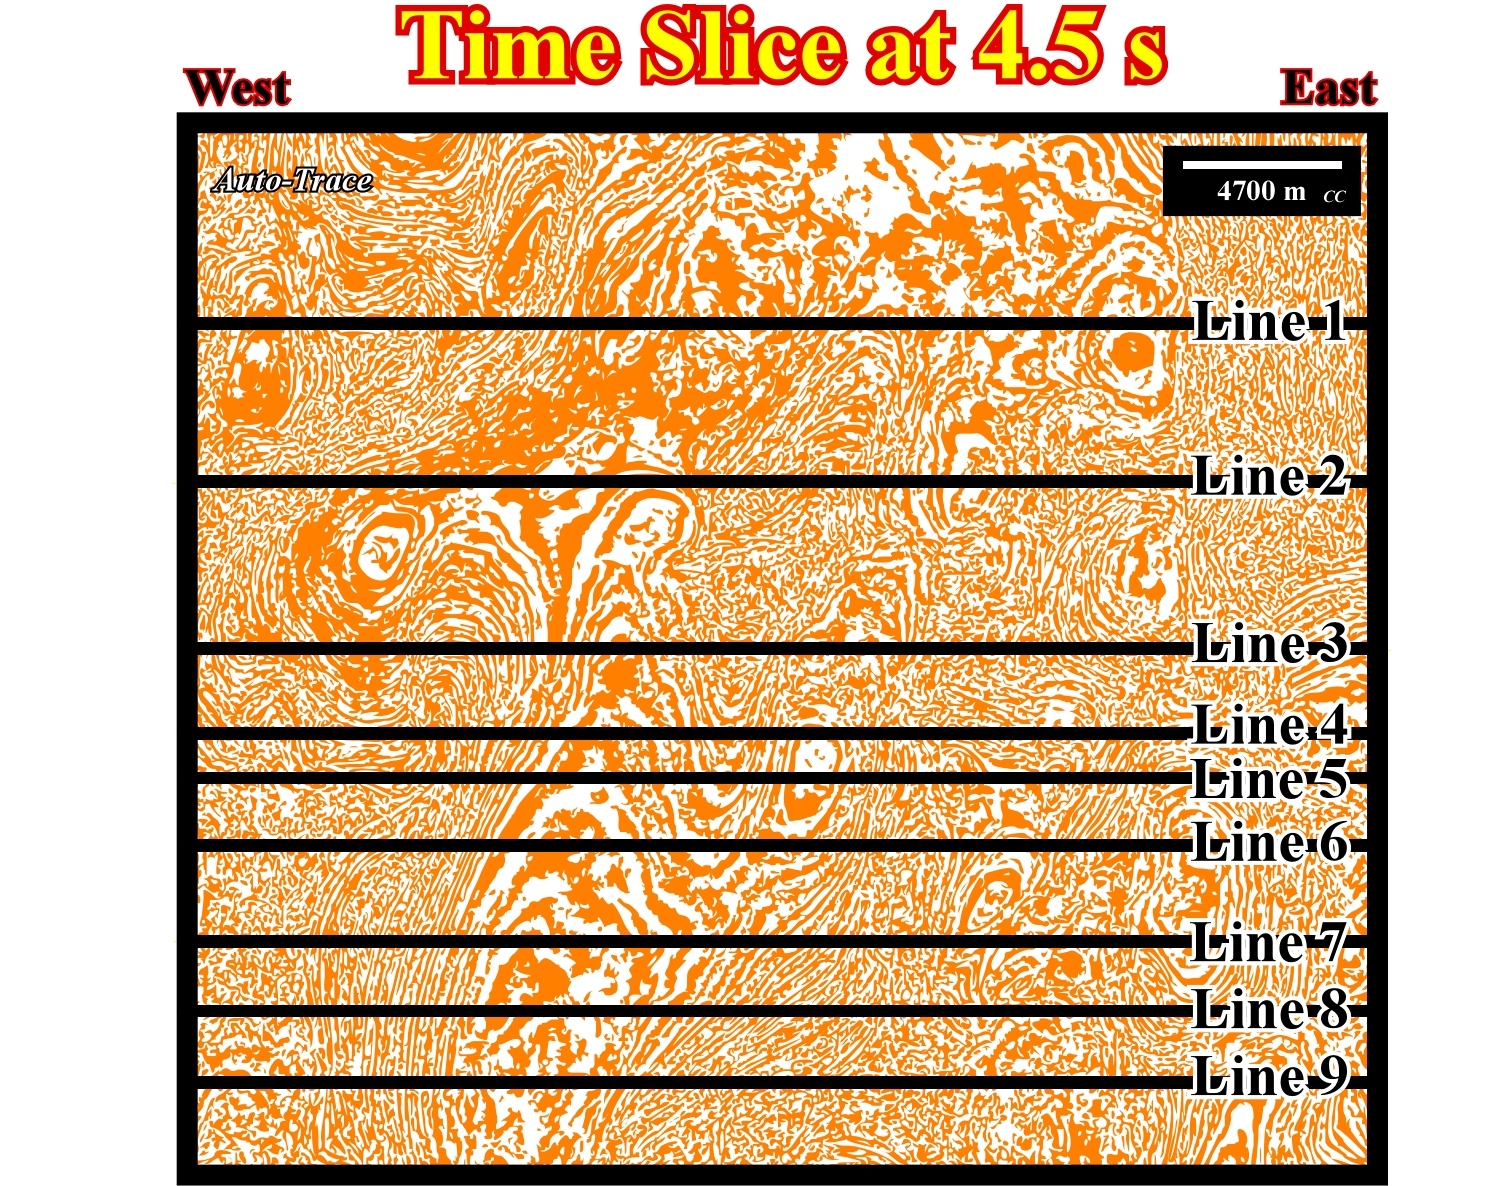
Fig. 350- The autotraces of the seismic lines are, here, located on a Canvas autotrace of the 4.5 s depth time slice, which represents the are under study. The spacing between the autotraces of the seismic lines is variable to better recognize different structures of the cover (sedimentary pile above the infra-salt strata including both salt and overburden). Synforms, antiforms, turtle-back structures, etc., are recognize in the overburden, as well as, autochthonous and allochthonous salt, salt and fault welds, stems, bulbs, detached salt stocks, etc.. On the following Canvas autotraces of the seismic lines, try to propose a tentative geological interpretation for each using the data of the time slice that you must localize on the line autotraces. The captions of each figure can probably help you.
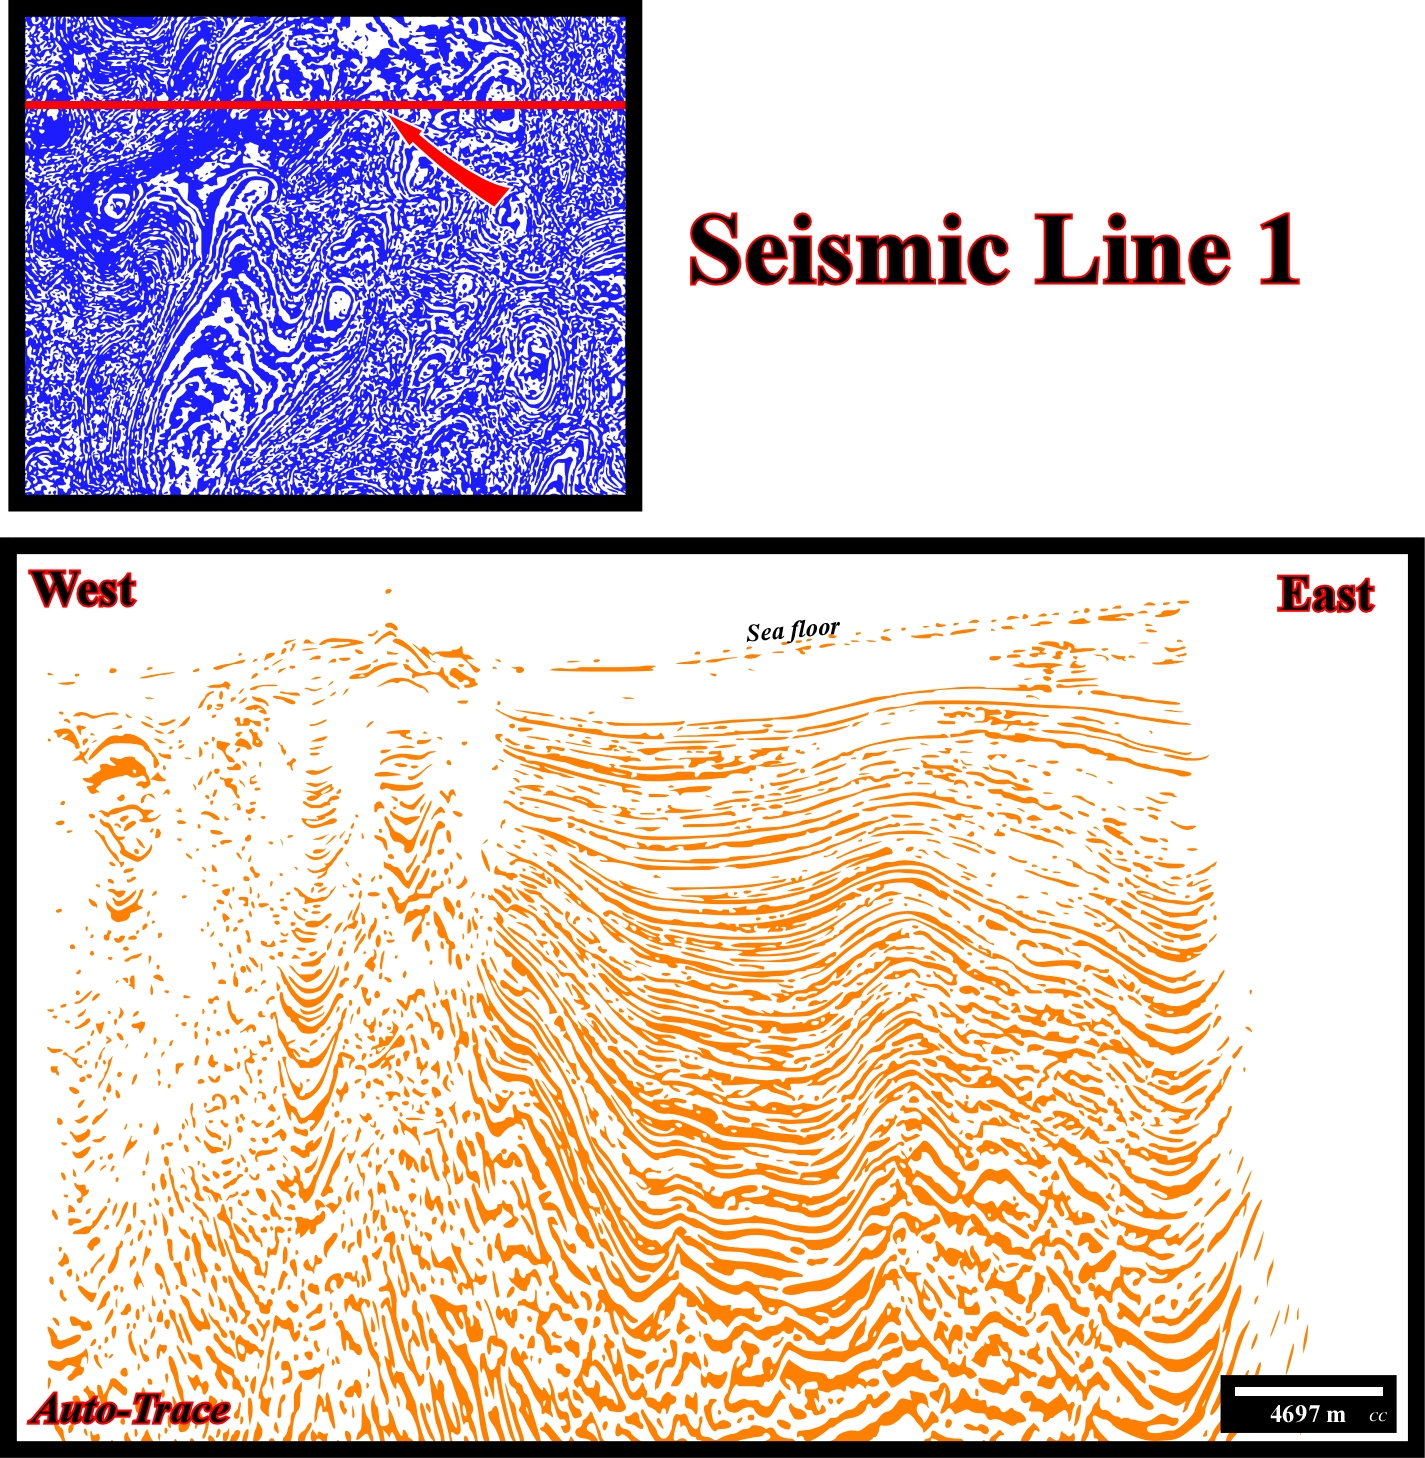
Fig. 351-The stacking onlap surfaces and the internal configuration of the different seismic intervals illustrate how the salt movements were preponderant in the creation of space available for the sediments. The salt movements seems to be the counterbalance of an up-dip extension.
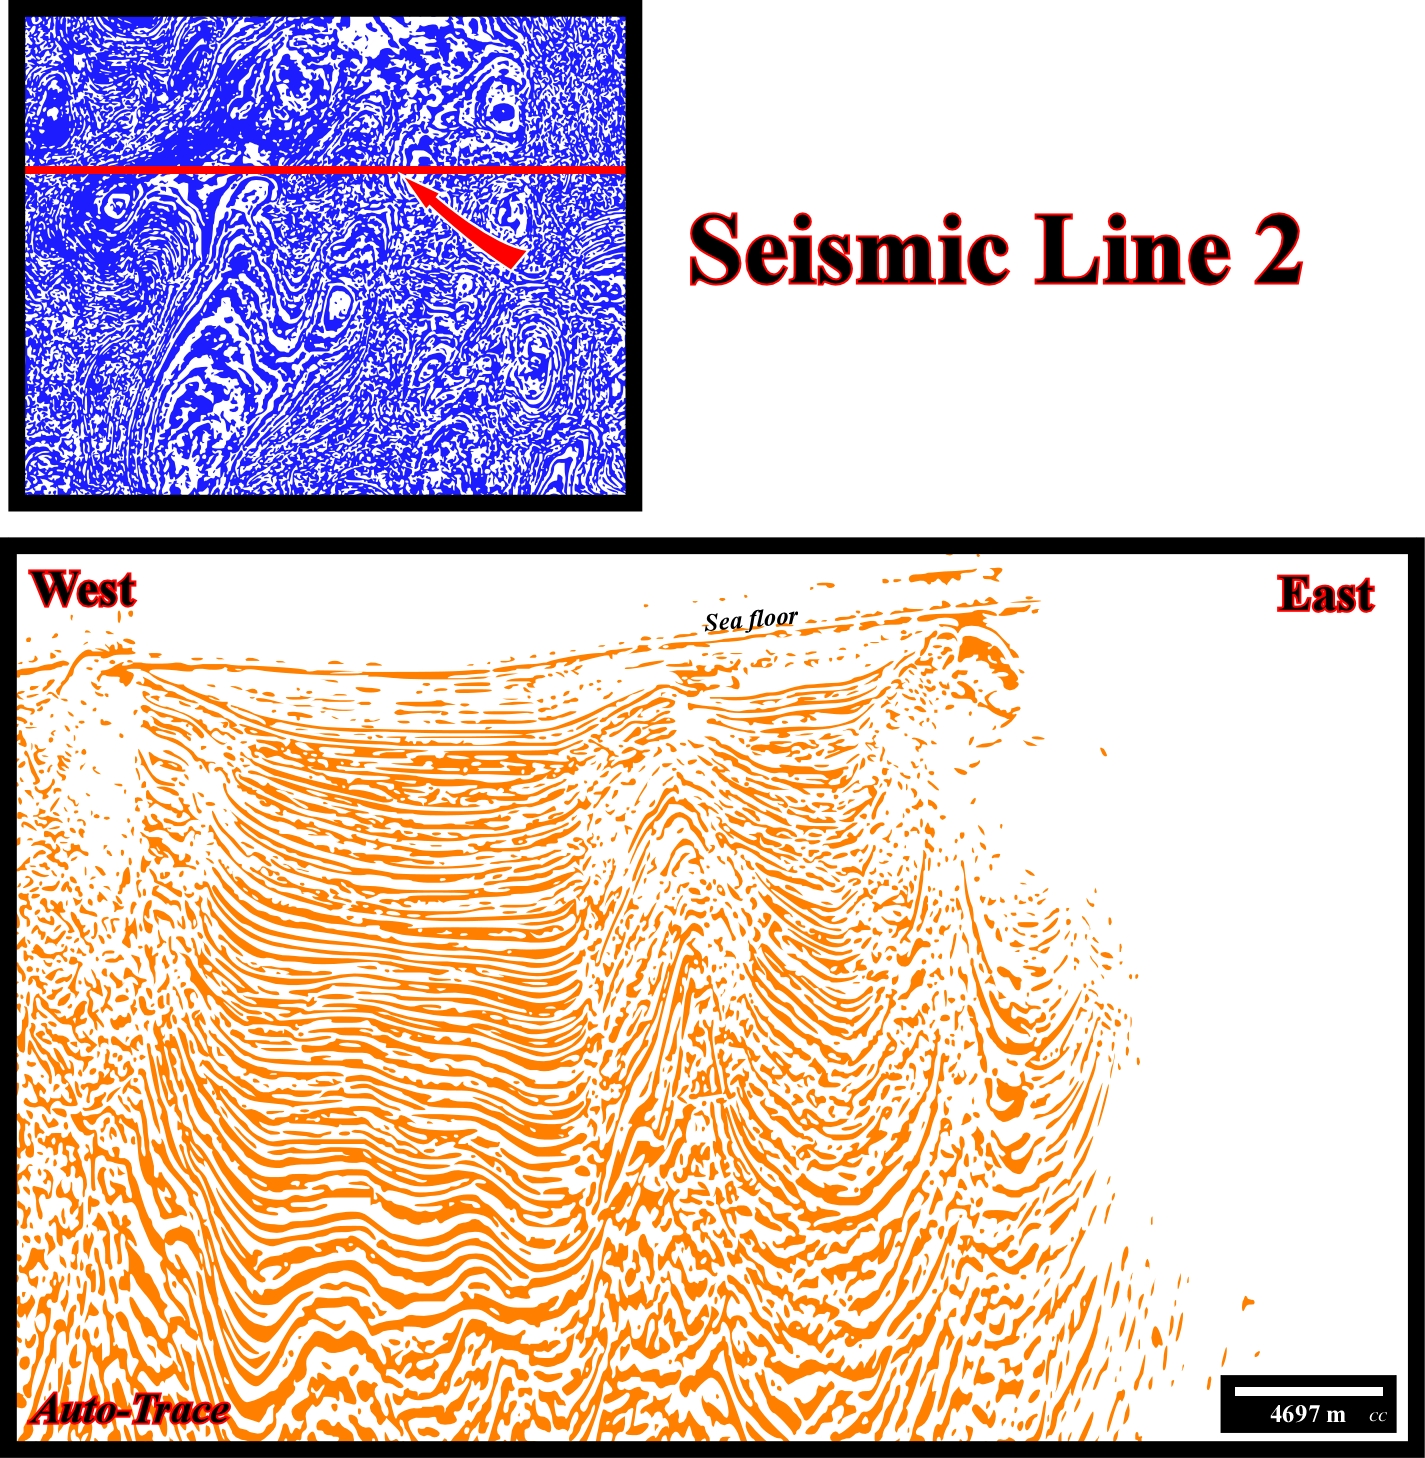
Fig. 352- The bottom of the autochthonous salt seems to dip seaward. Two depocenters with opposite vergences (opposite thickening) are likely. A detached salt stock is evident. A glacial salt flow is possible.
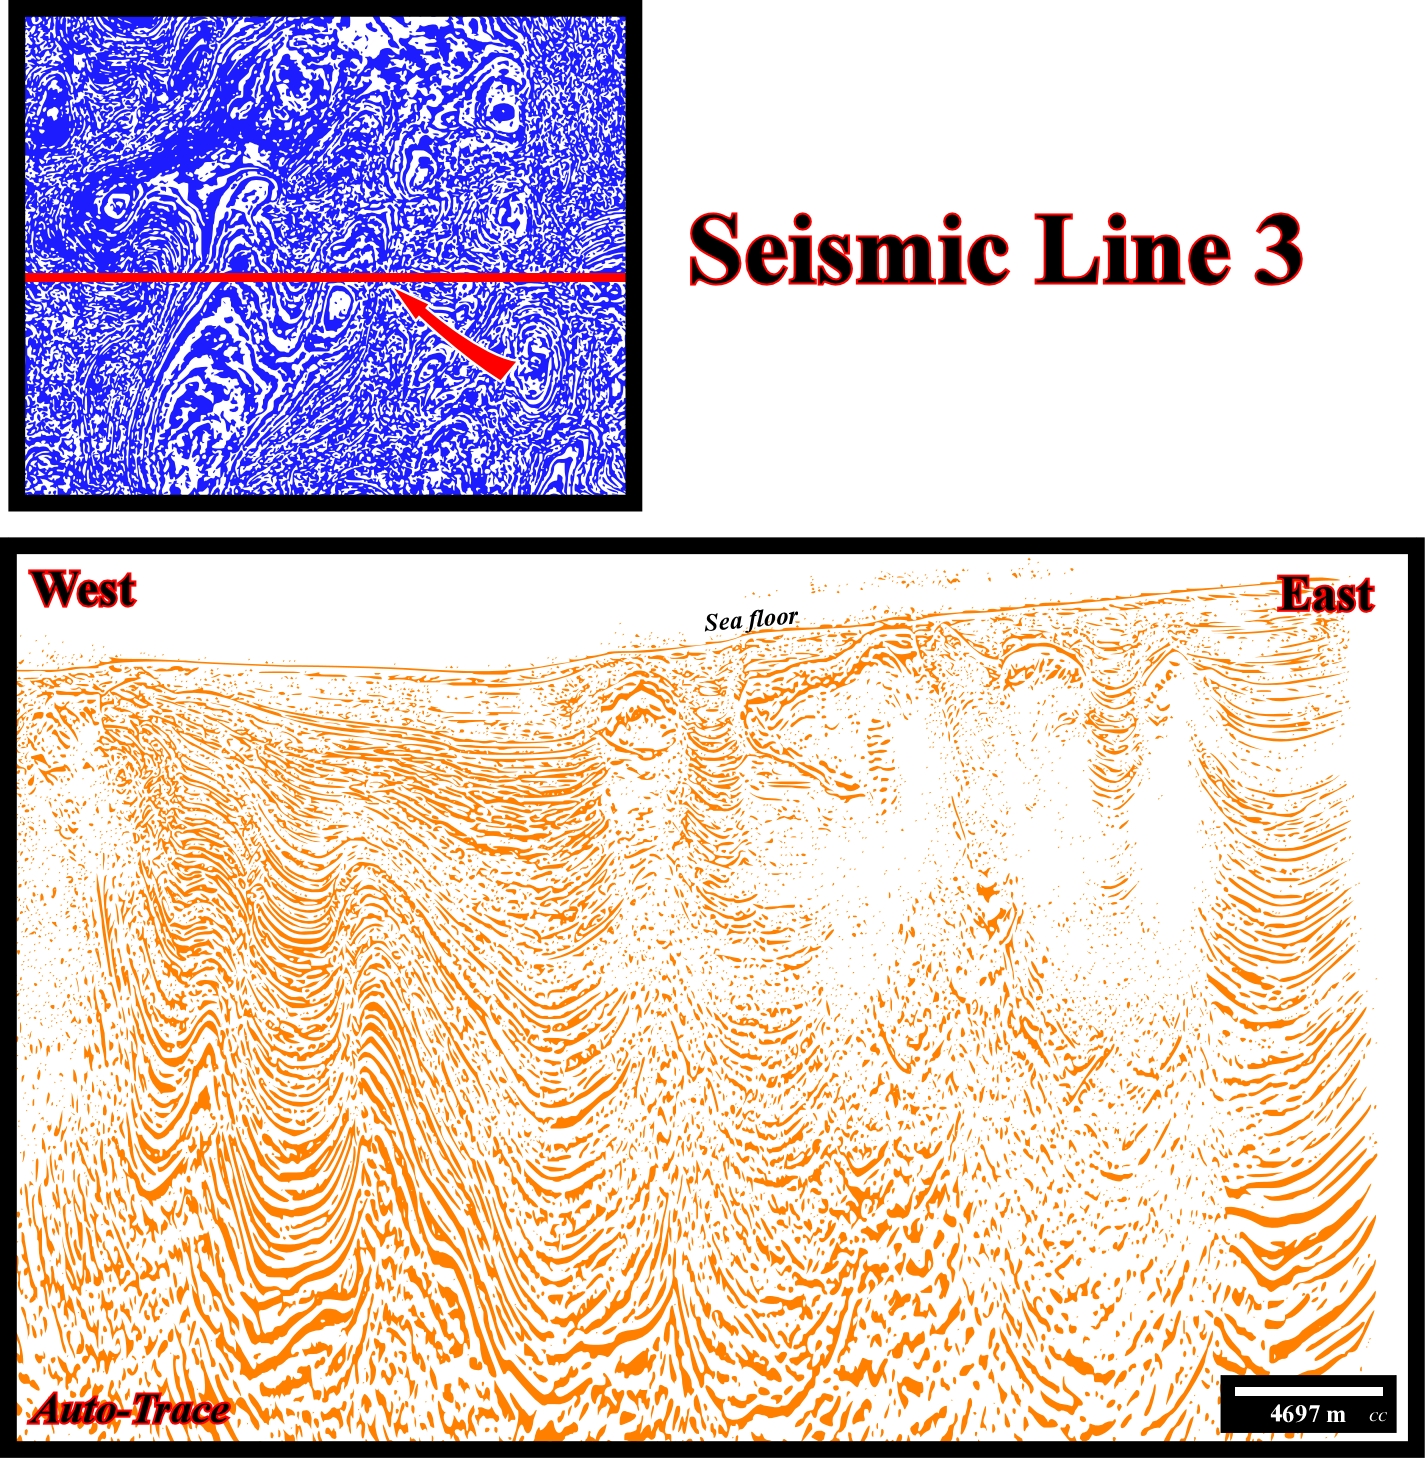
Fig. 353- Secondary salt well associated with a detached salt stock is quite evident. A quite mature salt wall canopy with synform sutures is likely. Reverse fault welds suggest a compressional tectonic regime.
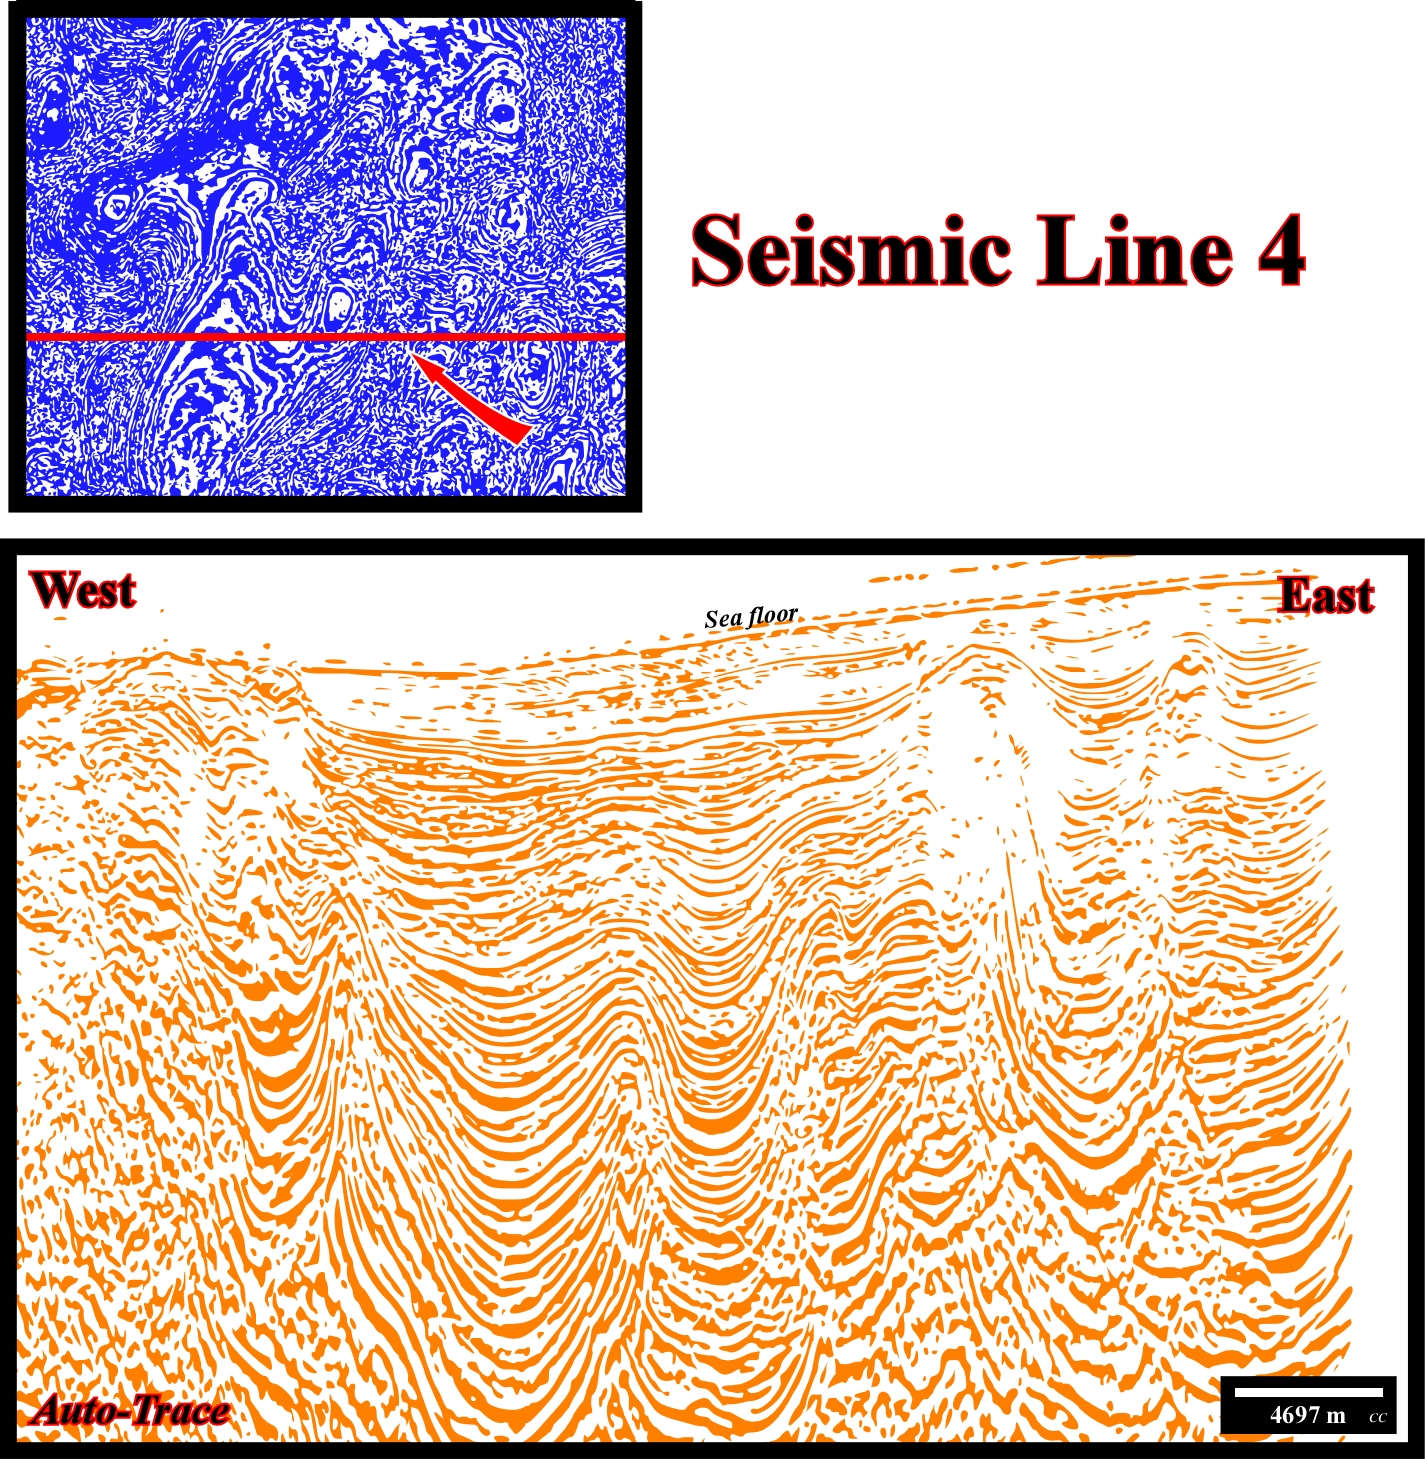
Fig. 354- Here, subrosion is possible as well salt glaciers. Squeezed diapirs are often found in Angola offshore in depocenter bounded by important diapiric structures. Turbidite deposits can fill depressions induced by compensatory subsidence.
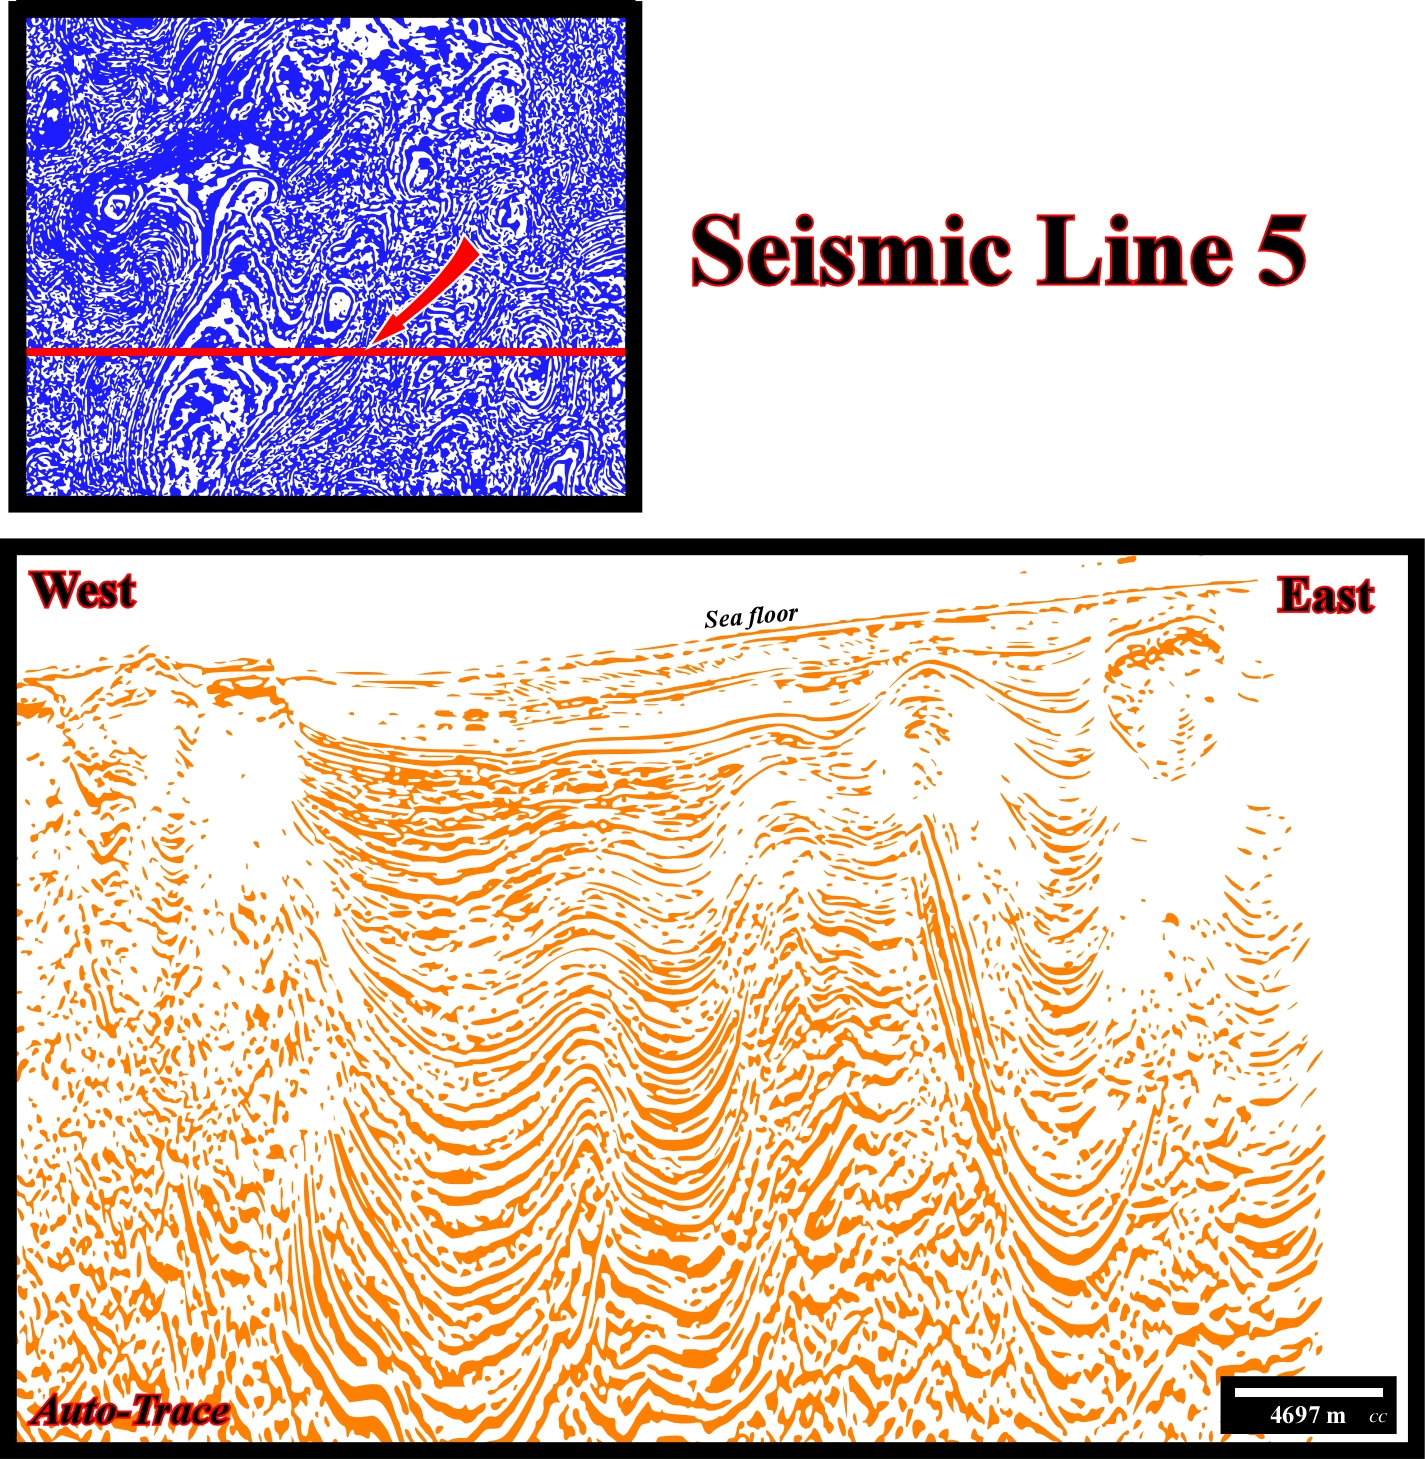
Fig. 355- The reactivation of old fracture zones (zone of fragility of the continental crust, which can favour the breakup of the lithosphere are often directly, or indirectly, associated with transform faults and changes in the rate of sea floor spreading), which often are responsible of steps in infra-salt strata. Fault welds seems associated with reverse faults with opposite. A salt sheet with small salt evacuation basin seems to be partial visible.
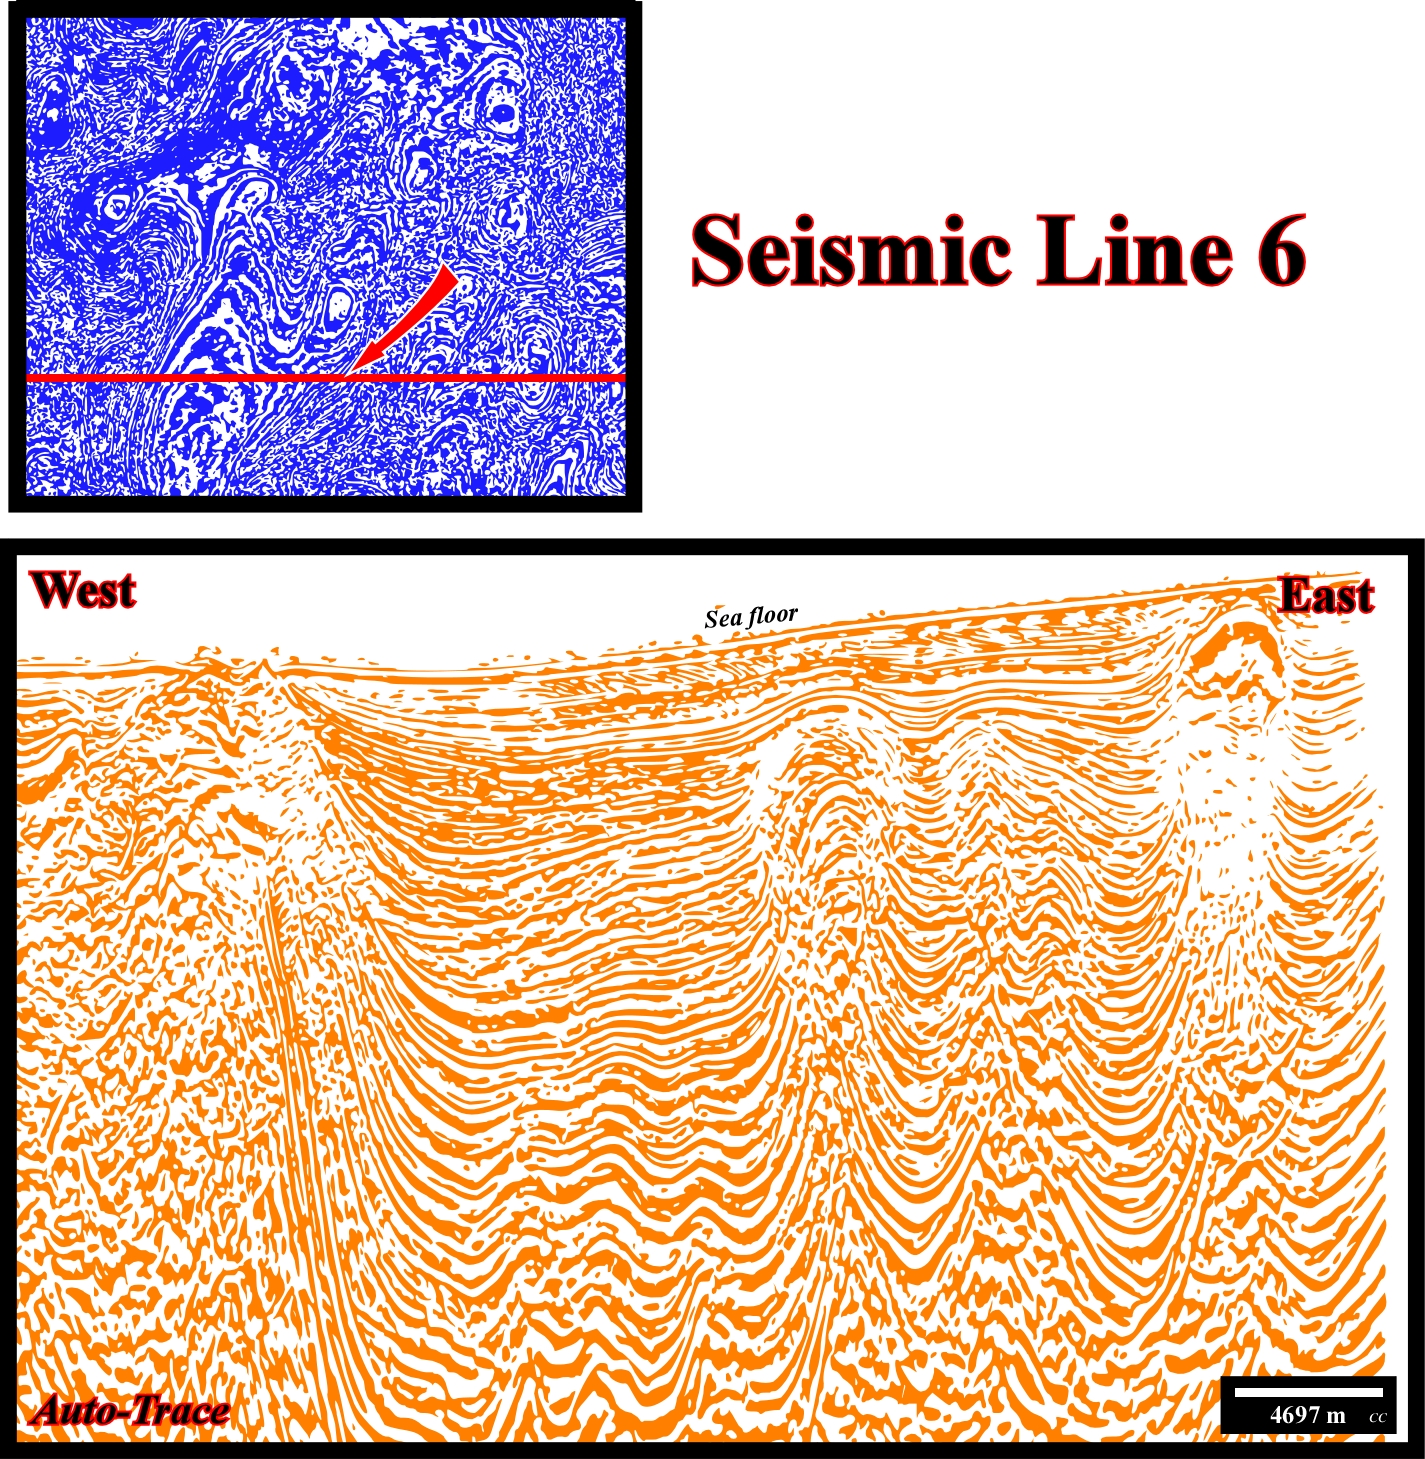
Fig. 356- An important salt ramp, belonging to growth-fault system, induced by salt evacuation, looking landward, is likely. It seems to connect the autochthonous salt with allochthonous salt of a salt sheet. Similarly, a detached salt stock and the bulb of a squeezed salt dome are easily recognized. Turbidite deposits are present.
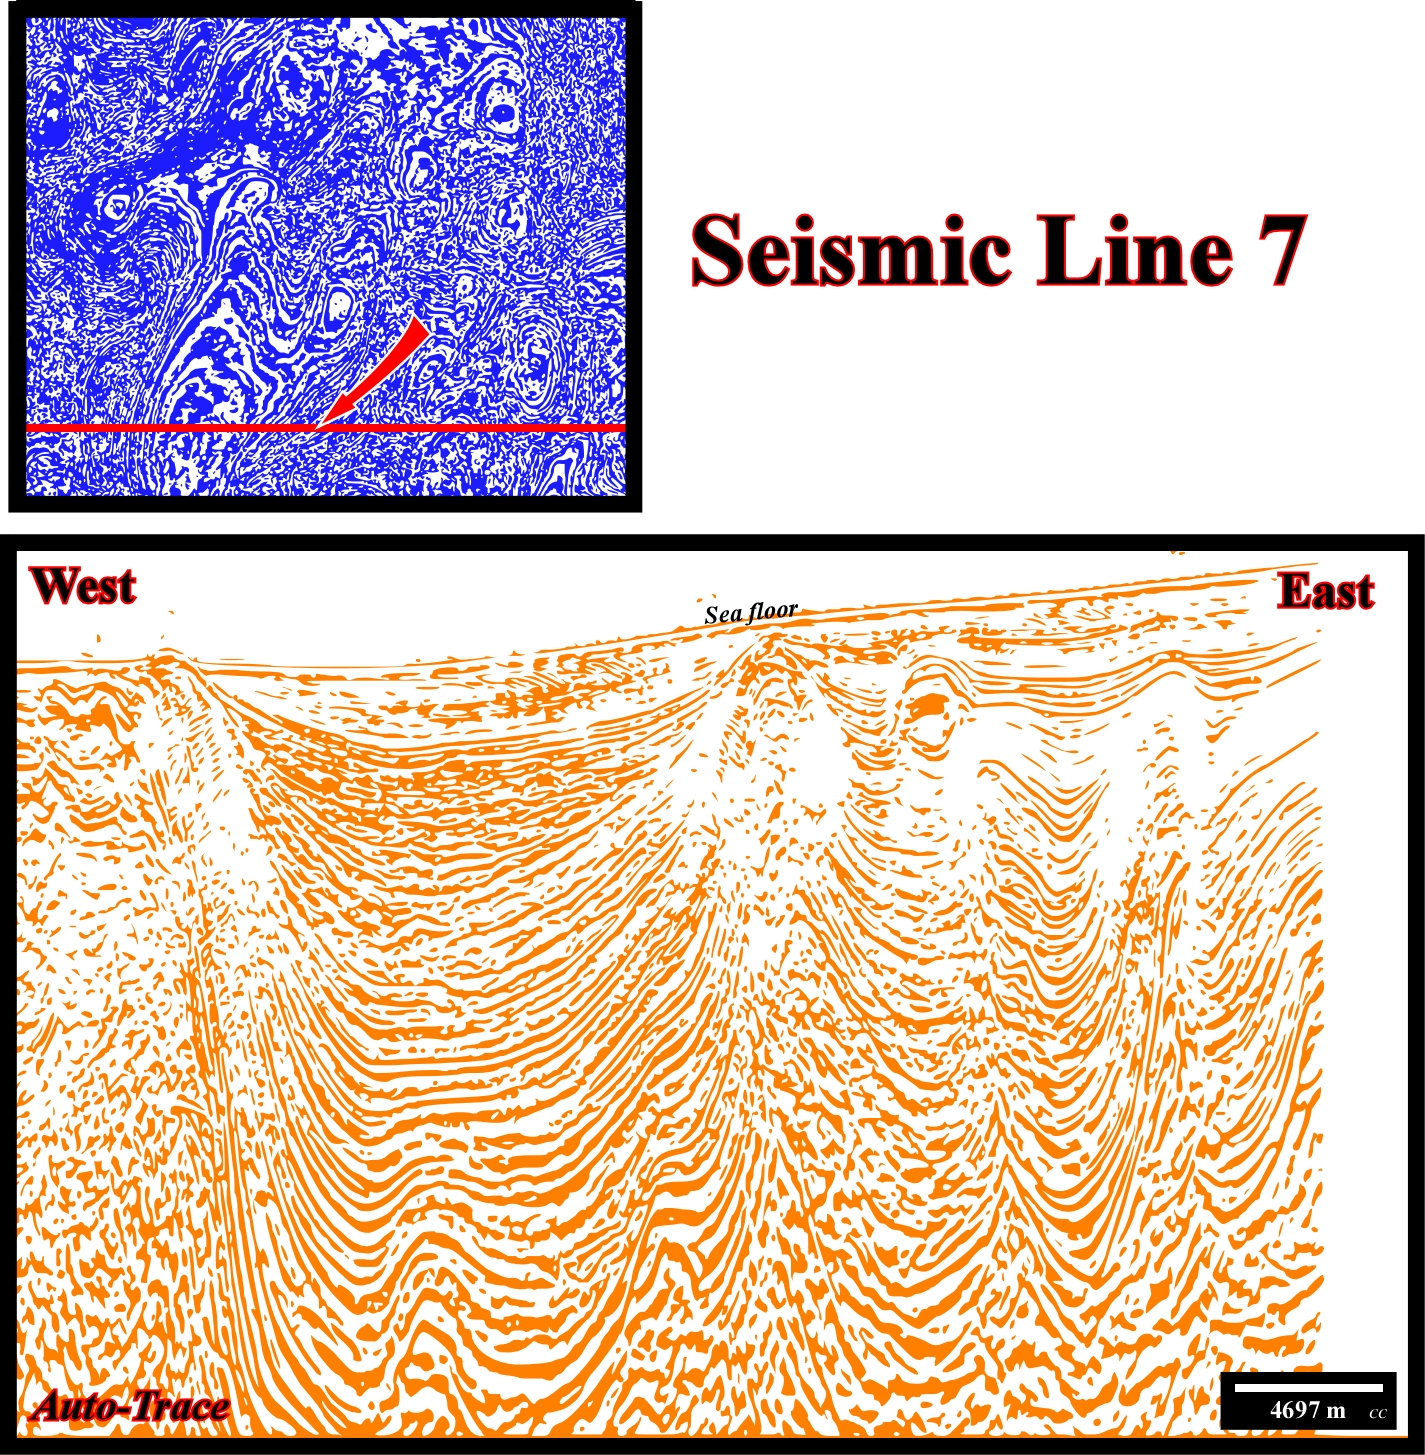
Fig. 357- Turbidite deposits are likely in a depocenter of the overburden located seaward of an important step of the infra-salt strata created by the reactivation of a old fracture zone. The feeder of a salt sheet, i.e., an allochthonous salt whose breadth is at least 5 times its maximum thickness is quite well visible.
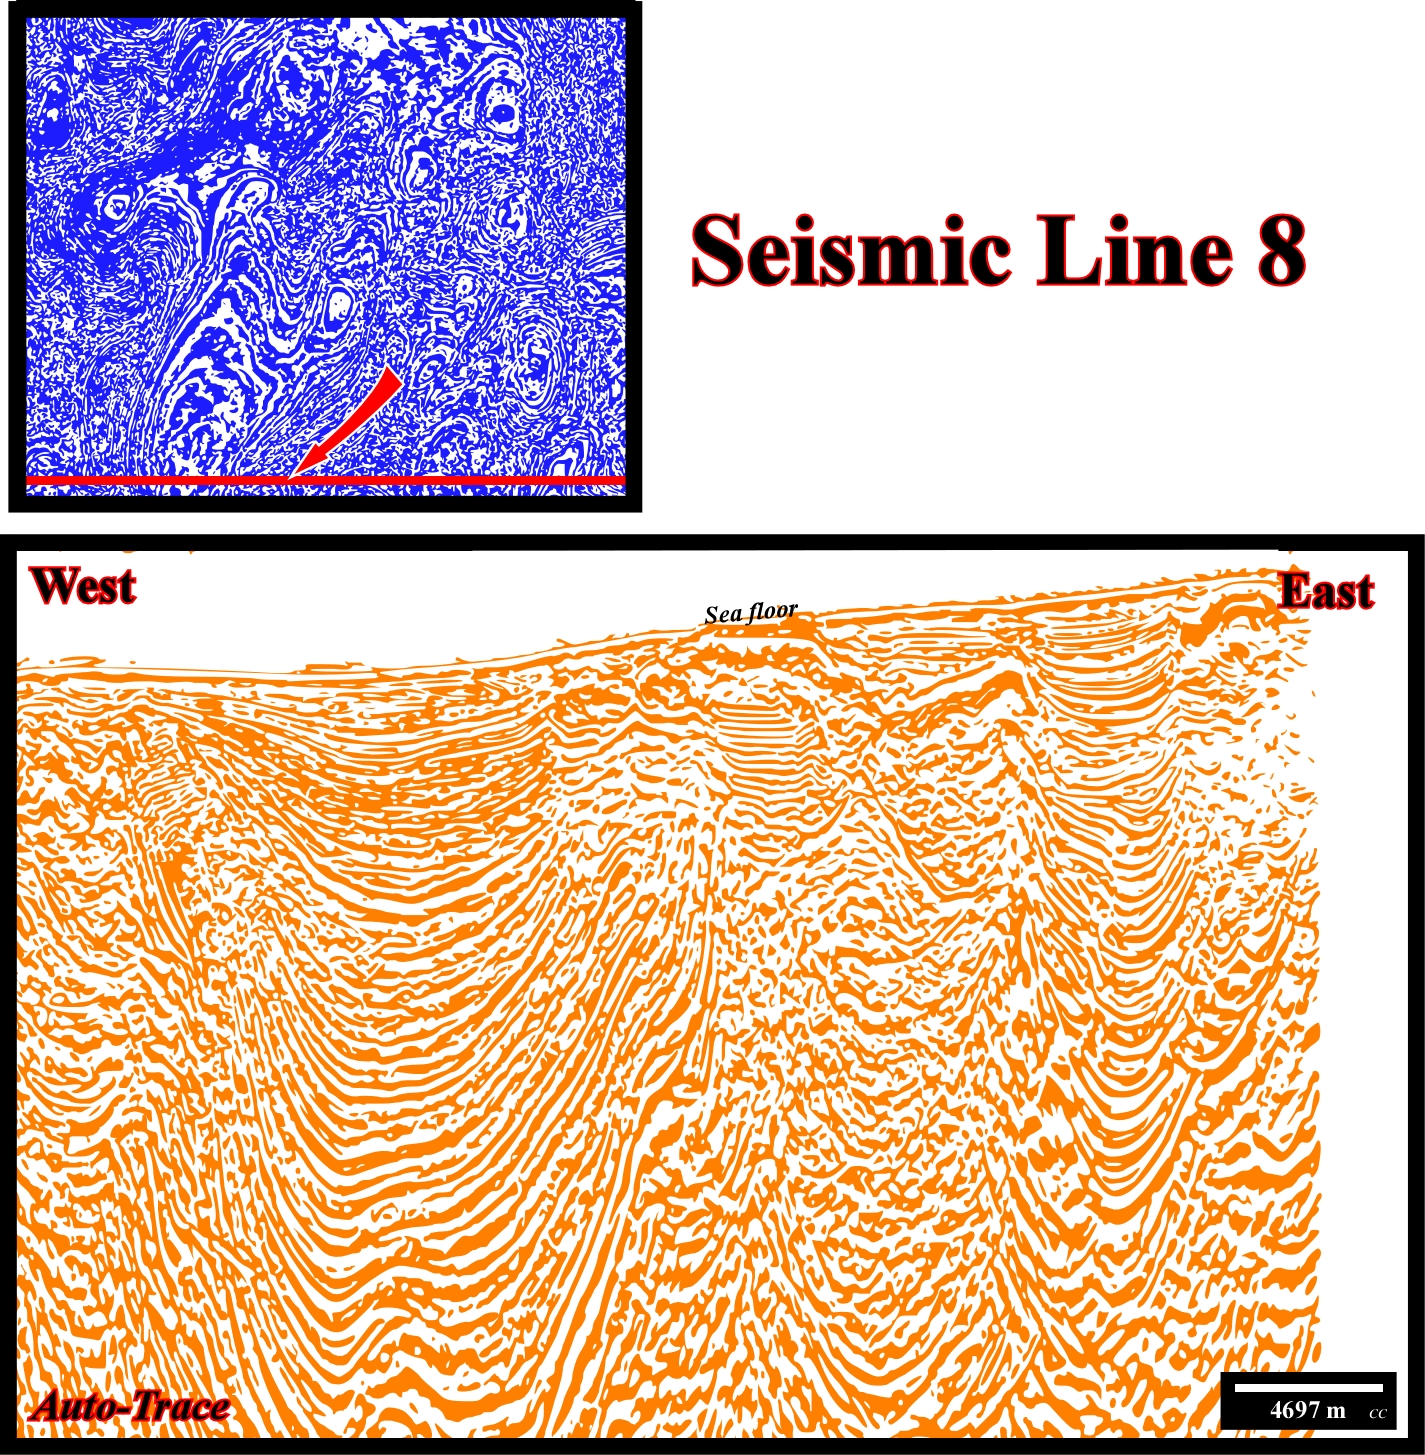
Fig. 358- The overburden depocenter located between the salt ramp that feeds the western salt sheet (partially visible) and step of the infra-salt strata is obvious. A complex salt wall canopy seems developed in the eastern part of the autotrace, in which anomalous amplitude are associated the top seismic marker. Such anomalous amplitude (cap rock ) is often created by the strong acoustical impedance generated by the impervious bodies of anhydrite an gypsum.
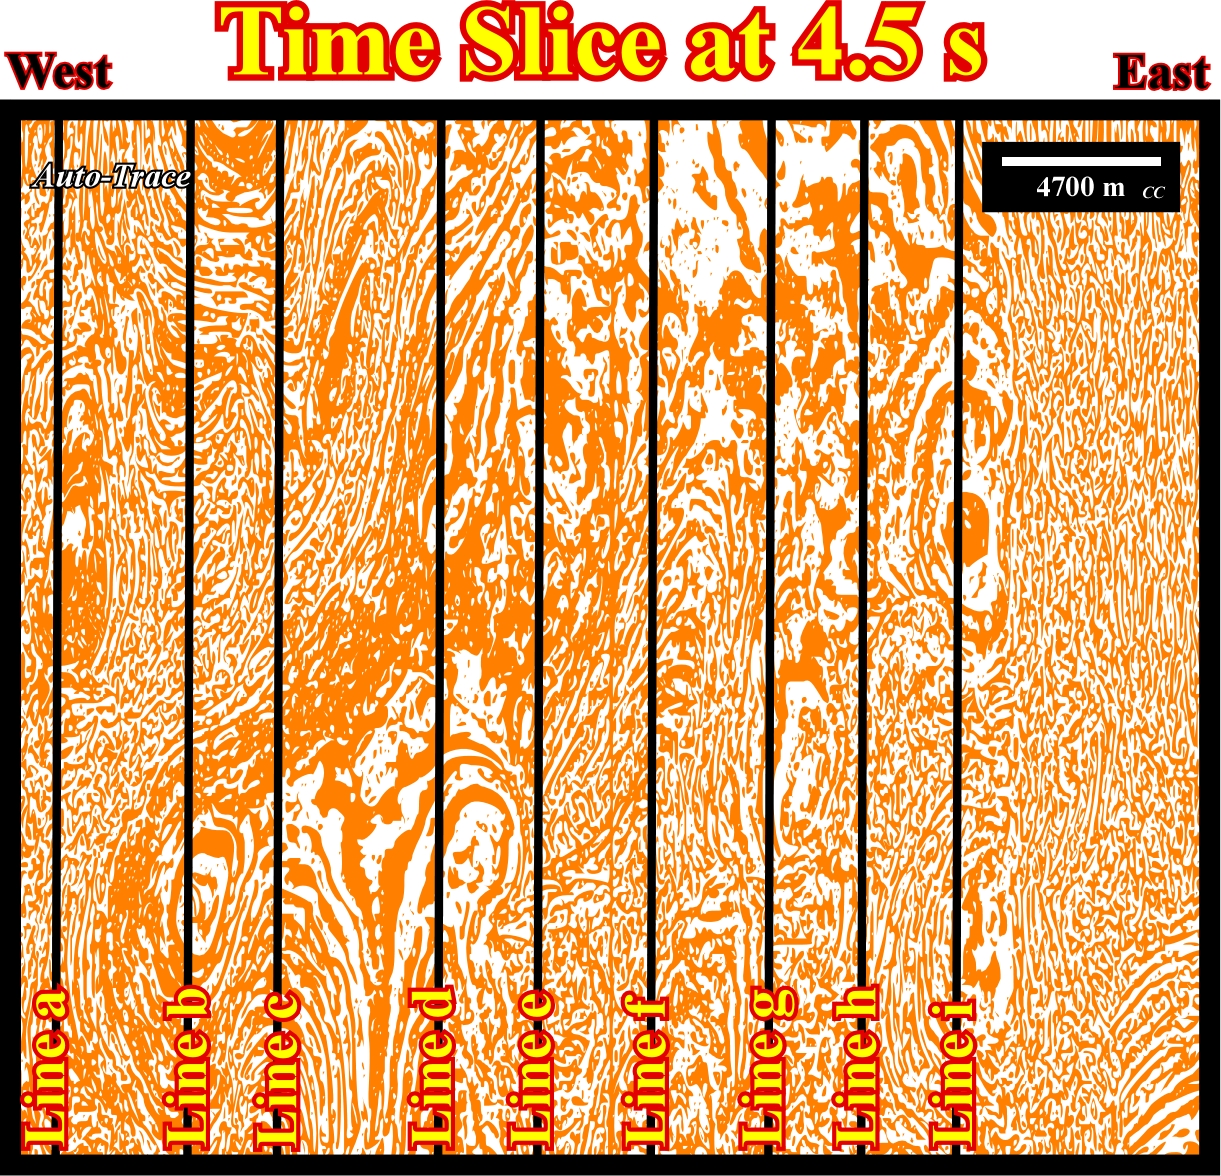
Fig. 359- On this Canvas autotrace of the time slice at 4.5 seconds are illustrated the Canvas autotraces of the N-S seismic lines intersecting the autotraces of seismic lines 1, 2 and 3 of the fig. 350. In the following figures are illustrated he seismic lines and their traces on the time slice. As an exercise you must propose the more likely tentative geological interpretation of the each autotrace and decide if they recognize all area of the time-slice area or just the yellow area.
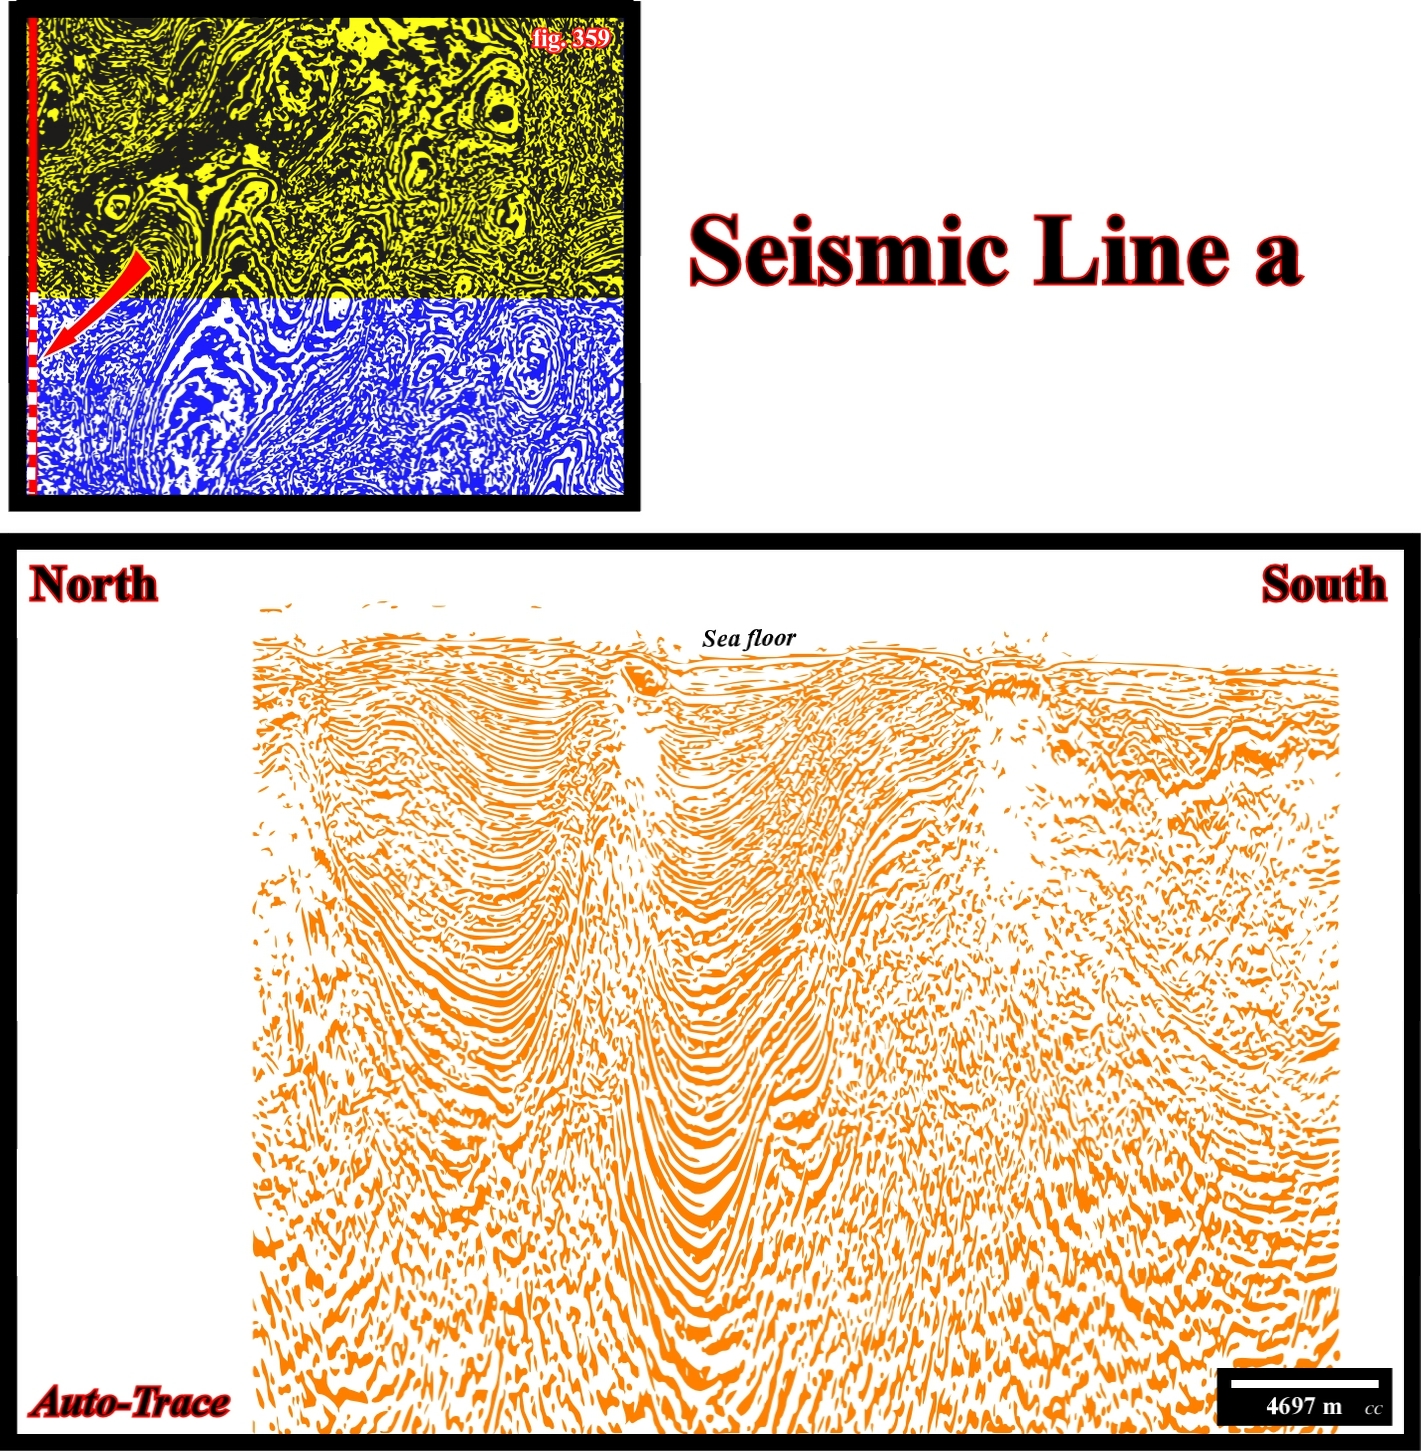
Fig. 360- Two large overburden depocenter separated by a diapiric salt structure are, easily, recognized. The southern depocenter is more important. On the southern part of the autotrace, shallow allochthonous salt is obvious. In spite of the fact that below the shallow allochthonous salt the seismic data is poor, a depocenter cannot be excluded. Take a look to the time slice. Remember you must decide if the autotraces of the N-S seismic lines are restrict to the the area coloured in yellow or not.
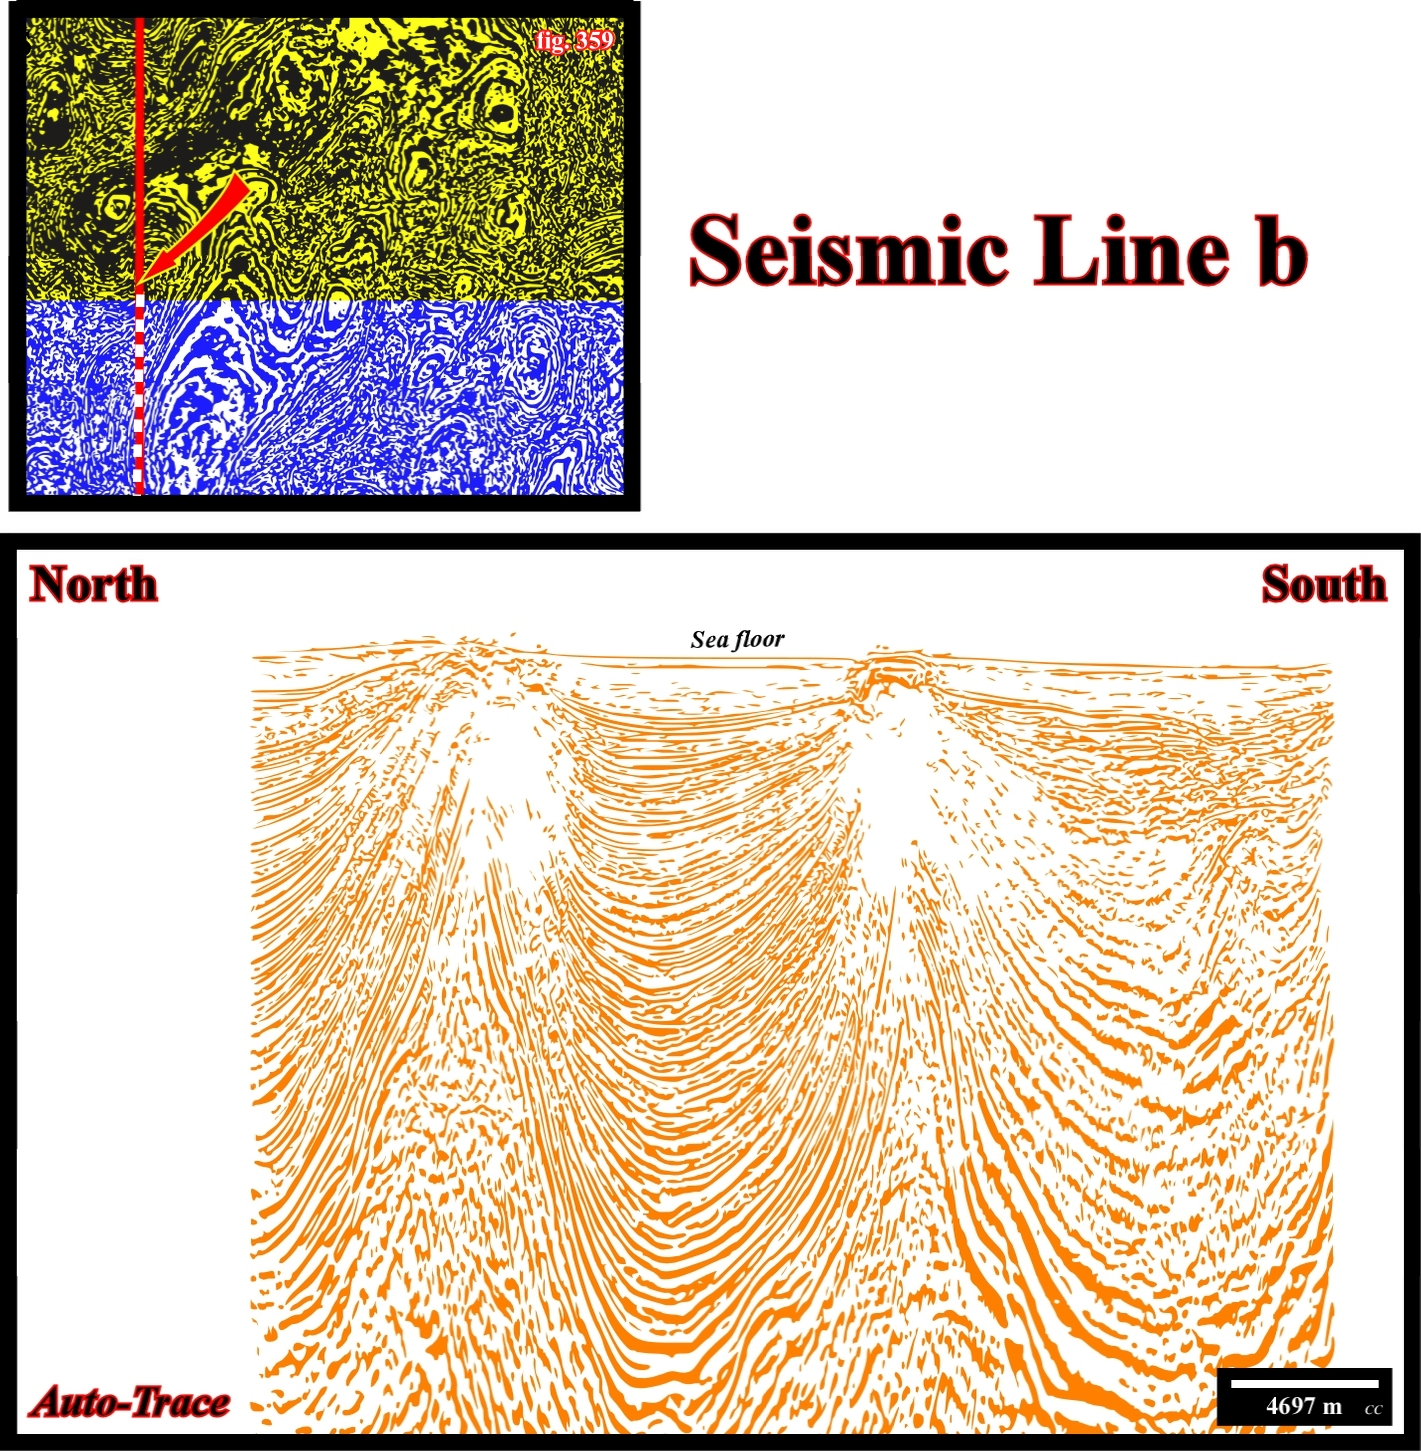
Fig. 361- Three overburden depocenters separated by two squeezed diapirs, with possible secondary salt welds associated, are obvious. The thickness of the depocenters seems increase southward. Onlap seismic surfaces within the depocenters suggest time interruptions in the salt movements.
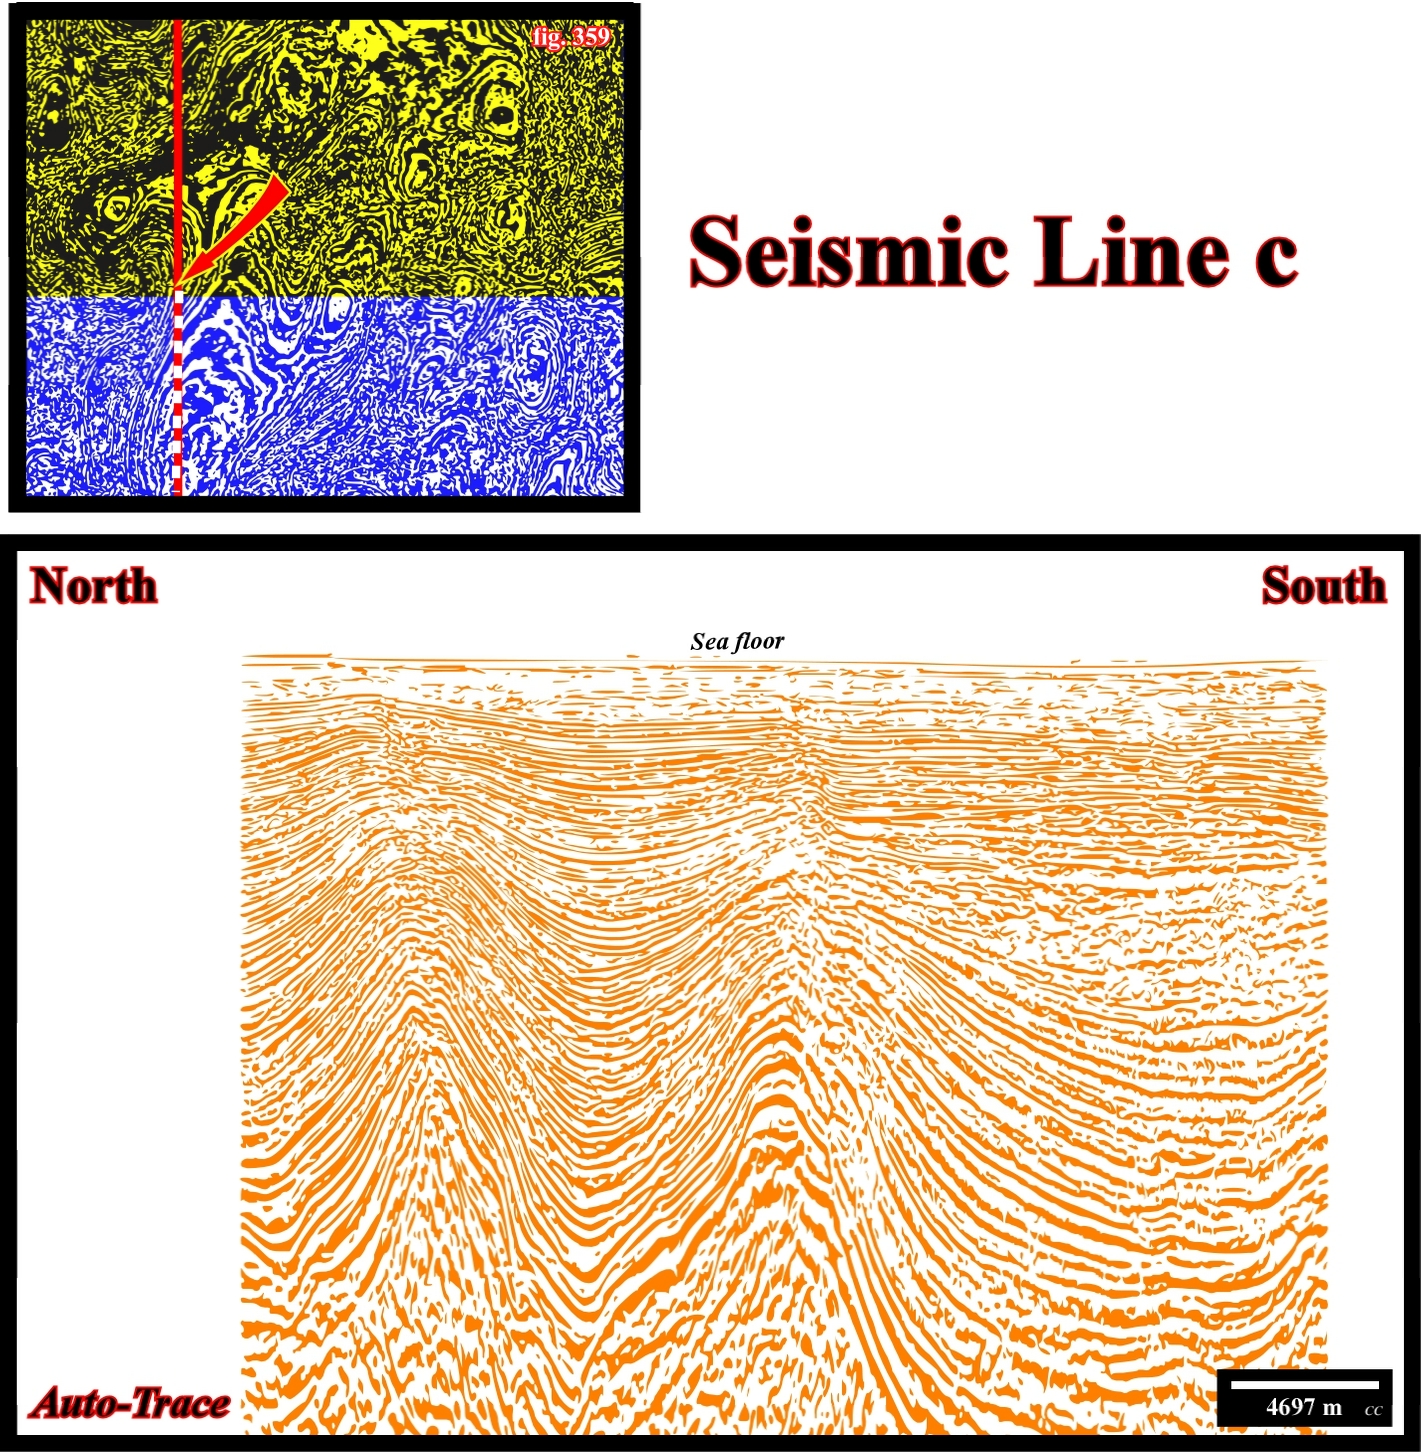
Fig. 362- The diapiric salt structure are, here, less intrusive. Normal faults are development on the top of the salt structure in order to accommodate the sediments to lengthening. Taking into account that the time slice is at 4.5 sec and on this autotrace shows clearly two diapiric salt structure you should not have major difficulty to decide what area of the time-slice the autotraces recognize.
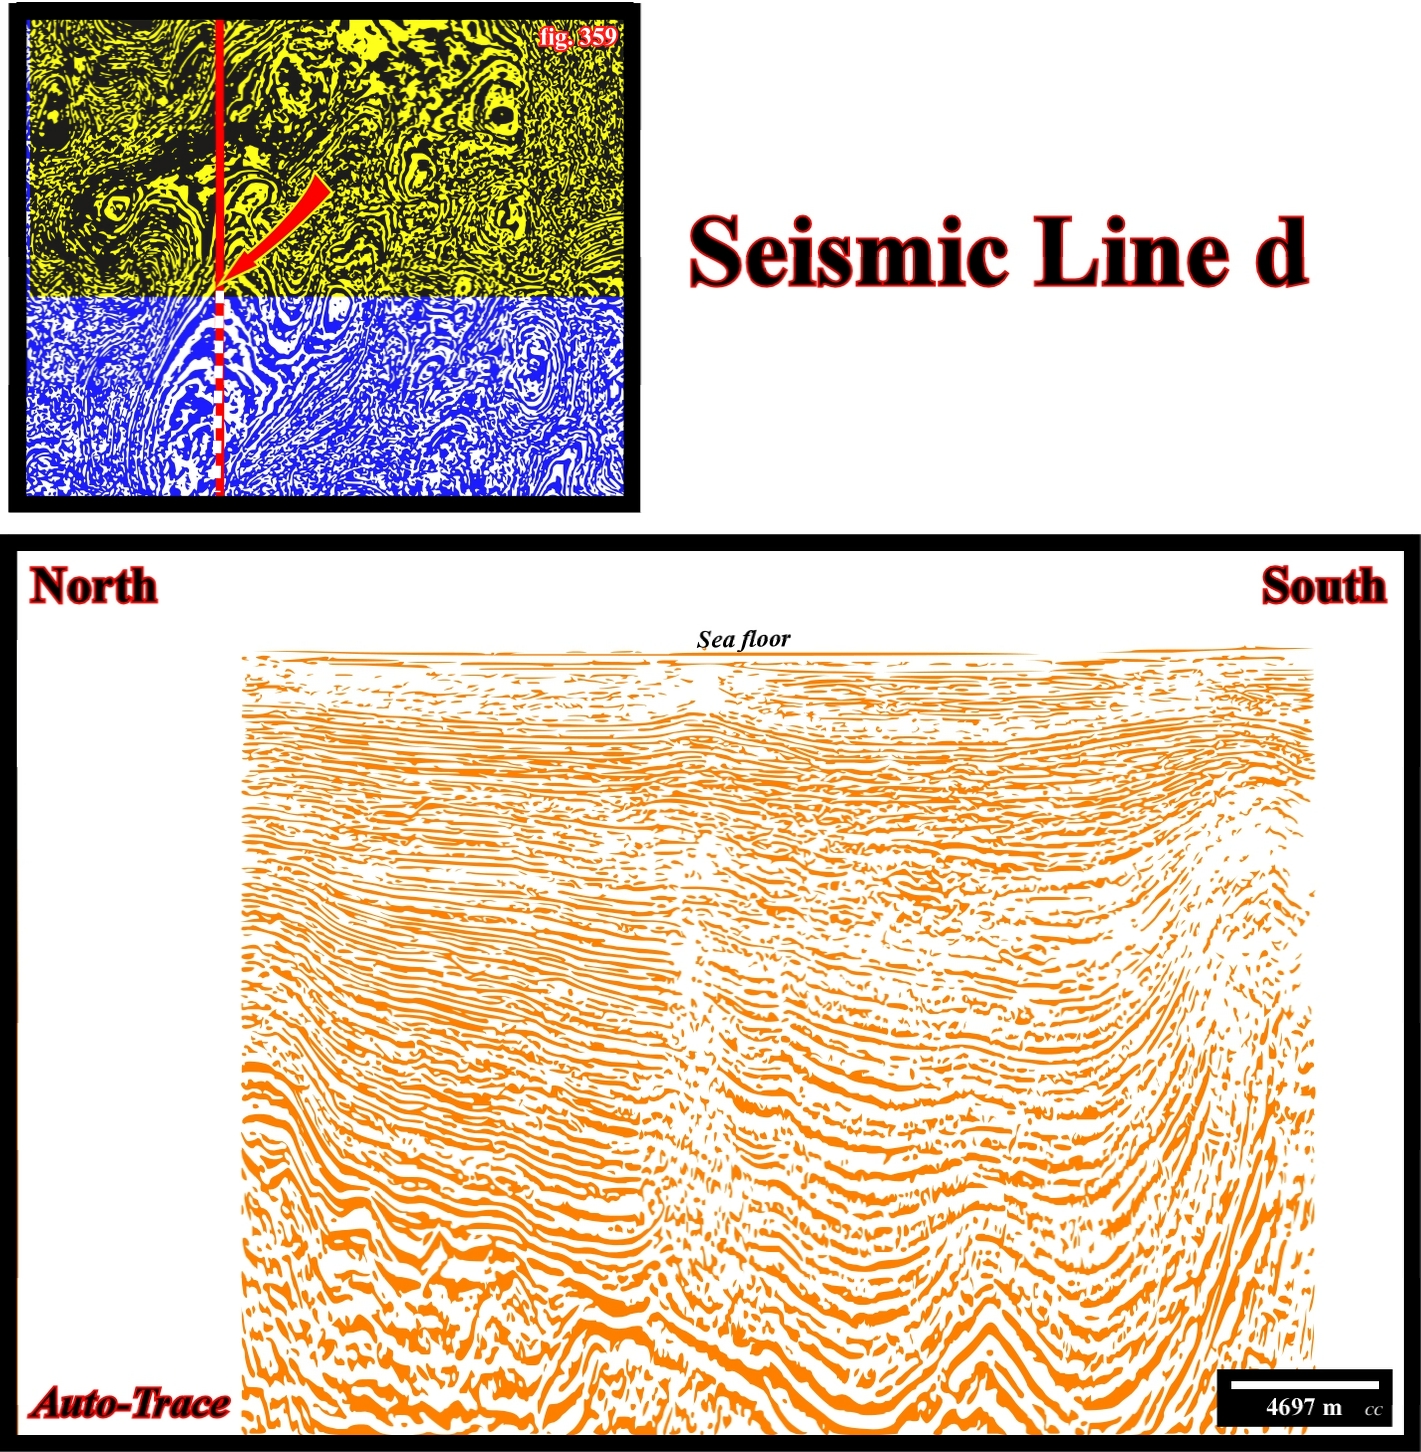
Fig. 363-The overburden thickens, on this autotrace, more or less regularly toward the southern diapiric structure which bulb deformed the overlying strata, i.e., lengthen them. The infra-salt strata and a thick autochthonous salt seem visible on the lower part of the northern sector of the autotrace. A small intrusive salt diapir appear near the southern diapiric structure. Notice the slightly overburden deformation induced by a vertical salt body, not far, probably eastward, from this autotrace.
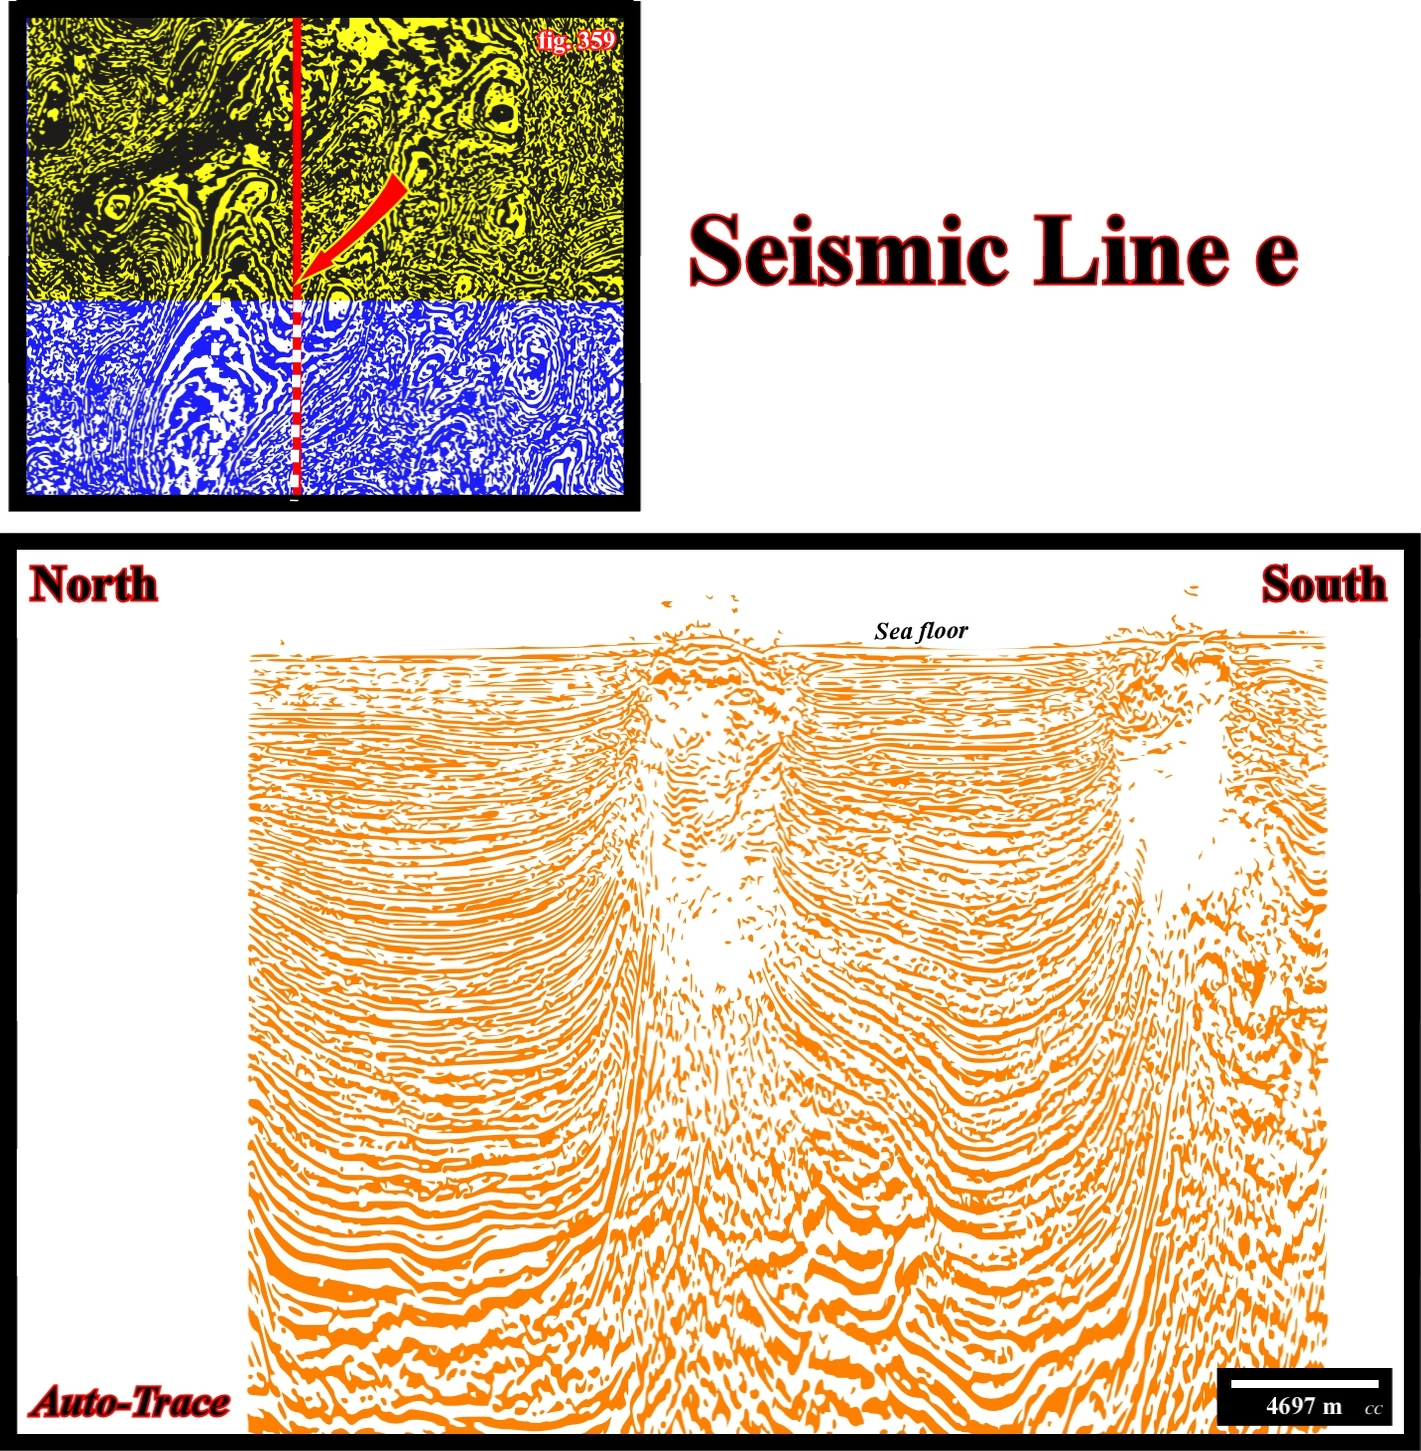
Fig. 364- Two salt drop structures (synonym of detached salt stocks), i.e., plug-like salt diapir with sub-circular plan-form detached from the mother salt layer are, easily, visible on this autotrace, one on the southern part of the autotrace and the other one in middle part. The location on the these salt structures on the time-slice will allow you to see what area of it the is recognized by the N-S autotraces of the seismic lines.
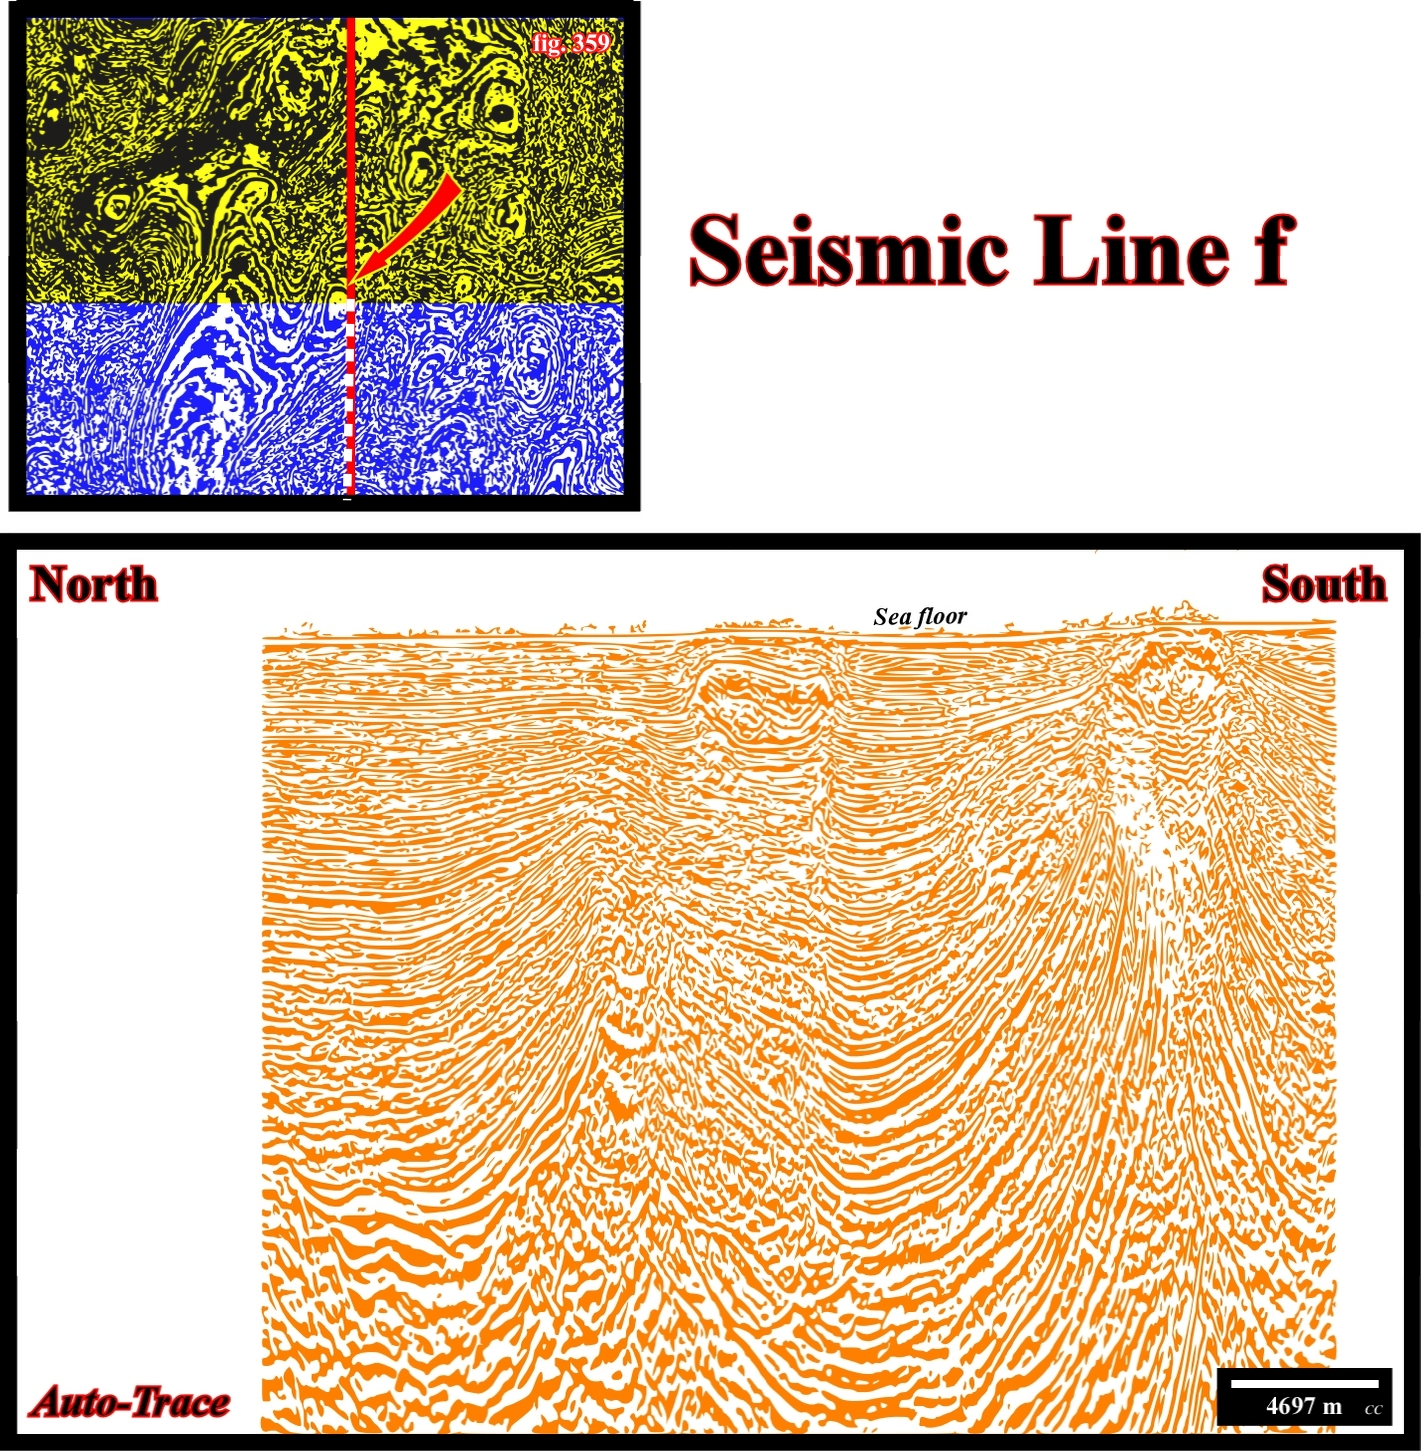
Fig. 365- Two detached salt stocks are, easily, recognized. The northern one is , probably, far away of the associated secondary salt weld. On the contrary, the stem of the diapir associated with southern detached salt stock is, still, recognizable. Two overburden depocenters area is recognized. The depth of southern depocenter is higher, what is the consequence of the compensatory subsidence induced by the northward salt flow of the autochthonous salt, where it is much more thick.
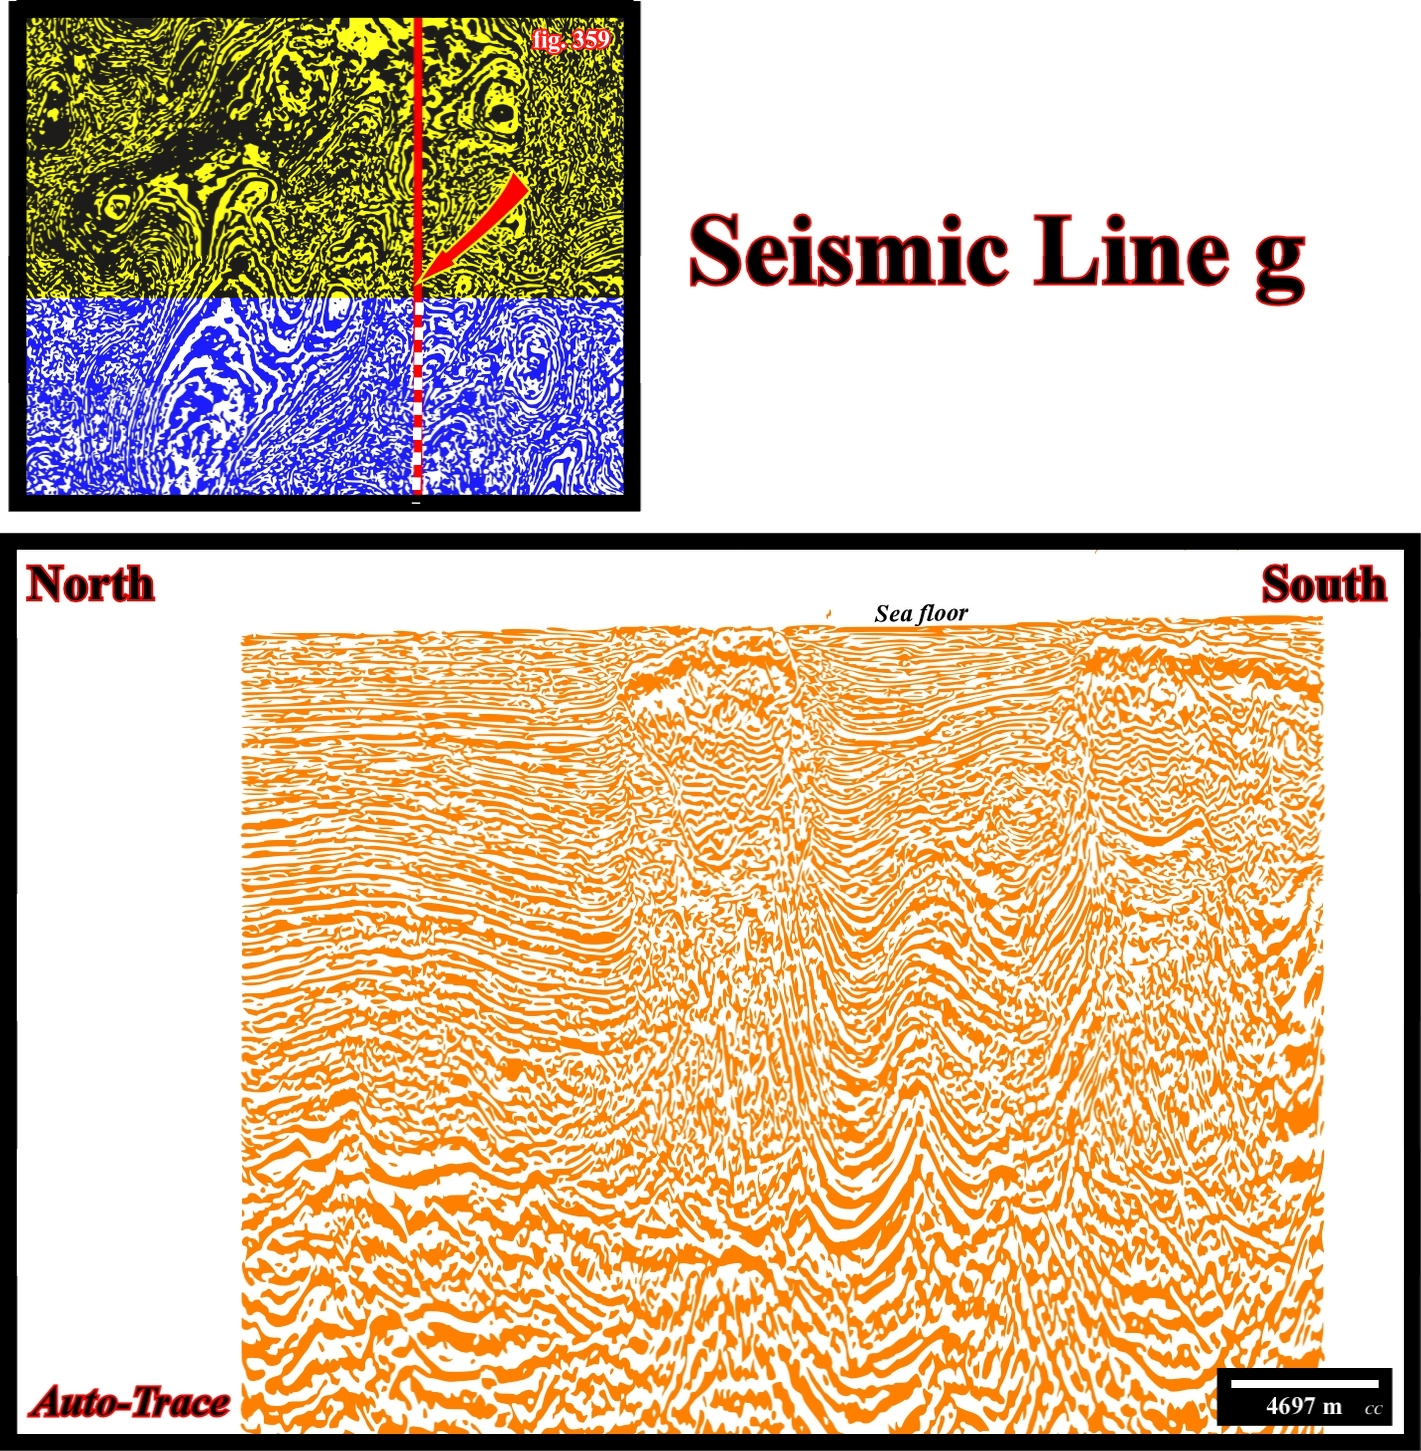
Fig. 366- A quite nice turtle-back structure is recognize in the overburden strata. Two salt drop structures associated with the turtle-back structure are also recognized, easily. They almost outcrop at the sea floor. The southern allochthonous structure shows signs of coalescence. A significant syn-kinematic synform depocenter is recognized in the northern part of the autotrace, in association with the detached salt stock, is, also, recognized.
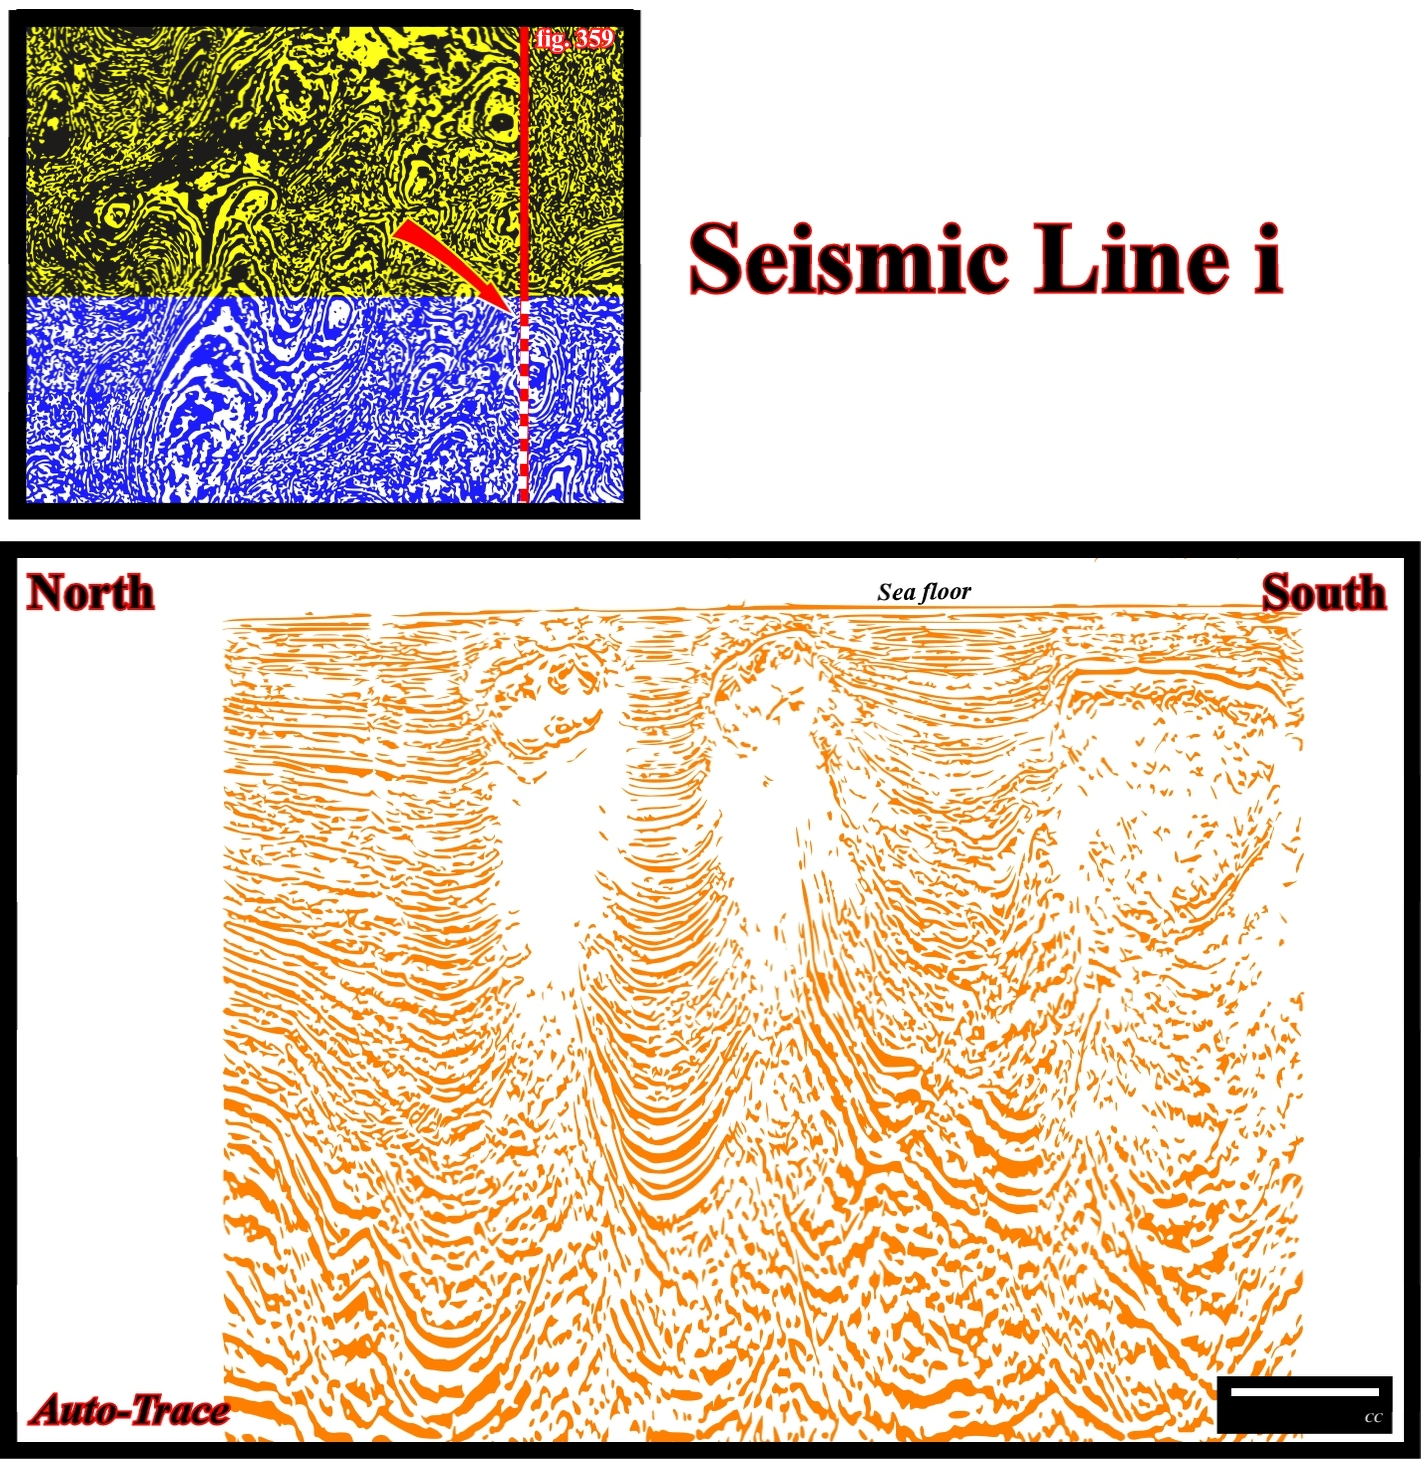
Fig. 367- Three detached salt stocks are, easily, recognized. Notice the pull-ups of the salt induced disharmony, i.e., of the bottom of the allochthonous salt layer. The allochthonous salt layer is, also, easily recognized. Several unconformities are recognized on the overburden.
to continue press
next
![]()