Part I- Basic Principles in Salt Tectonics
Contents :
5.1- Residual Highs
5.2- Turtle-Back Structures5.2.1- Quenguela Turtle-Back
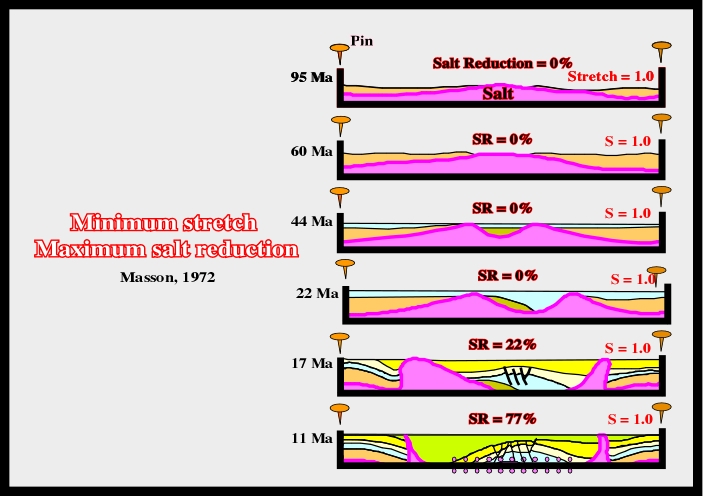
a) Minimum Stretch with Maximum Salt Reduction
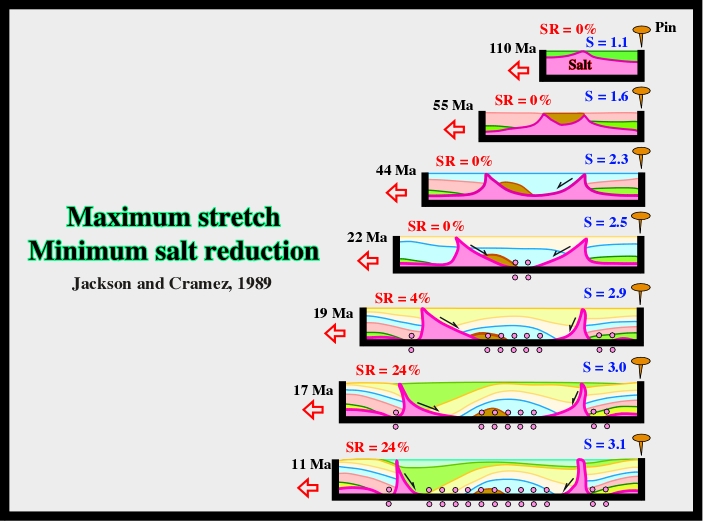
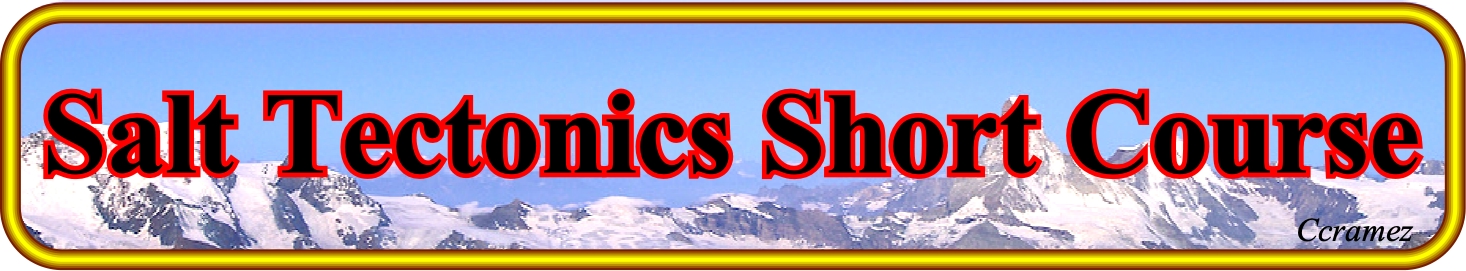
b) Maximum Stretch with Minimum Salt ReductionIn the inter-modal salt model proposed by Arbenz (1986), as illustrated in fig. 158, the associated antiform structures may, or may not, have residual salt. These two possibilities have been respectively labelled:
a) Residual high and
b) Turtle-back structure.
Fig. 158- The inter-domal evolution, as proposed by Arbenz, can be subdivided into two large families of salt structures: (i) Residual salt highs and (ii) Turtle-back structures.
Residual highs are antiforms with a core of salt that may be disconnected from the adjacent domes.
- In these structures, the high structural points have always been high and the lows always been in a low position. In other words, there is no tectonic inversion associated with them.
Turtle-back structures are, also, antiform structures. However:
- The high structural points were low, and vice versa. These structures are the result of tectonic inversions due to salt flowage. When a turtle-back structure is proposed as a hydrocarbon trap, petroleum geoscientists should date the tectonic inversion, relatively, to the migration time of the hydrocarbons. The migration time must postdate the trap formation.
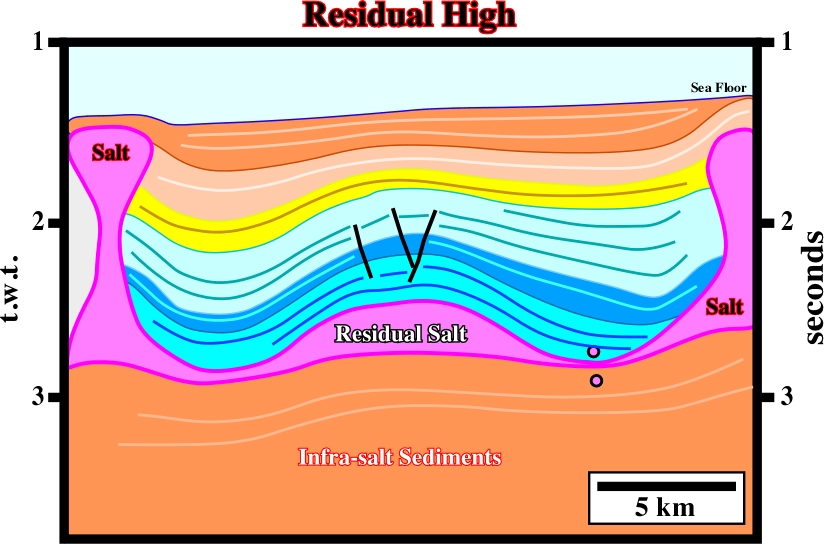
Fig. 159- This tentative interpretation of an unmigrated seismic line (Seffel, 1968) from offshore Angola, Petrangol (Fina) and Total geologists recognized a large antiform structure with a thick residual salt in its core. At present time, this structure is quite well known. It contains two major oil fields, Girassol and Dalia.
Residual salt highs are illustrated in figures below (fig. 160 and 161).
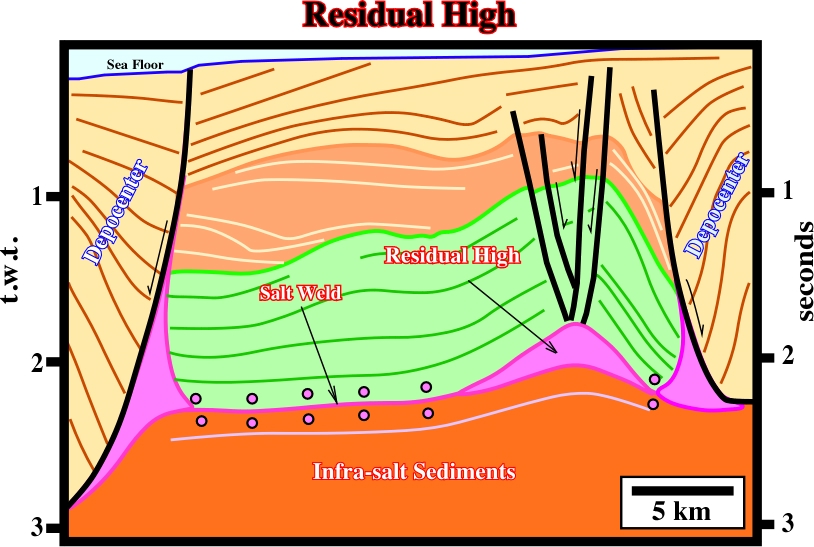
Fig. 160- A residual salt high located between two Tertiary depocenter, in Angola offshore is recognized on this tentative interpretation. The Tertiary depocenters are bounded by fault welds, i.e, by fault zones joining strata, originally, separated by autochthonous or allochthonous salt, equivalent to a salt welds along which there has been significant slip or shear). Salt rollers (low-amplitude, asymmetric salt structure comprising two flanks: a longer, gently dipping flank in conformable stratigraphic contact with the overburden and a shorter, more-steeply dipping flank in normal-faulted contact with the overburden), which suggest an unequivocal sign of regional thin-skinned extension perpendicular to their strike, are the vestiges of the pristine salt domes.
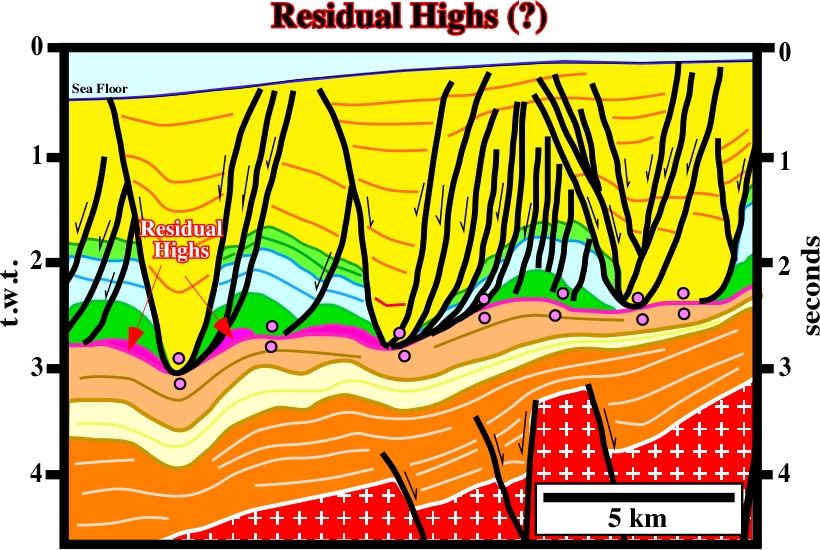
Fig. 161- On this tentative interpretation (Angola offshore), the large overburden structural highs should not be taken as residual high. Indeed, they cannot be explained by halokinesis alone. As we will see later, in Angola offshore, a raft tectonics hypothesis is, by far the more likely, explanation for Meso-Cenozoic highs between Tertiary depocenters.
Petroleum geoscientists working on sedimentary basins with a significant salt layer, often called, salt basins, recognized antiform structures between salt domes as one of the best potential hydrocarbon trap targets. A lot of these targets were tested. However, after a large number of dry wells, explorationists tried to understand how these structures were formed. Trusheim proposed a halokinetic geological model (fig. 162) to explain these inter-domal antiform structures that he named “turtle-back structures”. In Trusheim’s model, three structural stages can be recognized:
a) The first stage corresponds to the deposition of the salt mother layer. Such a stage may also include the deposition of a thin overburden interval, in order to increase the geostatic pressure until the salt layer is able to flow.
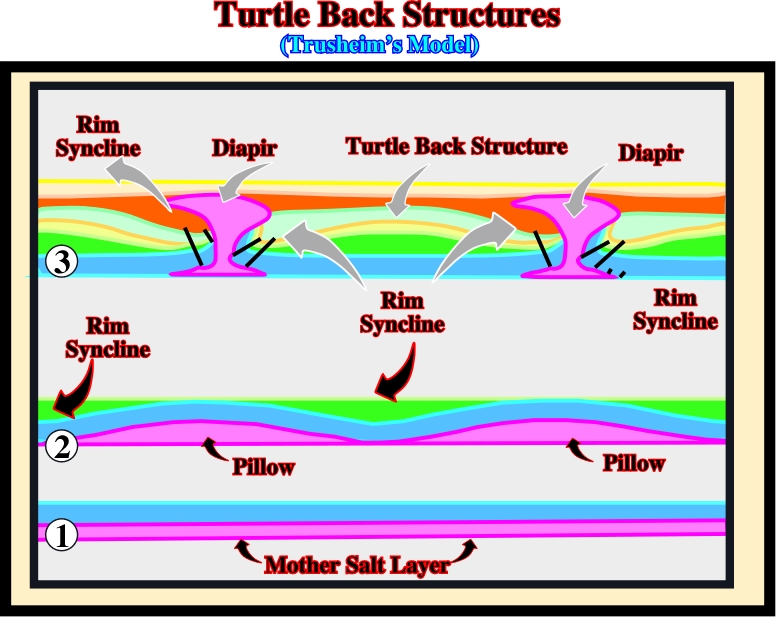
Fig. 162- On this sketch, are pictured the three structural stages taken into account in Trusheim’s model to explain the genesis of the turtle-back structures. The second stage, in which a pre-kinematic overburden (blue interval) is deposited above the mother salt rock, is not required if the salt thickness is large enough to induce the lower part of the salt layer to flow. The third stage correspond to the salt induced tectonic inversion.
b) The second stage includes the deposition of a lower syn-kinematic layer in the overburden. During this stage, the compensatory subsidence induces lateral thickness variations within the syn-kinematic layer. The interval is thicker where the compensatory subsidence is higher.
c) The third stage corresponds to the tectonic inversion and the deposition of the upper syn-kinematic layer thickening toward the salt diapirs (fig. 163). The depocenters deposited during the inversion stage are conventionally called rim synclines.
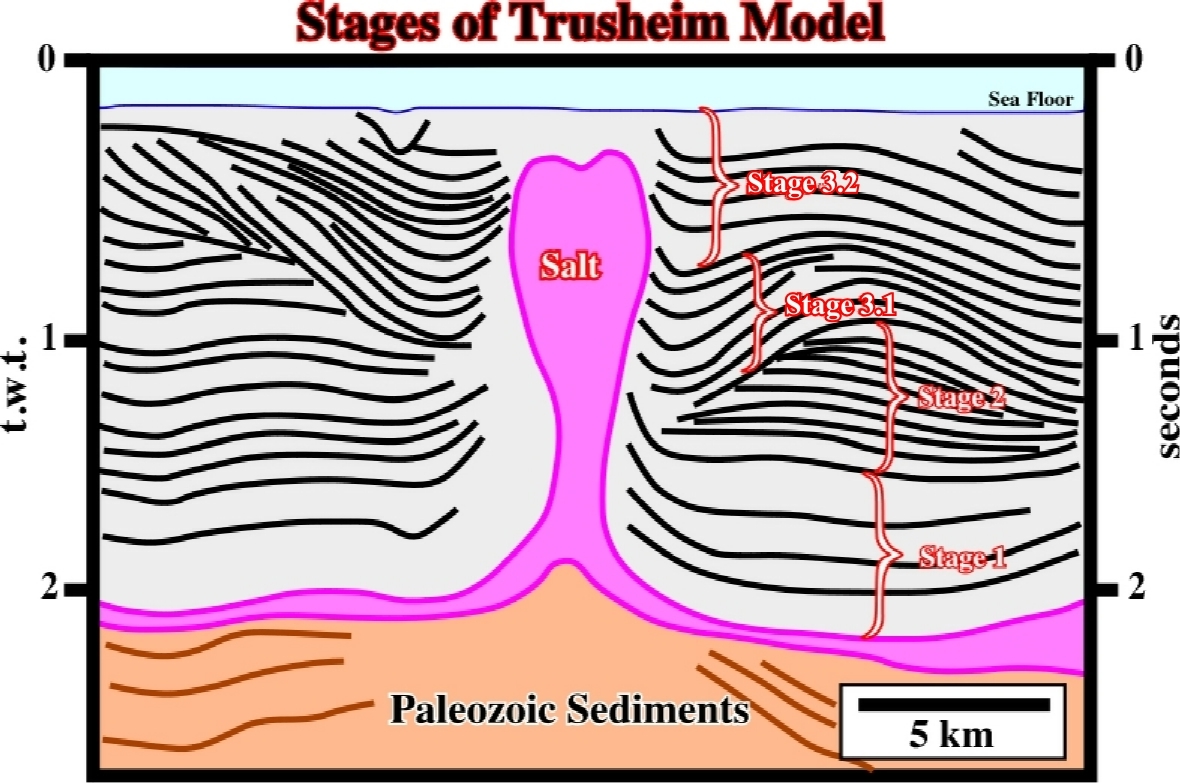
Fig. 163- Three tectonic stages can be observed in the development of salt turtle back structures, as illustrated on this tentative interpretation of a North Sea seismic line. From bottom to top, one can recognize: (a) Infra-salt strata (Paleozoic sediments) ; (b) Autochthonous and allochthonous salt ; (c) pre-kinematic overburden which with the autochthonous salt form the stage 1 ; (iv) lower syn-kinematic overburden thickening away from the salt diapirs (stage 2) and (v) syn-kinematic thickening toward the diapir (stage 3).
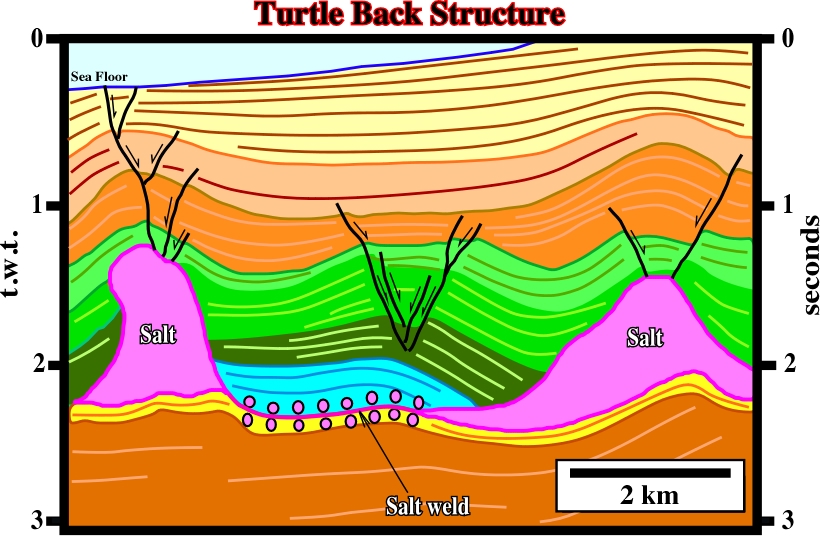
Fig. 164- This tentative interpretation illustrates a typical turtle-back structure in offshore Angola. The tectonic disharmony is quite well recognized, with a significant salt weld between the salt domes. The first stage of the turtle back corresponds to the salt and blue interval deposition. The second structural stage of Thrusheim’s model corresponds to the green intervals, which asymmetry indicates the vergence of the compensatory subsidence induced by the salt flowage. The normal faulting in the core of the turtle back and in the apexes of the domes highlights the sedimentary extension. However, a late compressional tectonic regime shortened and, partially, inverted the overburden. The brown interval, for instance, seems to have been tectonically inverted, since the thicker sector (more subsidence) is in a high structural position.
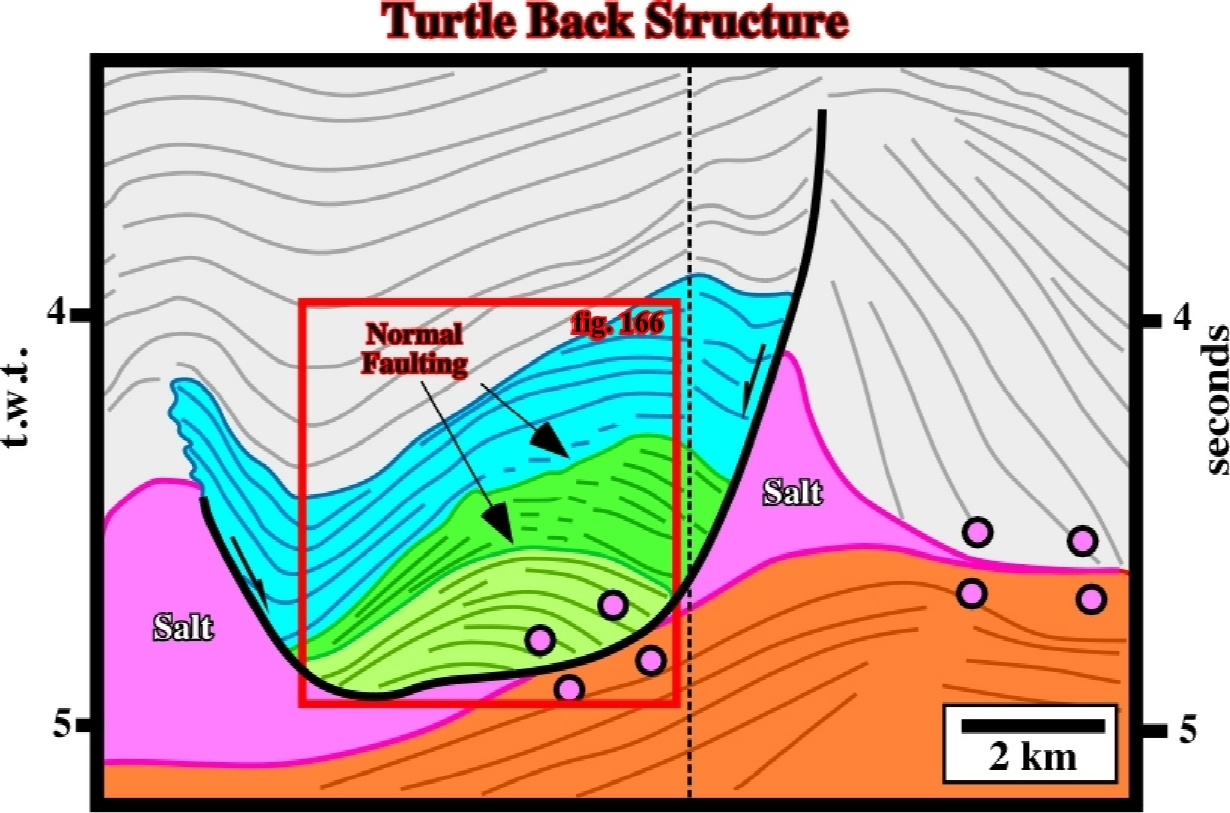
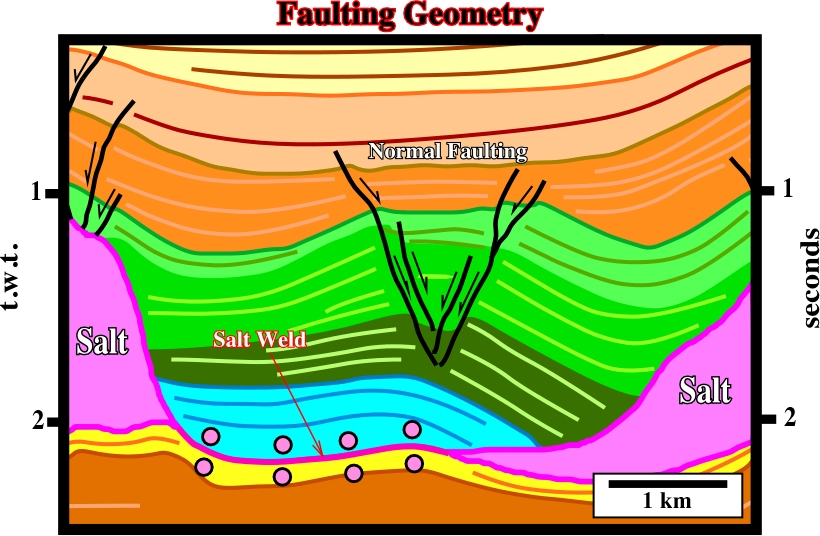
Fig. 165- On this tentative interpretation of a seismic line shot in Gabon offshore, are complex turtle-back is easily recognized. The flanks are formed by salt rollers associated at two normal-faults of different age. The left flank was formed by a late salt withdrawal feeding the adjacent down-dip diapir. The associated synform was later amplified by shortening of the diapir. Extension associated with inversion induced by salt withdrawal is emphasized by the normal-faults in the core of structure, which are, clearly, visible on the next figure (see detail fig. 166).
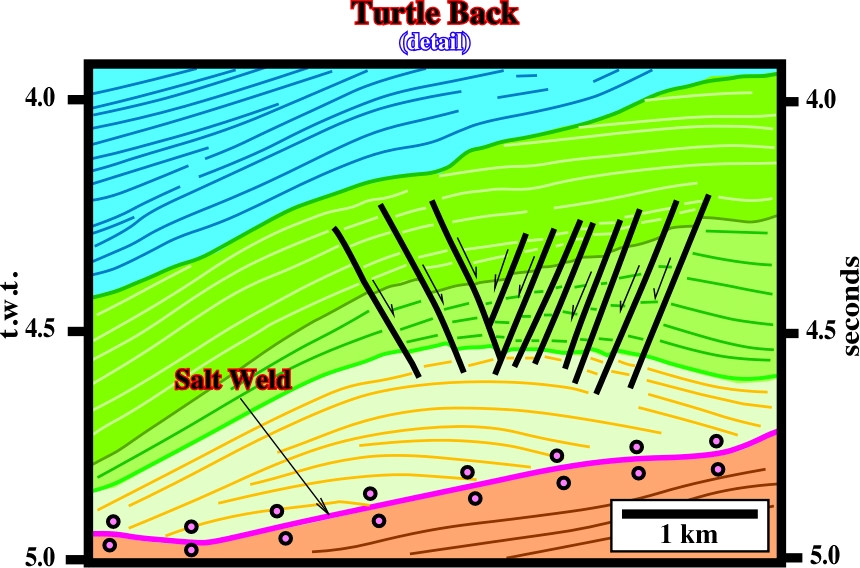
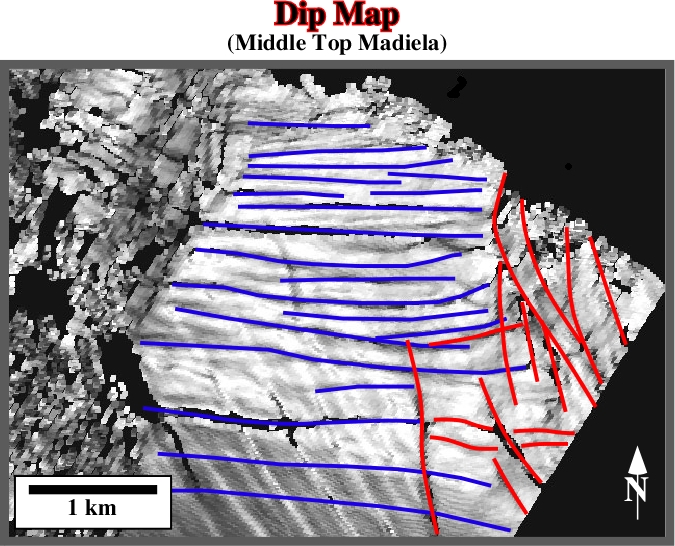
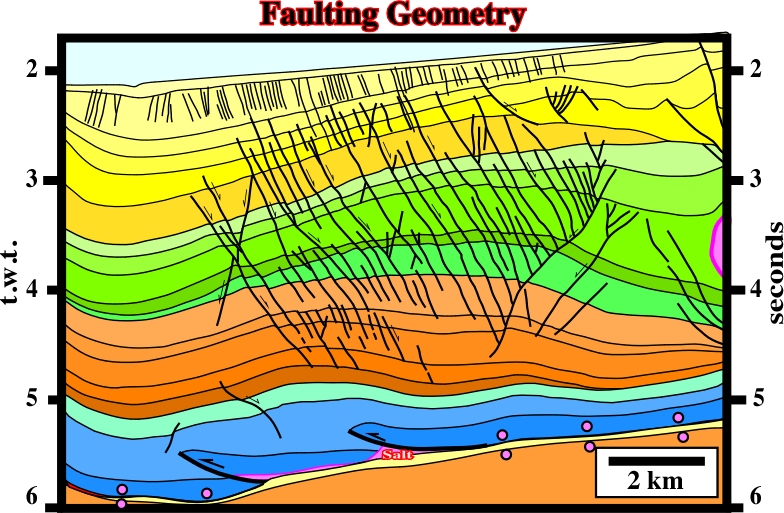
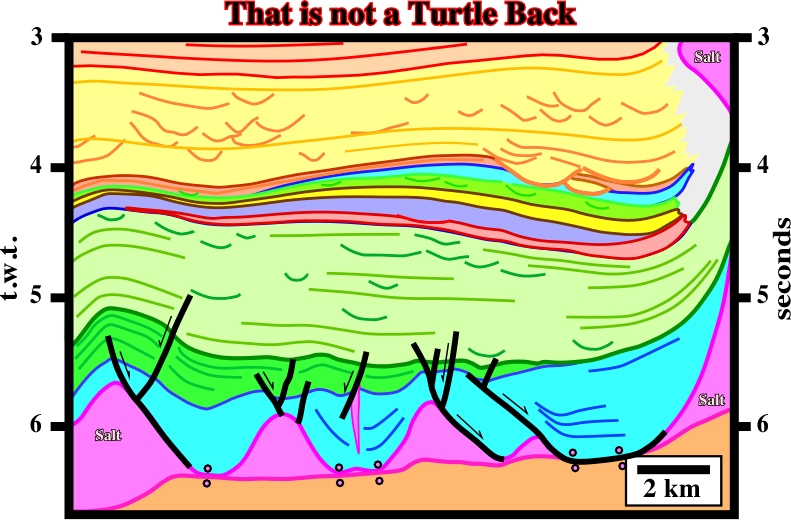
Fig. 166- On this tentative interpretation of the detail underlined on the previous figure, the normal faulting, in the core of a turtle back, which a sine qua non characteristic, are quite evident. In fact, generally, a mounded structure without abundant normal-faults near the apex is not a turtle-back. When the turtle-back is asymmetric, different normal-fault systems are developed, as suggested by the dip map illustrated on next figure.
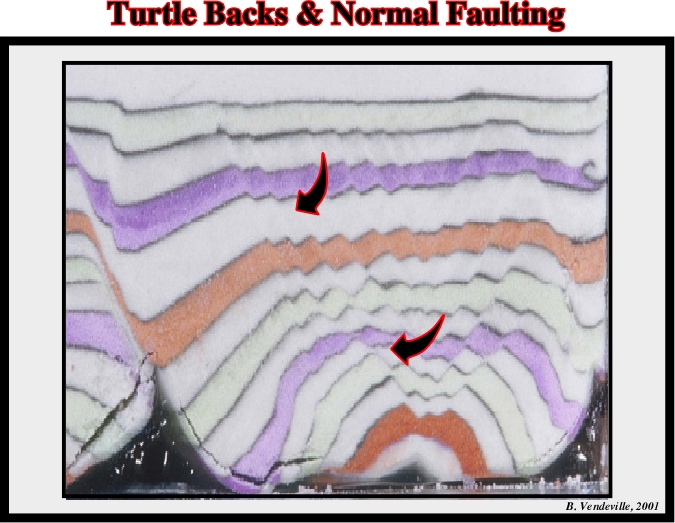
Petrangol’s petroleum geoscientists working in Angola onshore and offshore were the first geologists to advance a coherent hypothesis explaining formation of turtle-back structures. However, the majority of wells drilled to test the hydrocarbon potential of such salt structures were unsuccessful. In Angola onshore, as well as in the offshore, the age of the turtle back structures postdate to the migration time of the hydrocarbons produced by the conventional generating petroleum sub-system. Until the 70’s, in Angola onshore, both in the South Congo or Kwanza geographic basins, the organic rich lacustrine shales deposited in the rift-type basins composed the known generating petroleum subsystem. Later, geoscientists recognized an alternative Albian generating petroleum sub-system accounted for the small oil accumulation found in onshore (Cabo Ledo, Benfica, etc.). At present time, another generating petroleum sub-system is recognized as a major hydrocarbon contributor in the oil fields of the conventional offshore (Palanca, Lombo East, Tubarão, etc)).
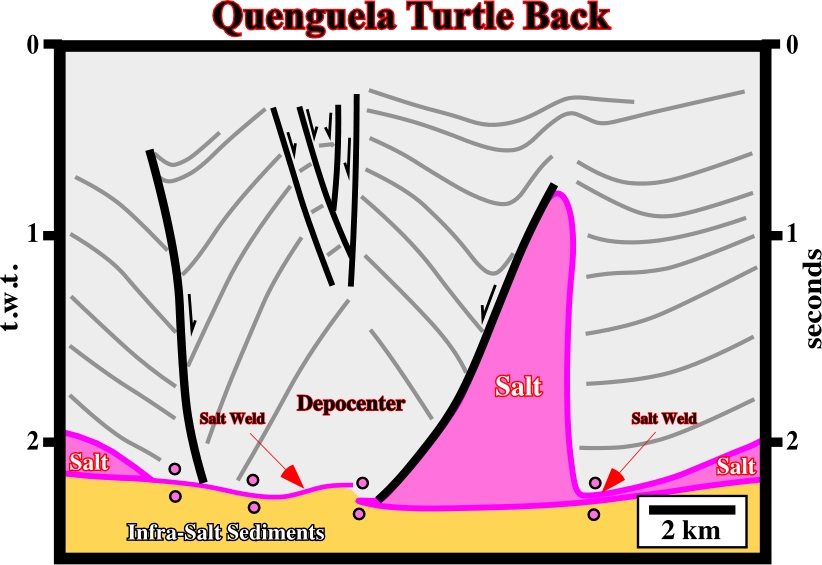
The biggest discovery made by Petrangol in Angola onshore was Quenguela Field (around 40 Mb), which is a turtle back. However, the generating petroleum sub-system (potential source rocks) is abnormal and quite local. It corresponds to the organic Paleocene-Eocene shales deposited in the core of the structure. In fact, it can said the most famous turtle-back structure in the oil industry is the Quenguela turtle back, where Petrangol, in the 60’s, discovered a significant oil accumulation, in Angola onshore, no far from the capital, São Paulo de Luanda. Such a discovery was made using un-migrated seismic data, in which a large antiform surrounded by salt rollers was relatively evident, as illustrated in fig. 172. On the contrary, the generating petroleum sub-system and the potential reservoir were questionable.
At the time of the Quenguela oil discovery, geoscientists did not understand how the organic matter of the source-rocks could be mature. In absence of biomarkers, several bold hypotheses were advanced. At present time, explorationists working in the area assumed that landward of the Atlantic-hinge, the Angola continental shelf and onshore were uplifted 2000-3000 m, during the Upper Tertiary.
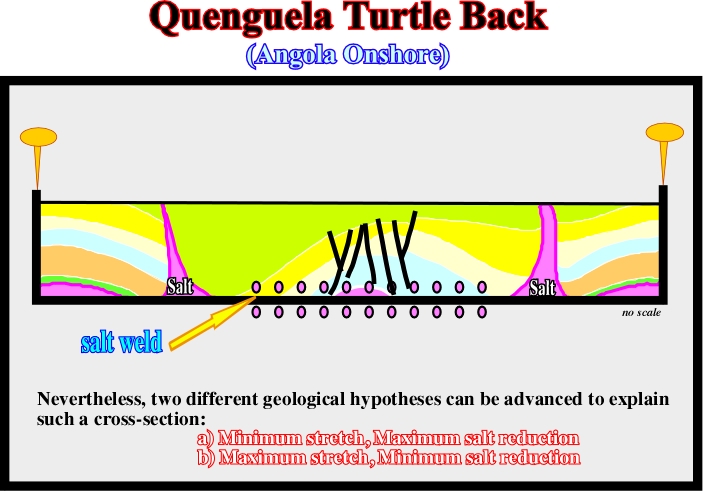
The proposed geological cross-section of Quenguela field (fig. 173), can be explained, by two quite distinct hypotheses:
(i) Minimum stretch and Maximum salt reduction (fig. 174) and
(ii) Maximum stretch and Minimum salt reduction (fig. 175).
(ii) Maximum Stretch, Minimum Salt Reduction
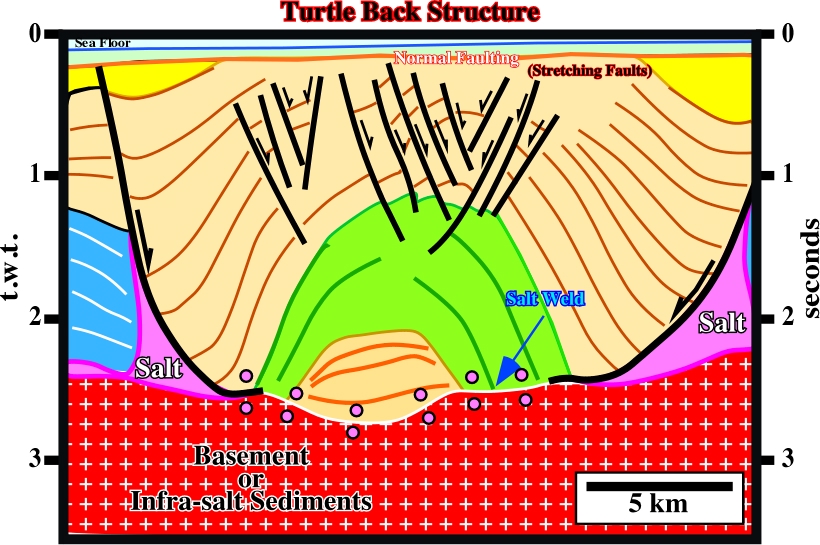
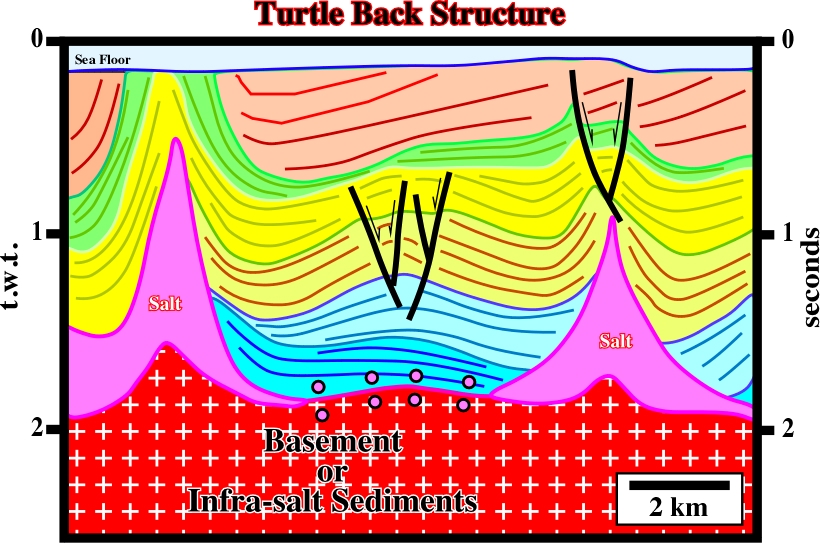
Fig. 177- In spite of a late shortening, which deformed the cover (salt + overburden) the characteristics of an asymmetric turtle-back are easily recognized on this tentative interpretation of an Angola offshore seismic line. In fact, on this offshore, the majority of the turtle-back structures are asymmetric and shortened. The associated domes are very often squeezed.
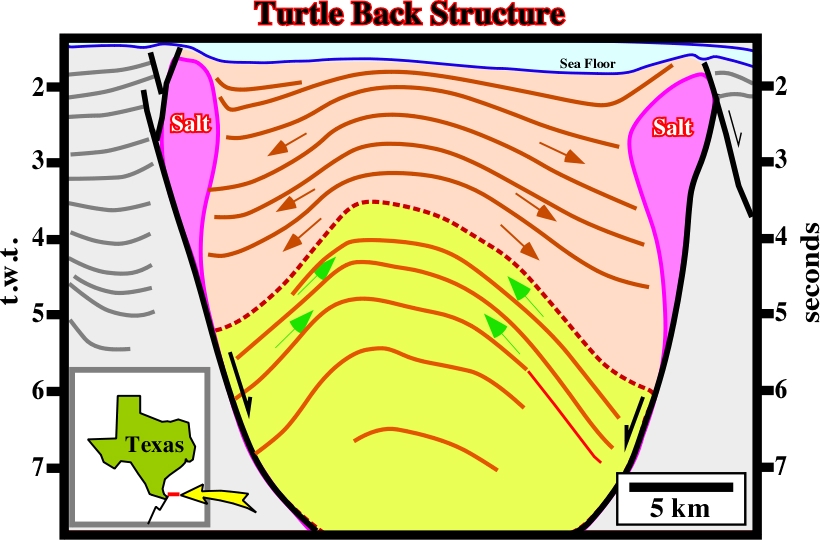
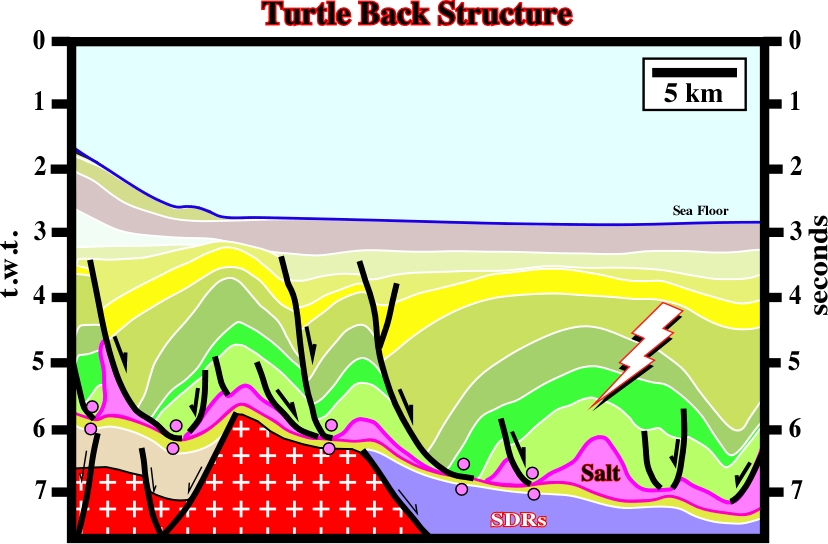
Fig. 179- In the Campos geographic basin (Brazil offshore) large Cretaceous turtle, such those illustrated on this tentative interpretation of a seismic line of this area, have been object of intense exploration. Unfortunately, the reservoirs are not buried deeply enough to avoid bio-degradation of the trapped oil. When the reservoir temperature, at oil migration time, is less that 60°C, bacteria not are destroyed and so they progressively bio-degrade the oil. Notice, that on this tentative interpretation, the basement buried hill is fossilized by quite different rocks. Landward, the rift-type sediments (possibility of a generating petroleum sub-system) that pre-date the breakup of the Gondwana small super-continent. Seaward, we find the lava-flows (any possibility of potential source rocks), which post-date the breakup unconformity.
to continue press
next
![]()