Part I- Basic Principles in Salt Tectonics
Contents :
2.1- Salt Density
2.2- Salt Plasticity
2.3- Salt Dissolution
2.4- Salt Reduction
2.4.1- Volume Loss
2.4.2- Lateral Flow
2.5- Salt Movements
2.5.1- Overburden Homogeneous and Isopach
2.5.2- Variable Thickness of Overburden
2.5.3- Variable Lateral Density of Overburden
a) Compressive Strength
b) Tensile Strength
2.5.4- Tectonic Tilting
a) Overburden less Dense than Salt
b) Overburden Denser than Salt
The salt or halite is a component of many evaporitic rocks formed by evaporation of salty lakes or seas. It can occur in large layered sedimentary deposits and efflorescences in arid regions. Salt bodies are normally dry and impermeable. Halite is associated with various chlorides, carbonates and sulphates (gypsum, sylvite, polyhalite, carnallite, etc.). Geoscientists have a tendency to call salt all evaporitic rocks. Evaporites precipitate from evaporation of saline solutions. The sedimentary rocks composed of minerals precipitated as a result of their concentration increasing in a brine (due to mineral terrigeneous influx or evaporation of the water, in which they are formed). Evaporites are represented mainly by sulfates (anyhdrite, gypsum) and chlorides (halite).
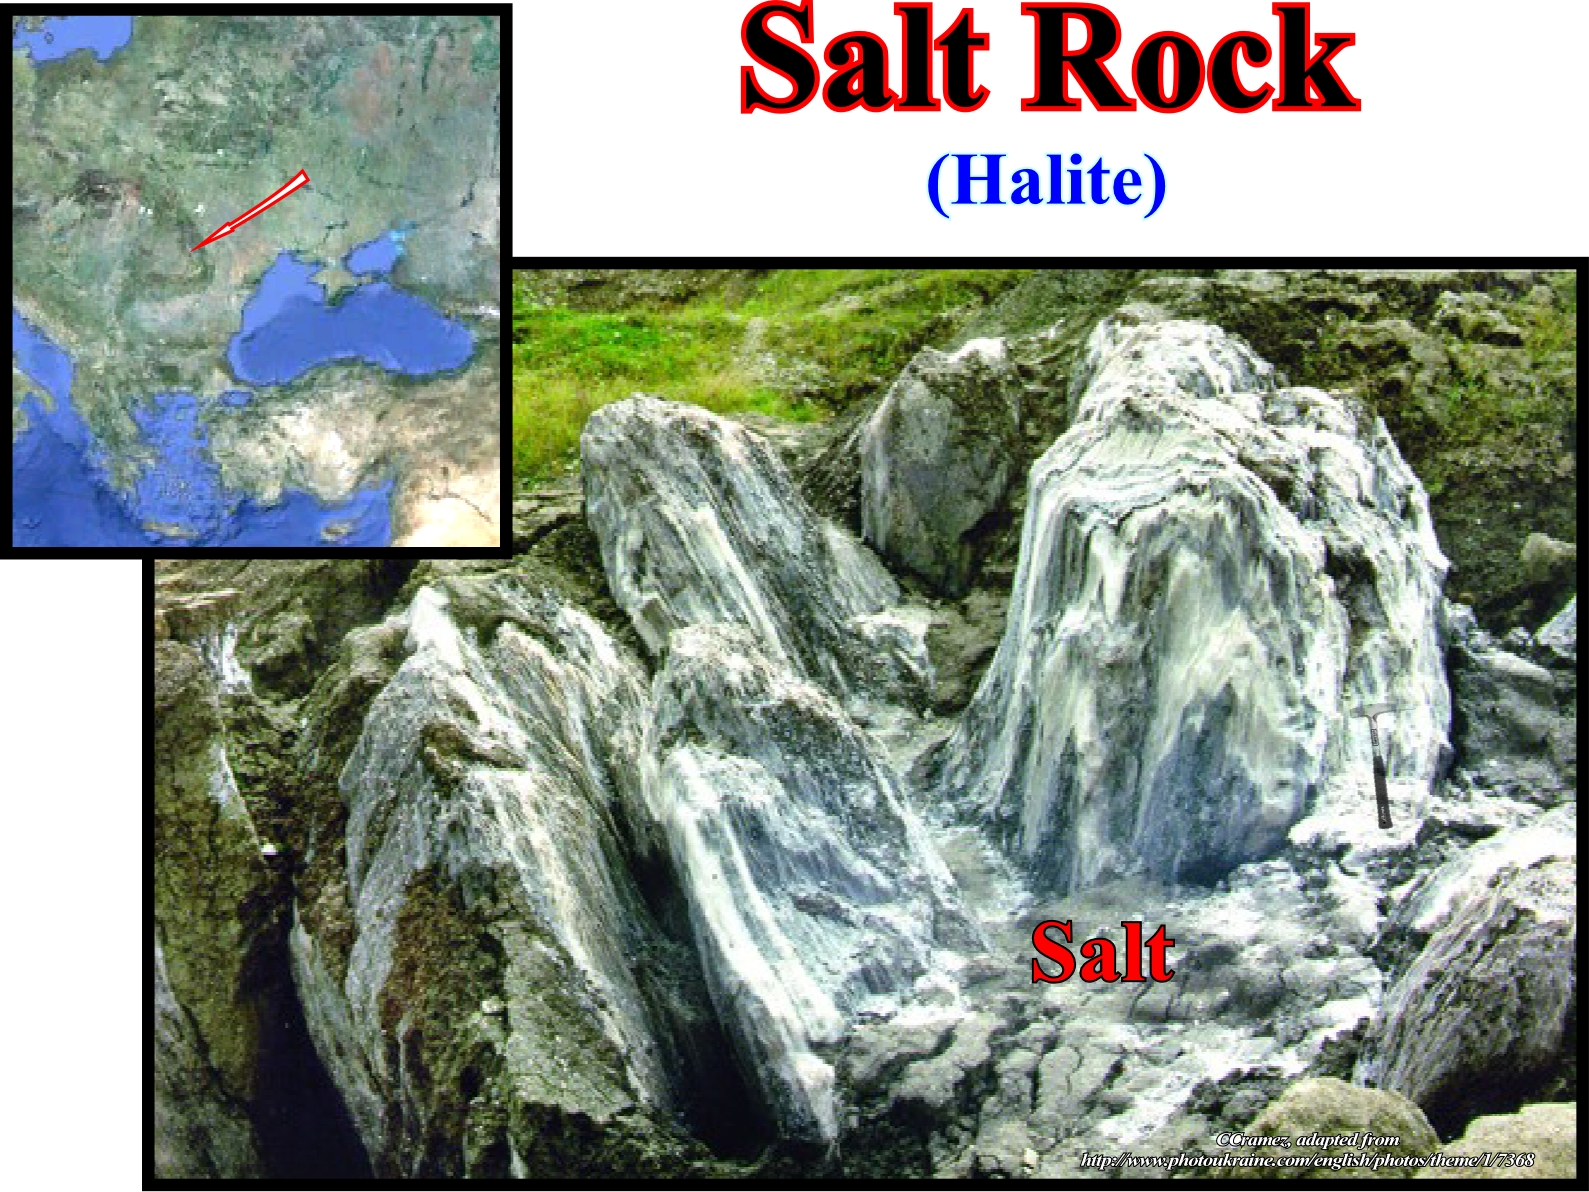
Fig. 27- Theoretically speaking a rock salt is a chemical sedimentary rock that forms from evaporation of ocean or saline lake waters. Salt is also known by the mineral name halite. Salt is rarely found at Earth's surface (because it can be dissolved), except in areas of very arid climate. Its chemical formula is NaCl. It can have impurities of gypsum (CaSO4) and sylvite (KCl) but it is very rare to find potassium sulfate as a mineral, although occasionally polyhalite (K2Ca2Mg(SO4)4.2H2O) is found associated with rock salt deposits. Natural salt pans are flat expanses of ground covered with salt and other minerals, usually shining white under the sun. They are found in deserts, and should not be confused with salt evaporation ponds.
The main characteristics of the salt are :
(i) Crystal system orthorhombic ;
(ii) Cleavage perfect, all sides - cubic ;
(iii) Fracture conchoidal ;
(iv) Colour clear to white ;
(v) Index of refraction 1.5442 ;
(vi) Angle of repose (dry, ASTM D 632 gradation) 32° ;
(viii) Boiling point 1465° C ;
(ix) Hardness 2.5 (Mohr’s Scale) ;
(x) Critical humidity at 20 °C ;
(xi) Bulk density is roughly 1.154 (the mass of many particles divided by the total volume they occupy) ;
(xii) Density or specific gravity 2.165 (without impurities).
Contrary to other sedimentary rocks, the density of salt does not vary with depth. It ranges between 2.15 and 2.17 depending of its composition (fig. 27a). The salt density varies slightly with its composition. The density of the salt formed from evaporation of hydrothermal enriched brines is slightly greater than salt evaporating from meteoric brine.
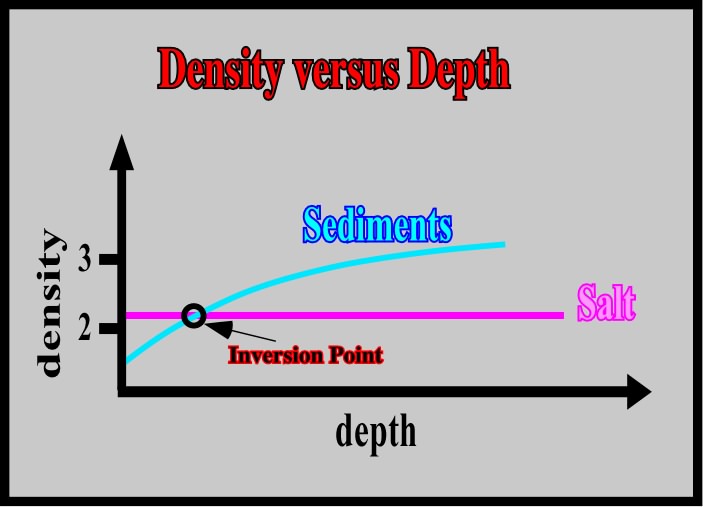
Fig. 27a- In a sedimentary basin with a salt layer there is always an inversion point, that is to say, between the surface and around 1500 meters depth, the density of the salt, which is more or less constant, is higher than the density of the sediments. However, below the inversion point, the density of the sediments is higher than the salt density. In other words, in the higher levels, the salt flows lateral, because its pressure against the surrounding sediments is not compensated by the pressure of the sediments against the salt. In the lower levels of a basin (below the inversion point) it is the contrary.
As all sedimentary rocks (except salt) become compacted with depth. Their density increases. In basins with a layer (autochthonous or allochthonous), there is always a given depth, or inversion point (in the field, it is more correct to speak about an inversion zone that an inversion point), defining two different domains:
(i) An upper domain, in which the salt density is higher that of the density of the sediments, and
(ii) A lower domain, in which the density of the sediments is higher than the density of the salt.Within the upper domain, as the pressure produced by the salt against the sediments is not balanced by the pressure produced by the sediments against the salt, the salt has the propensity to flow laterally. Within the lower domain, the salt has a propensity to flow upward, because, at the same level, the confining pressure in the sediments is always higher than the confining pressure within in the salt. This explains the hypothesis that salt domes with vertical walls are physical impossibility. They exist only on paper as inaccurate interpretations of seismic data.
Salt behaves as a plastic material. It undergoes no permanent deformation if the applied stress is smaller than a characteristic yield stress. It flows readily when the applied stress is at, or slightly above, the yield stress. One can idealize plastic behaviour, mathematically, by assuming that there is no deformation at all (the material is rigid) below the yield stress and that during the deformation, the stress cannot rise above the yield stress except during acceleration of the deformation. This model describes a perfectly plastic material or a rigid-plastic material. Salt deformation starts beyond a certain pressure threshold, ranging between roughly 50 and 150 bars, depending on the nature and composition of the salt. The Loeme salt (in Kwanza-Congo geographic basin) and the Louan salt (Gulf of Mexico) seem to start deformation under lower pressure than the Messinian salt (Mediterranean geographic basin).
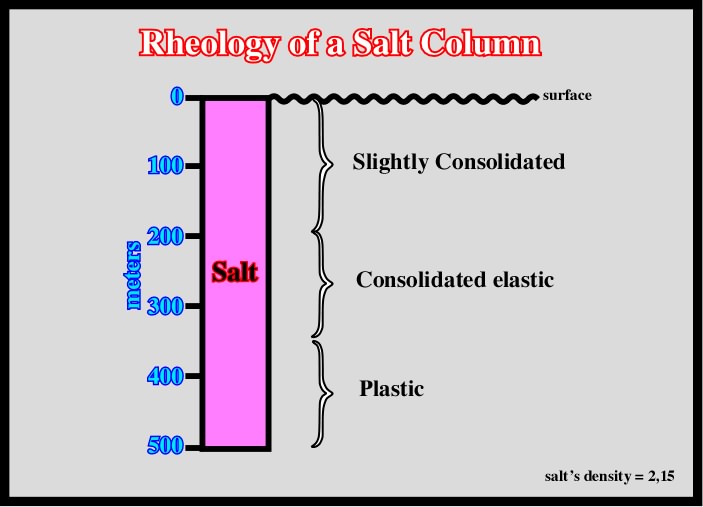
Fig. 28- Salt can flow without or under a small overburden thickness. In absence of significant tectonic stress, a relatively thick salt column (> 400 m) shows different rheologies. From top to bottom, they are: (i) Slightly consolidated : (ii) Consolidated elastic and (iii) Plastic. The deeper plastic interval can flow just due to the height of the upper intervals, that is to say that halokinesis can start without overburden.
Theoretically, in an column of 500 meters of salt, assuming a salt with a density of 2,15, the σv of the geostatic pressure* (σg), which can be represented by a vertically oblong biaxial ellipsoid with σvertical and σhorizontal ), at 230 meters depth is 50 bars, while at the bottom (500 meters), is 107 bars. So, plastic salt deformation can occur within a salt layer even in the absence of overburden.
* At a given point, the geostatic pressure is the vertical pressure due to the weight of a column of rock and the fluids contained in the rock above that depth. The e lithostatic pressure is the vertical pressure due to the weight of the rock only.
A column of 500 meters of salt, for instance, can be considered as a vertical superposition of three salt intervals in terms of rheology (fig. 28). From bottom to top:
a) Plastic b) Consolidated elastic and c) Slightly consolidated.
In other words, in absence of a tectonic stress (σt) and significant overburden thickness, salt deformation is possible due to the geostatic pressure of the upper salt levels. As the density of the salt is constant in depth, it is difficult to mention buoyancy to explain movements within the salt.
Salt dissolution has been recognised on the ground and on seismic data. In the North Sea, Arbenz (1968) and Lohmann (1972) explained particular structures, recognised on seismic lines, as an aftermath of salt dissolution. In fact, when salt is dissolved at surface, or nearby, a potential void is created inducing deposition or development of extensional structures in order to solve the volume problem (fig. 29 & 30). Actually, under wet climates, if a salt dome reaches the surface or the sea bottom, it will be subjected to dissolution. The central part of the dome, prominent and broken, will be, preferentially, attacked. Rounded depressions will be form and sooner they will become deep funnels that widen and join over the salt, creating a vast salt-dissolution depressions with hillocks of insoluble material.
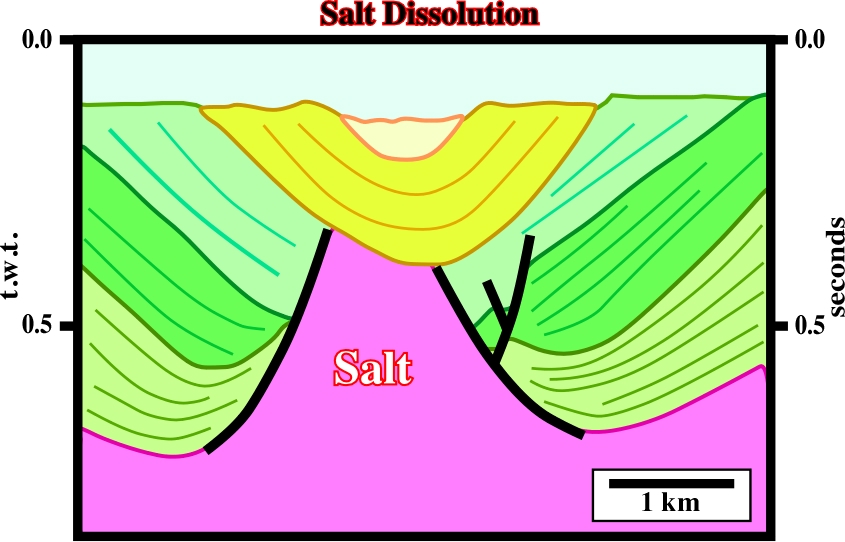
Fig. 29- On surface or at sea bottom, at the vertical crest of a salt dome, a more or less circular collapsed depression is, often, formed as a consequence of salt dissolution by meteoric waters, as illustrated on this seismic line. In fact, the uppermost sedimentary interval of this tentative geological interpretation can be explained by salt dissolution on top of the salt dome. Salt dissolution creates a local relative sea level fall, which increasing the accommodation favours deposition just above the top of the dome.
When a salt dome is not outcropping but covered by a relatively thin and permeable sedimentary interval, its roof can be washed. Geologists call this subrosion. The role of the fractures above the dome is quite important. It controls the shape, development and verticality of the walls of subterranean salt-dissolution depression. A depocenter is, gradually, created over the permeable cover, whereas leaching creates a more or less horizontal salt-cover interface, independently of the cap rock In fact, salt domes are, often, capped by an insoluble mixture of calcite and anhydrite (gypsum and sulphides, when altered) that geoscientists call cap rock. The thickness of a cap rock can reaches several hundred metes what creates important positive effect in magnetic and seismic data. The thickness of the salt-dissolution depression can reach more than 500 m (Série des Cirques, in N’Daminzé dome, Gabon) or 10-50 m as above the Rumania’s domes.
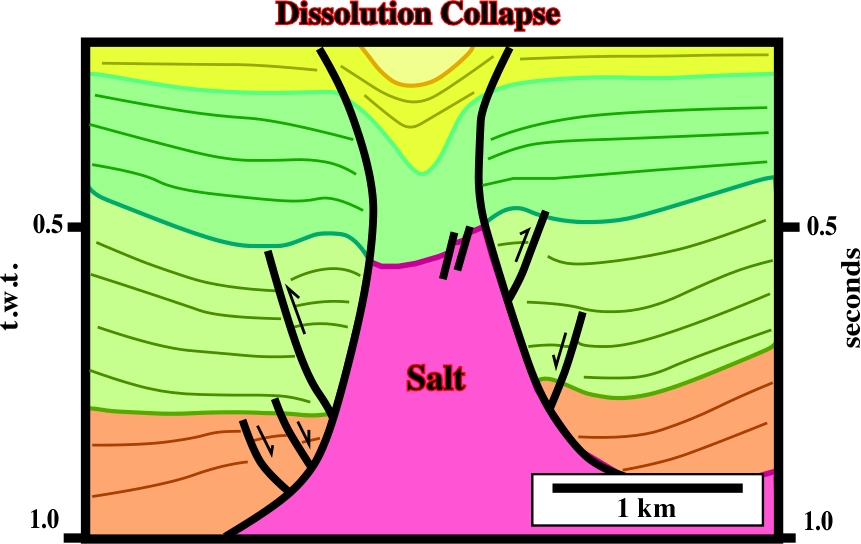
Fig. 30- A salt-dissolution basin, over the top of the salt dome, is quite evident. The salt dome was squeezed. Similarly, folding and reverse faulting shortened the sediments juxtaposing the flanks of the dome. Just above of the dome, the topography of the sea floor (not visible on this line) has sub-circular trough morphology, similar to that of the Grand Saline dome, in onshore Texas. Notice that such a morphology can also be created by a salt collapse induced by lengthening of the overburden. Small tectonic inversions are visible, probably, in association with a late reactivation of the accommodation faults developed with the flanks of the salt diapir. Such a fault reactivation can be induced by a late compressional tectonic regime.
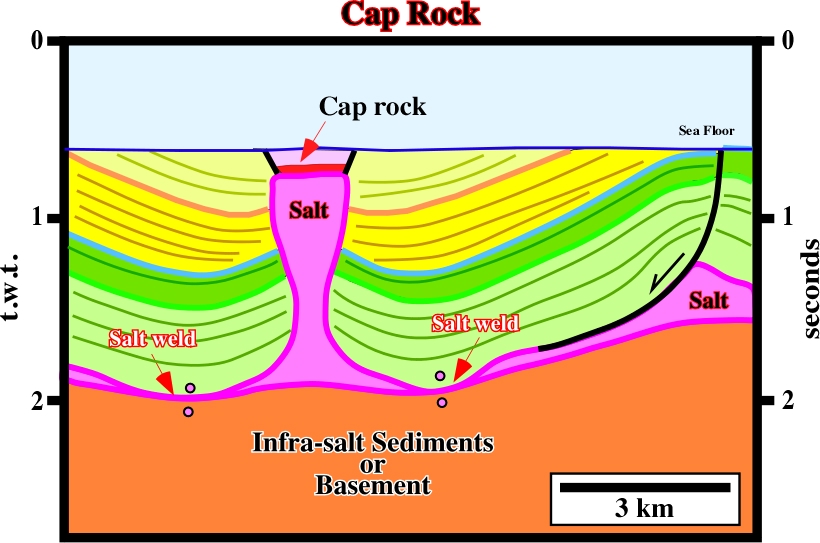
Fig. 31- Cap rocks are often located on the top of the salt dome reaching the surface, or the sea bottom. They are, easily, recognized on seismic data as illustrated on this tentative geological interpretation of seismic line shot in a conventional offshore. Cap rocks create a sharp change in the acoustical impedance profile, which produce sub-horizontal high amplitude seismic reflectors, as illustrated above. On this tentative interpretation above the salt-induce tectonic disharmony, which corresponds to the bottom of the salt interval, we recognize (i) the autochthonous sand allochthonous salt separated by a relatively thick vertical salt structure, (ii) two, more or less, horizontal primary salt welds in the autochthonous salt, (iii) an apparent normal fault in the flank of a small salt ridge and (iv) a pre-kinematic overburden. Notice that infra-salt sediments comprise infra-salt margin sediments and eventual rift-type basins created before the breakup of the lithosphere.
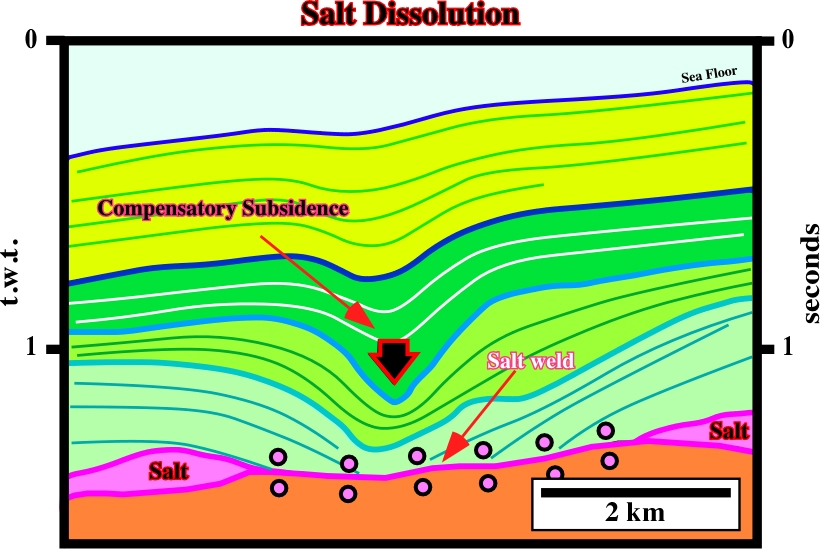
Fig. 32- Salt dissolution below permeable intervals, with an active aquifer, can produce a synform structures above by salt welds, as suggest on this tentative geological interpretation of a Mediterranean seismic line. In fact, in this example, the local salt dissolution induced not only a salt weld but a compensatory subsidence, mainly, at the level of the dark green seismic interval. Such a compensatory subsidence is responsible of the depocenter in the green interval and the apparent downlaps observed in the lower most interval of the overburden.
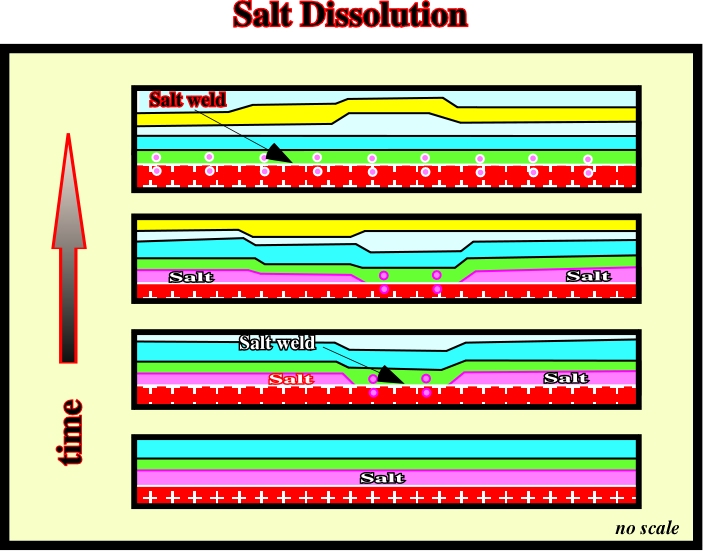
Fig. 33- This sketch, taken from Arbenz (1968), suggests one of the more likely hypotheses explaining particular antiform structures occurring in North Sea. In Arbenz’s hypothesis, successive salt dissolutions transform a continuous and isopach salt layer into a wide salt weld with development of the antiform structures (extensional structures) in the overburden. Alternative hypotheses have been proposed. However, Arbenz’s hypothesis is, by far, the more difficult to refute.
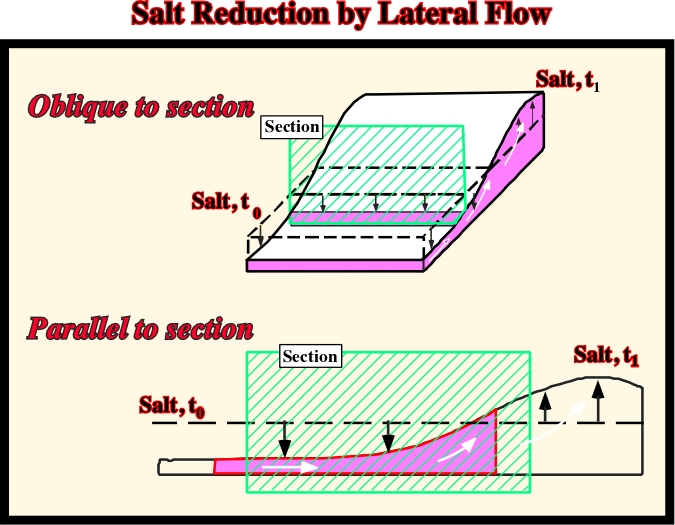
Salt reduction is a mass transfer of salt over time, resulting in an obvious change in area of salt in cross section, by: (1) Volume loss due to dissolution, (2) Isochoric flow (without volume change) out of the plane of section, including smearing along decollement faults, (3) Isochoric flow (without volume change) within the plane of section but beyond the ends of the cross section.
can be made whether by (i) volume loss (2.4.1) or (ii) lateral flow (2.4.2) as illustrated in figs. 33 to 39.
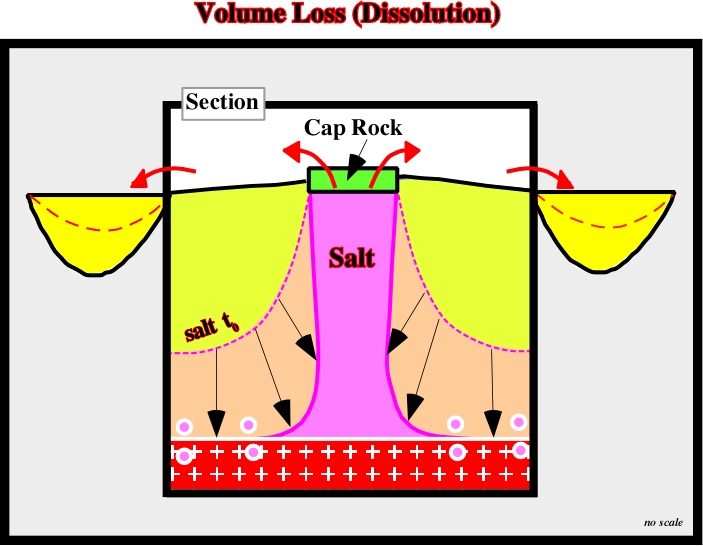
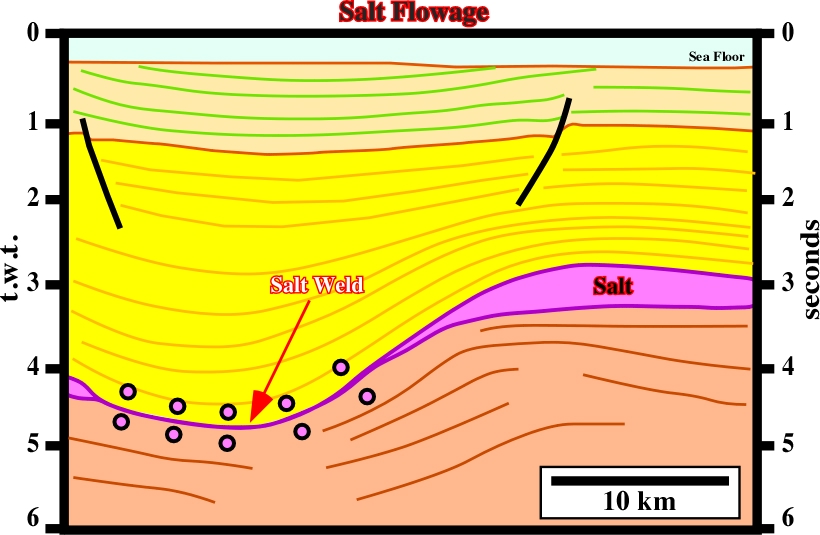
Fig. 34- Salt reduction can take place by dissolution of the upper part of a salt dome with development of a significant cap rock, as illustrated above. The flanks of the dome retracted from the original position of the salt (t0) to the present time position. Salt welds can be formed disconnecting the salt dome from the mother layer.
Fig. 35- On this tentative geological interpretation of an Angola offshore seismic line, some of the upper sedimentary intervals, particular the absence of he dark green interval on the top of the salt dome, can be explained by volume reduction created by salt dissolution. However, other hypotheses can be proposed to explain the differential subsidence responsible of the deposition of the upper intervals of the overburden. The upward movement of the salt diapir, induced by a lateral salt-flow, seems to be quite late. It created a significant compensatory subsidence that, partially, induced the deposition of the uppermost seismic interval.
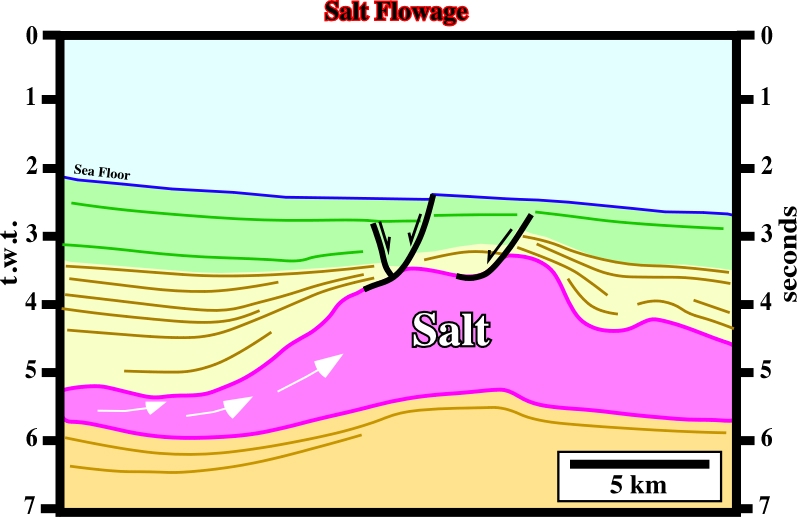
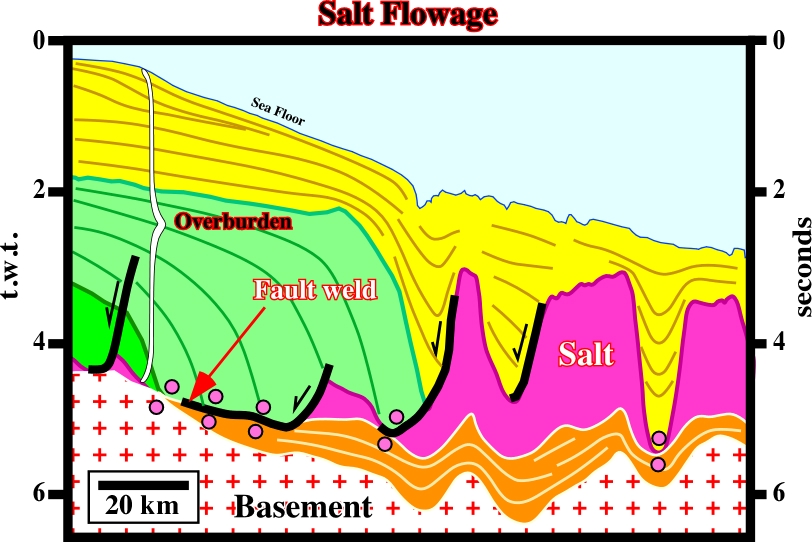
Fig. 39- Here, the salt flowage is, easily, recognized by the welding and overlying overburden depocenter (compensatory subsidence during the lower part of the yellow seismic interval). The direction of the salt flowage is parallel to the orientation of the seismic line (Nordkap geographic basin). The salt seems to have flowed in opposite senses. In a depth version of this seismic line, the bottom of the salt layer, i.e., the salt induced tectonic disharmony, is, roughly, planar, since the pitfall created by the lateral change in the interval velocity (sediments against salt) is rectified.
Whenever a salt interval is overlain by an overburden whose average density exceeds that of the salt, there is a mechanically unstable situation. Different geological situations can be considered:
2.5.1- Overburden Homogeneous and Isopach
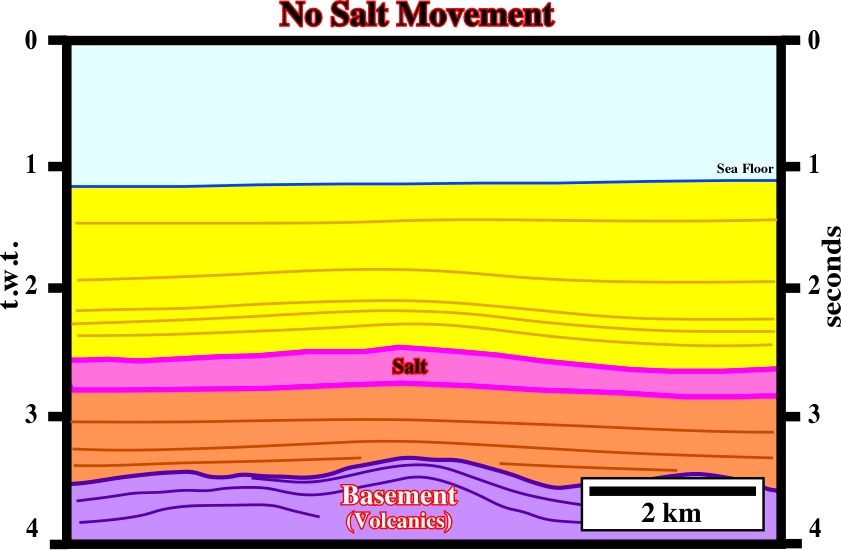
In absence of overburden or of an overburden homogeneous and isopach, whenever the difference in pressure (P) between two given points, not very distant, within a salt layer (with plastic properties), is zero, there is no salt movement (fig. 40).

As illustrated in fig. 40 and 41, even if the thickness of the salt interval is relatively small, the loading of the overburden can be enough to create, within the salt layer, two intervals with different rheologies:
(i) An upper interval with a non-plastic behaviour.
(ii) A lower interval with plastic behaviour.
In the lower salt interval (plastic behaviour), the salt can flow laterally, if, at same depth, there is a different pressure between two points A and B. However, when the salt and the overburden is isopach and homogeneous, the geostatic pressure (σg = P = h.d.g) at the given points, is the same (h= depth of the given points, d= average density of the sedimentary column above the given points and g = the gravitational constant). Subsequently, there is no salt movement or salt flowage.
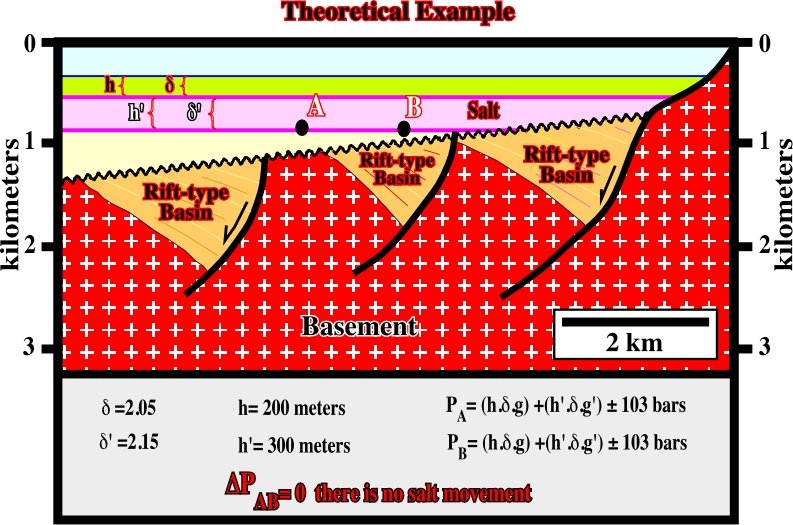
Fig. 41- Theoretically, the geostatic pressure at points A and B, located at the base of the salt interval (salt induced tectonic disharmony) is the same. Therefore, in absence of a significant tectonic stress, there is no salt movement. Along an isobath (imaginary line connecting all points having the same depth), within the salt layer, there is no difference in geostatic pressure . This example is a simulation of a proximal area of an Atlantic-type divergent margin (far away of the post break lava-flows, SDRs), in which are represented the two major geological unities separated by the breakup unconformity : (i) The extended Gondwana continental crust, which comprise the rift-type basin formed and filled during the lengthening of the lithosphere and (ii) The Atlantic-type divergent margin in which a significant salt layer was deposited near the bottom.
Fig. 42- There is no significant salt flowage in the area covered by the Mediterranean seismic line of this tentative interpretation . All points, within the salt layer, lying on the same isobath have more or less the same geostatic pressure. If there is a pressure difference, it is not sufficient enough to overbalance the friction strength at the bottom of the plastic salt.
If a difference in pressure (P) exists between two not very distant points along the same isobath of a salt interval with plastic properties, salt movements can take place. In sub-surface, salt movements occur when the force (f) created by difference in pressure (?P), between two points, is greater than zero. However, ?P must overcome:
a) The friction, at the base of the salt, and
b) The resistance of the overburden.
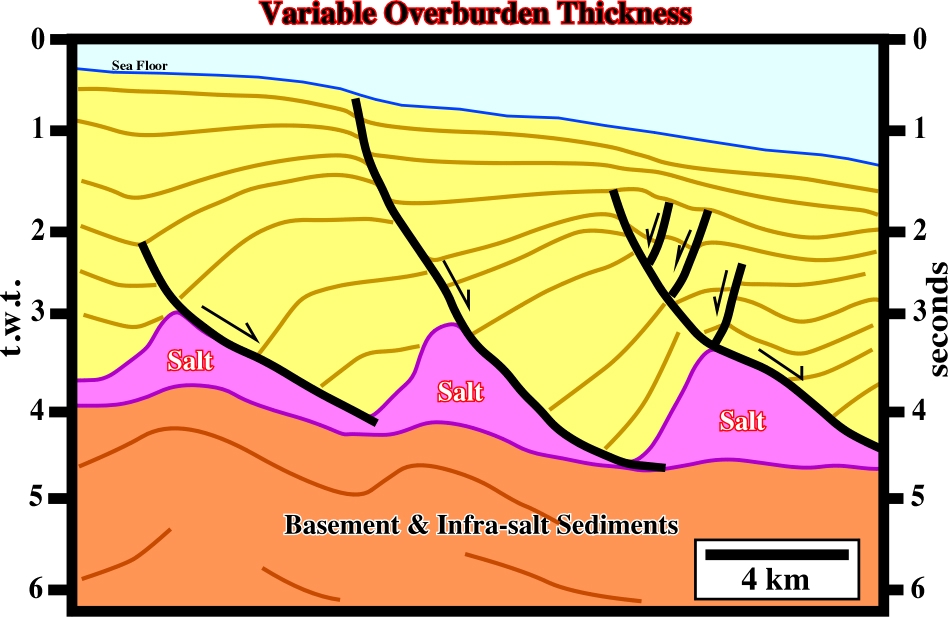
2.5.2- Variable Overburden Thickness
When the thickness of the overburden or the water depth (fig. 43), changes laterally, within a plastic salt interval, salt can flow from high-pressure to the lower pressure areas. Such hypotheses are quite frequent in sedimentary basins, particularly in divergent margins whether Atlantic type or non-Atlantic type. Non-Atlantic divergent margins are those developed in basins associated with the formation of the mega-sutures (compressional setting), particularly when extension is big enough to break-up the lithosphere and initiate sea floor spreading. In fact, the sedimentary prisms of the margins become condensed seaward with geological conditions of starved basins and the water depth, strongly, increases basinward of the shelf break.
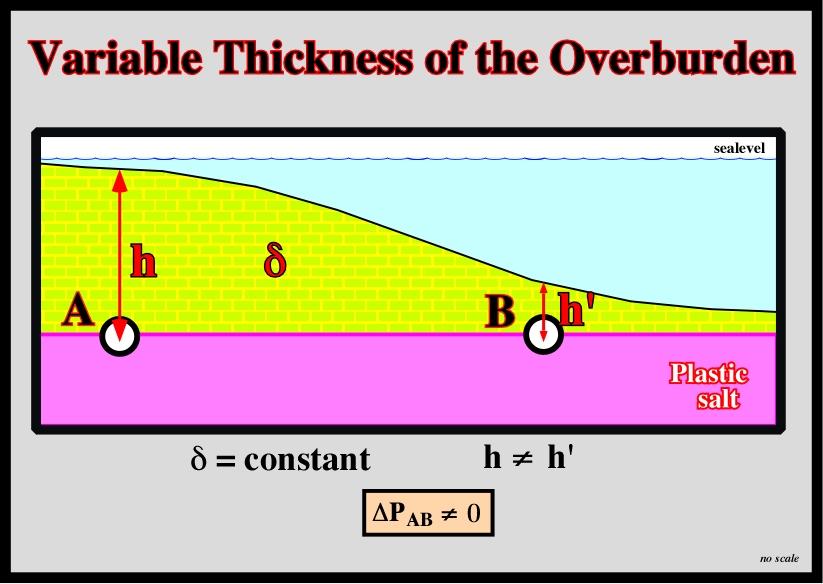
Fig. 43- Assuming a more or less constant density of the overburden, a progressive increasing of the water depth and a plastic salt layer, it is always possible find two point (A and B), not to distant, on the top of the salt or within the salt, with a different of pressure (?P) big enough to induce salt flowage from A (high pressure) to B (lower pressure). Similar salt displacement can be induced just by density variation (change of facies) in the overburden, as illustrated in figs. 45 and 46.
Fig. 44- In the Gulf of Mexico, as illustrated on this tentative interpretation, the differential loading of the overburden (yellow interval), partially, caused the salt layer to flow down-dip, where the geostatic and confining pressure are progressively smaller, because the the water depth increases. Notice that the growth faults are contemporaneous of the of the sedimentation, which is coeval of the salt movements. In fact, the configuration of the hanging-wall seismic reflectors is divergent toward the fault. Minor antithetic accommodation faults are, locally. developed to solve volume problems induced by the lengthening of the overburden.
2.5.3- Change of Density of the Overburden
A lateral density or facies change in the overburden can, also, induce salt flowage. In the South Atlantic margins, during the initial stage of the sea floor spreading, shelf-carbonates and slope shales composed the overburden. Therefore, and independently of the water depth, the change in facies between the shelf and slope environments is a major factor to create a down-dip salt flowage (fig. 45).
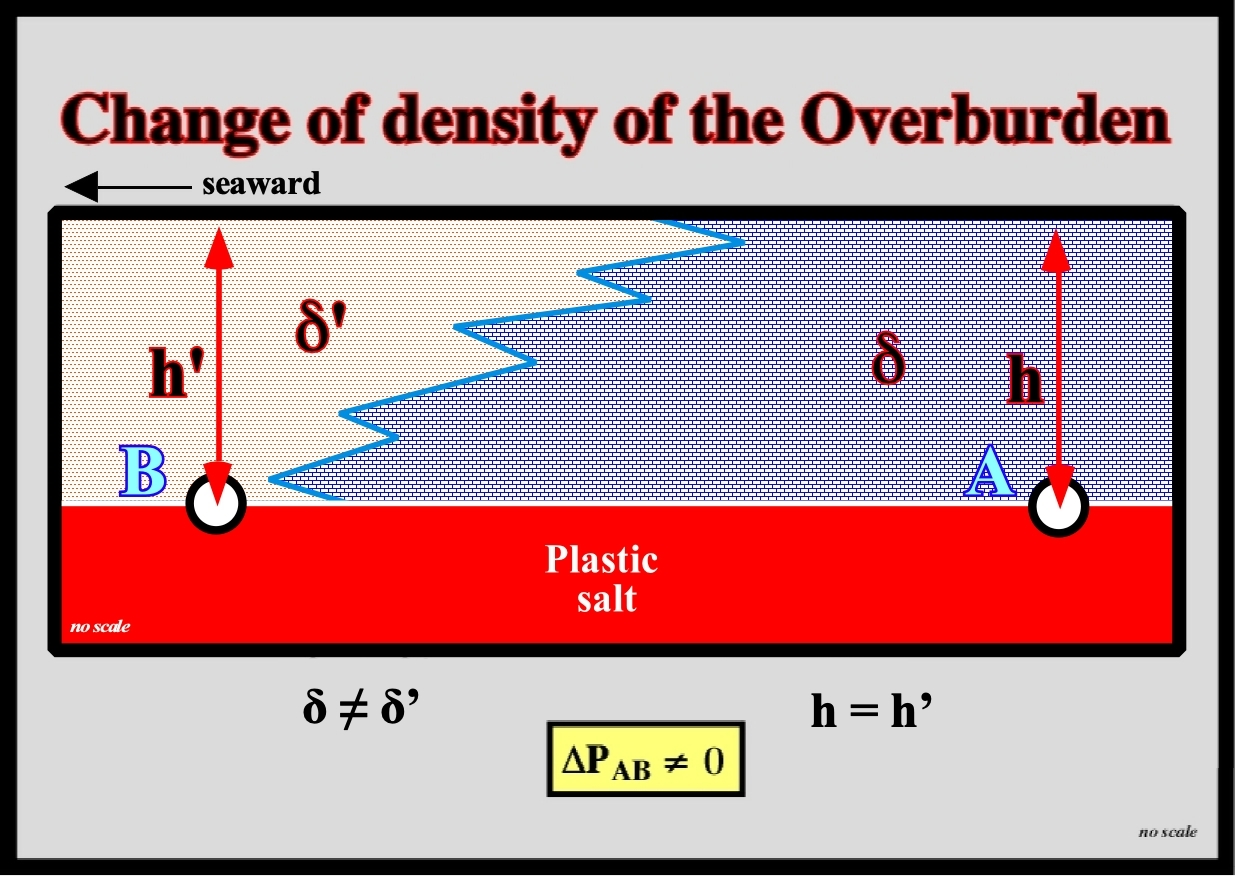
Fig. 45- Above an isopach plastic salt layer, there is a facies change in the overburden. The shelf carbonates (A) change, laterally and seaward, into slope shales (B). Independent of a possible seaward increase of water depth, in absence of a significant tectonic stress, such a lateral facies (limestone-shales) in the overburden can oblige the plastic salt interval to flow in direction of the shale facies (seaward) where the geostatic pressure is smaller.
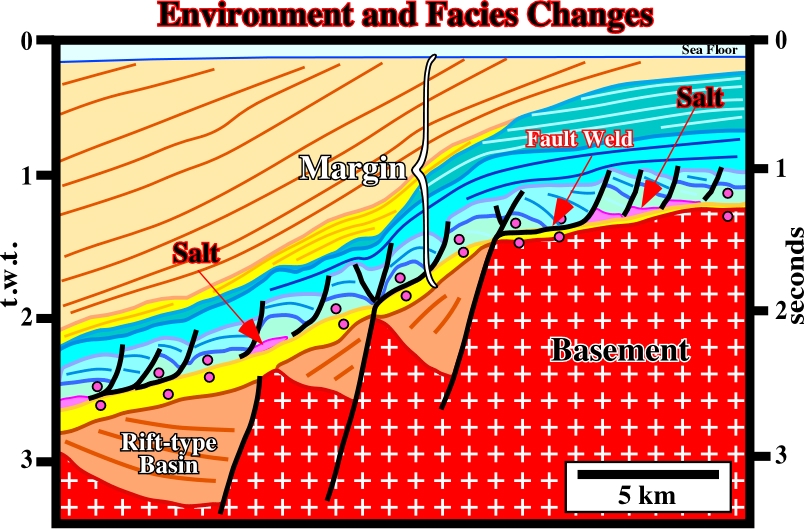
Fig. 46- In the offshore Angola, the seaward environment and facies changes had an important influence on the salt tectonics. In fact, as illustrated on this tentative interpretation of a seismic line of this offshore , during the transgressive phase of the Post-Pangea continental encroachment cycle (Atlantic-type divergent margin), the backstepping geometry forced the majority of the salt layer to flow seaward (down-dip). At the present time, only a few salt rollers can be recognized in the foot-wall growth faults induced by the salt flowage. However, at deposition time, the salt thickness was at least of 200-300 milliseconds. Salt roller are low-amplitude, asymmetric salt structures comprising two flanks: a longer, gently dipping flank in conformable stratigraphic contact with the overburden and a shorter, more-steeply dipping flank in normal-faulted contact with the overburden. Salt rollers are an unequivocal sign of regional thin-skinned extension perpendicular to the strike of the salt rollers.
In spite of the fact that the overburden is often composed by compacted strata (carbonate or sandstone), it must be noted that such rocks are, readily, fractured by traction (see table IV). Compressive and tensile strength of the overburden must be taken into account to better understand the associated salt structures.
(Table IV)
Rock………………….………..Compressive Strength……………..……..Tensile Strength
Basalt 3100/3200 kgf/cm2 200 kgf/cm2
Sandstone 500/600 kgf/cm2 20/30 kgf/cm2
Limestone 200/300 kgf/cm2 15/20 kgf/cm2
Dolomite 800 kgf/cm2 20 kgf/cm2
When a limestone or a dolomite caps a salt layer, it can, easily, be broken under traction (20/30 kgf/cm2). In fact, a small positive anomaly on the top of the salt, induced by a tilting of the basin (fig. 48), can break the calcareous overburden as illustrated on fig. 47. Physically speaking, a tectonic tilting of the salt, as illustrated in fig. 47, is equivalent to a thickness variation of the pre-tilting overburden.
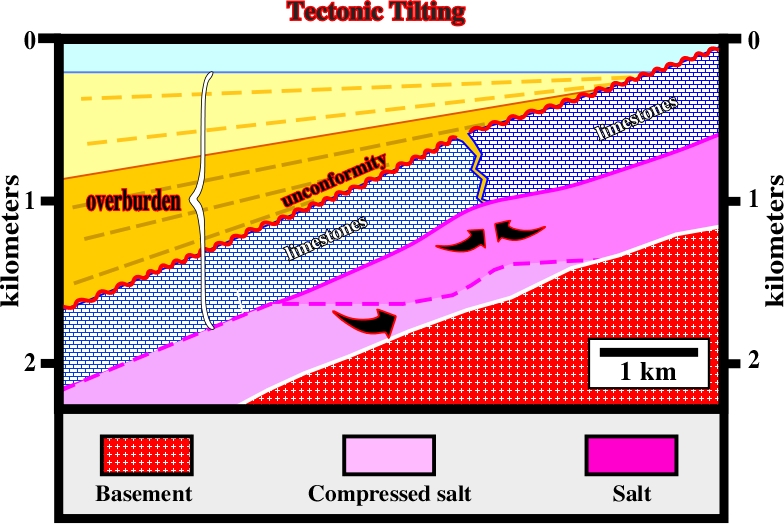
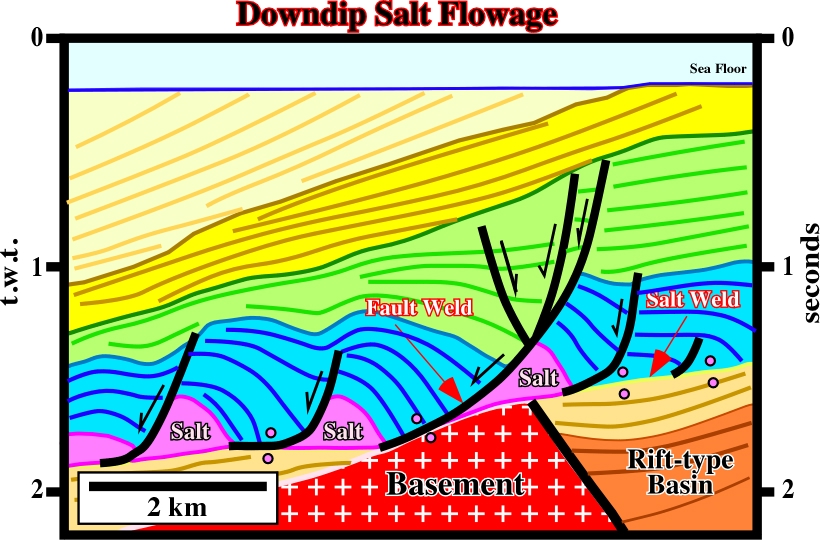
When the top of the salt layer has a tectonic dip, the salt moves in a direction, which depends on the average density of the overburden:
(i) Overburden less dense than the salt
When the average density of the overburden is lesser than that of the salt, the salt moves down-dip (fig. 48).
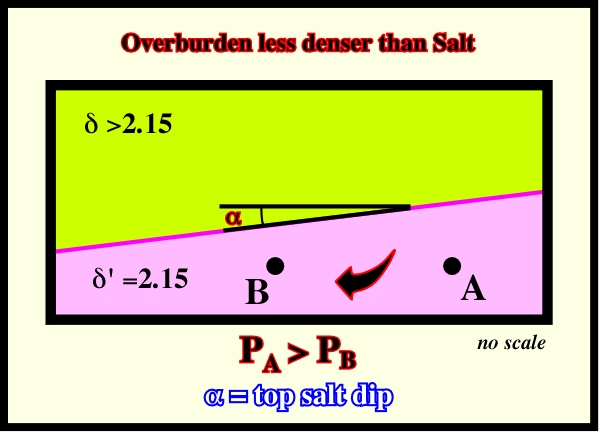
Fig. 48- If the top of the salt layer dips seaward (left on this sketch) and the overburden is less dense than the salt, that is to say, lower 2.15, the salt moves down-dip, since along the AB isobath, the geostatic pressure (σg) at A (landward) is higher (compressed salt) that geostatic pressure at B (seaward).
Fig. 49- The down-dip salt flowage, recognized on the Angola offshore seismic line of this tentative interpretation, is mainly due to the early seaward tilting of the margin and to the fact the overburden is, in average, less dense than the salt. In addition, as shown previously (fig. 45), probably, the environment and facies changes have also contributed to the seaward salt movement, which created, locally, significant compensatory subsidence. On this subject take into account not only the thickness variation in blue interval, but the divergent internal configuration of the seismic reflectors as well. The obvious truncation at the bottom of the sea highlights the late Tertiary uplift of the margin, which, strongly, enhanced the tilting at the time of deposition of the blue interval.
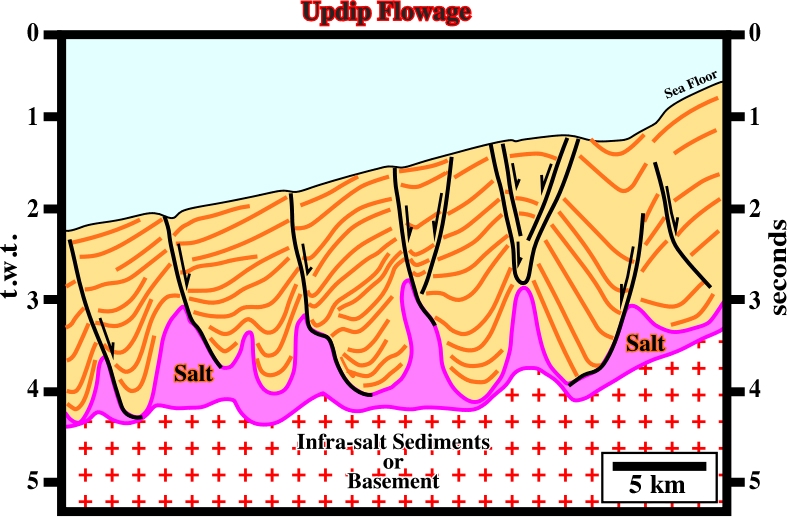
(ii) Overburden denser than the salt
When the average density of the overburden is greater than the density of the salt, the salt moves up-dip (fig. 50). For an overburden thicker than 1000/1500 m, the average density is higher than 2.15 (salt density), thereby the salt tends to flow up-dip. Nevertheless, as generally, salt movements are initiated under much less thick overburden, the salts flows down-dip.
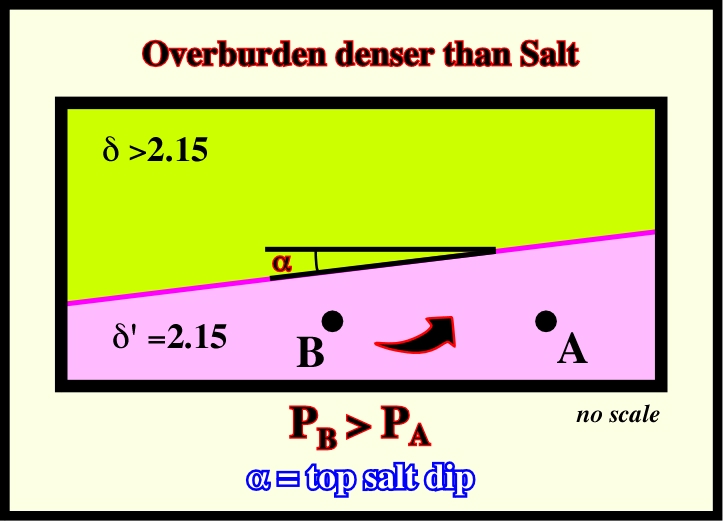
Fig. 51- On this tentative geological interpretation of an Angola offshore seismic line, the landward dipping faults suggest a local up-dip movement of the salt layer. In such hypothesis, the lower section of the overburden must be denser than the salt i.e., a limestone facies is likely. On the other hand, the divergent internal configuration of the lower part of the overburden implies that it is coeval with the salt flowage. These conjectures can be falsified by a depth conversion of the salt induced tectonic disharmony. In fact, the seaward tilting of the tectonic disharmony is just a seismic pitfall. Correcting the water depth, the tectonic disharmony (bottom of the salt) dips landward and, probably, the top of the salt too. In other words, this tentative interpretation does not corroborate the conjecture that the salt flows up-dip when the density of the overburden is higher than the salt density.
Fig. 52- In spite of the fact that the growth faults, recognized on this tentative interpretation of a seismic line of Brazil offshore, dip landward, the salt seems to flow up-dip, i.e., seaward. Do not forget this tentative interpretation is in time. Obviously, in a depth converted line, the salt induced disharmony (bottom of the salt, dips. In reality the sedimentary loading obliged the salt to move seaward, that is to say, up-dip, creating successive salt ridges, which favour the development of depocenters thinning landward. Notice the growth faults limiting landward the salt ridges and the amplitude of the welding on the left part of the line. Taking into account the distal sector of the salt induced tectonic disharmony of the majority of the Atlantic-type divergent margin dips landward, you avoid big mistakes, particularly, in petroleum exploration.
to continue press
next
![]()