Part I- Basic Principles in Salt Tectonics
Contents:
3.1- Salt Anomalies
3.2- Formation and Evolution of a Salt Dome
3.3- Withdrawal of the Dome’s Flanks
3.4- Vertical Pressure Within and Outside a Dome
3.5- Vertical Pressure Dome versus Overburden
3.6- Intrusive and Extrusive Salt Dome
3.7- Geological Model of a Salt Dome (Without Extension)
3.8- Geological Model of a Salt Dome (With Extension)
3.9- Stretching Faults
3.9.1- Currie’s Model
3.10- Dome Perturbation’s Wavelength
3.10.1- Domes’ Wavelength
3.10.2- Exploration Implications
3.11- Autochthonous and Allochthonous salt
3.11.1- Goguel’s Experiment
3.11.2- Jackson’s Experiment
3.11.3- Kavir Diapir Province
3.11.4- Allochthonous Salt
(i) Salt Sheet
(ii) Salt Laccolith
(iii) Salt Sill
(iv) Salt Tongue
(vi) Third-Cycle Diapir
(vii) SaltCanopy
(viii) Salt-Stock Canopy
(ix) Salt-Wall Canopy
(xi) Salt Suture
(xii) Salt Glacier
3.11.5- Allochthonous salt and Extension
3.11.6- Salt Intrusion Mechanisms
3.11.7- Basinward Evolution of Allochthonous Salt
3.11.8- Allochthonous Salt in Gulf of Mexico
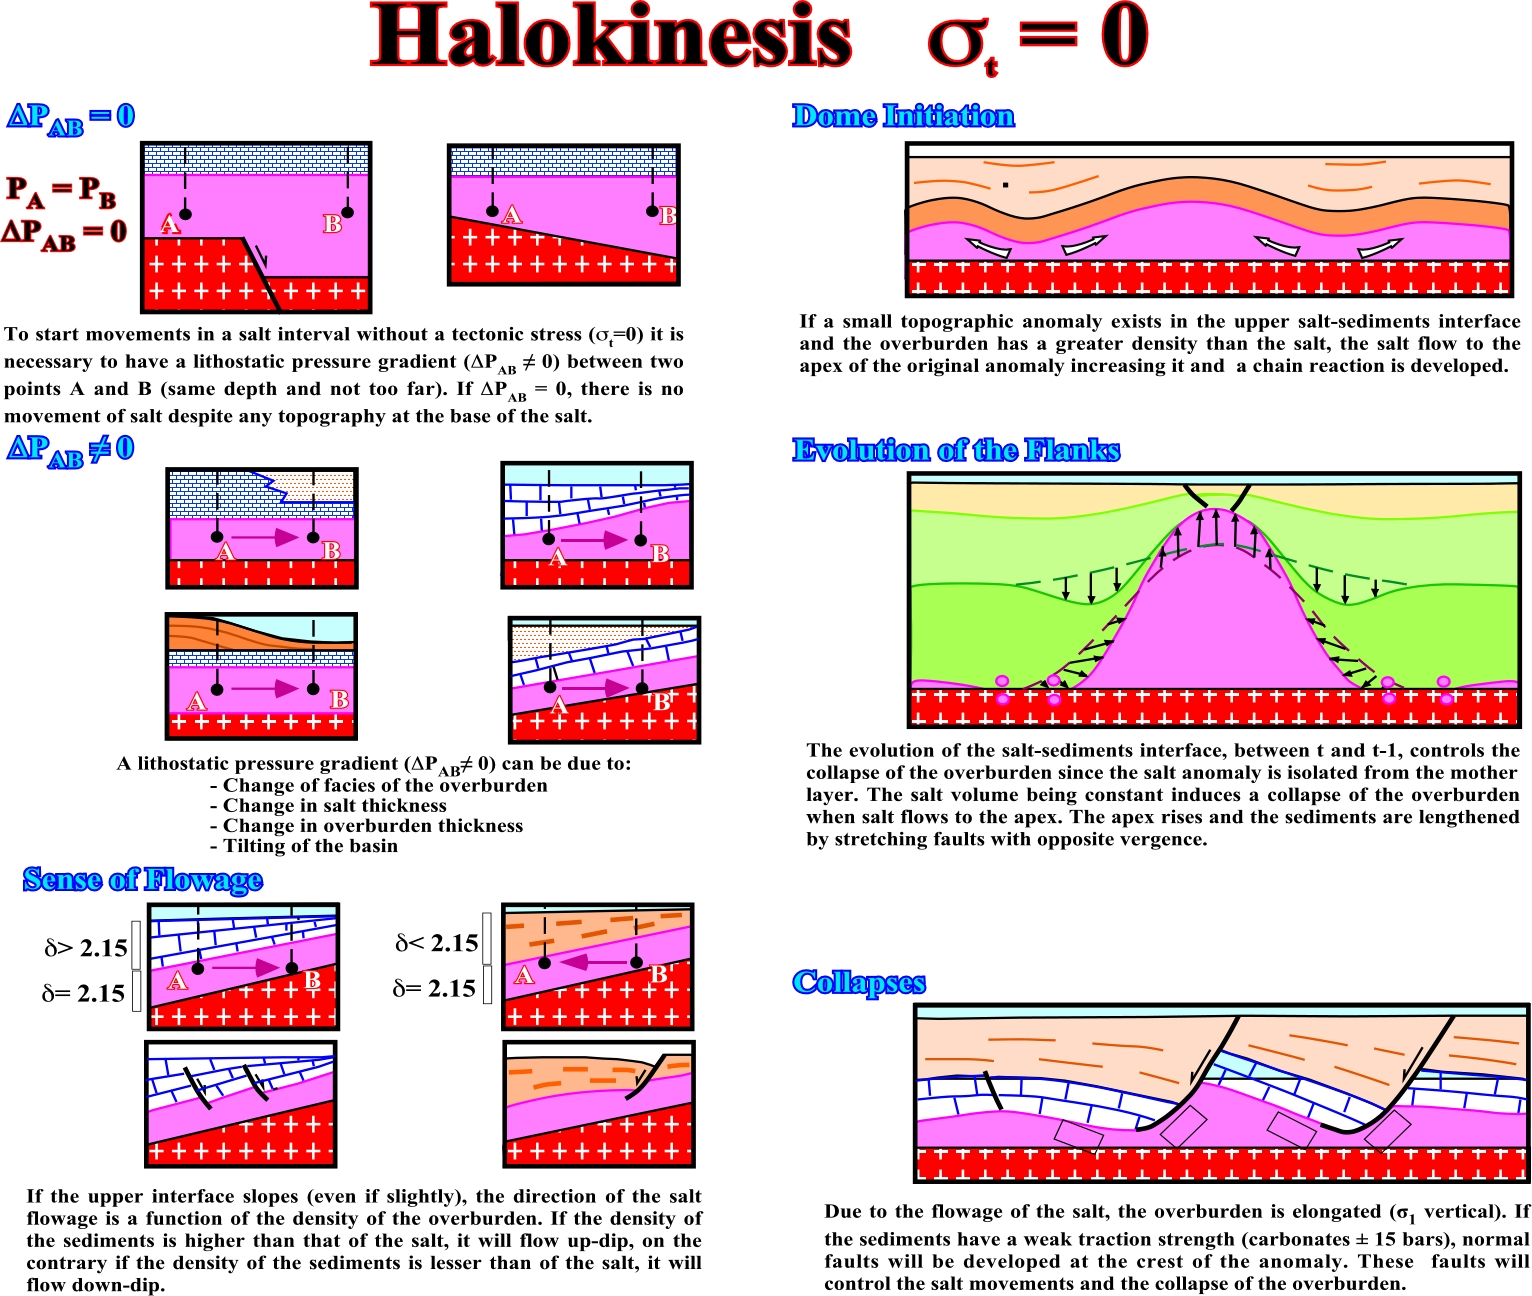
Whenever a small anomaly exists at the top of the salt (a mound, for instance) with an overburden is relatively thick, the salt flows simultaneous up from the flanks toward the crest of the anomaly forming a small dome. Irregularities in the salt-overburden interface produce divergent slopes on the surface of the salt, which creates an anomaly, which will be formed by chain reaction and the mechanism remains the same even if the irregularities are of small amplitude. Actually, the smaller they are the longer it takes for domes to develop (fig. 53).
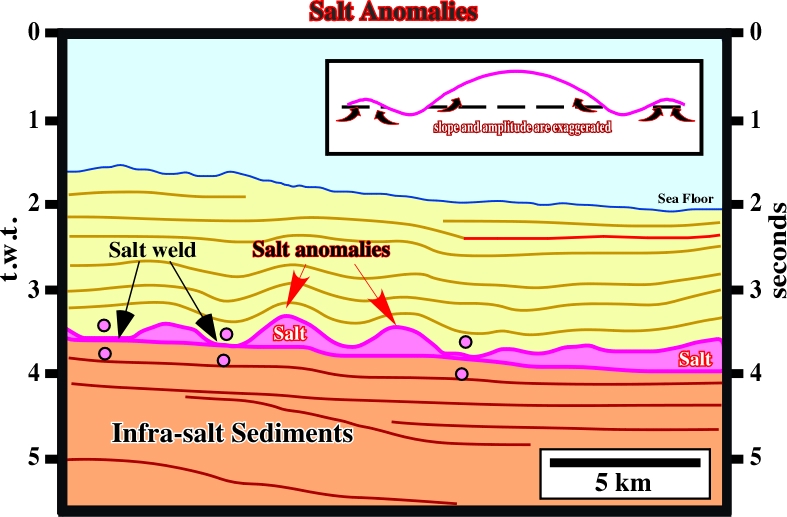
Fig. 53- On the left part of this tentative interpretation of a Mediterranean seismic line, Messinian salt anomalies (undulations) are easily recognized. They have a more or less similar amplitude, which seems to be big enough to break, by traction, the bottom of the overburden, particularly when its facies is compact sandstones or carbonates.
3.2- Formation and Evolution of a Salt Dome
If the sedimentary section deposited between and above the salt anomalies (see 3.1) is thick enough, the average density of the sediments forming the overburden may becomes greater that the salt density (± 2.15-2.17). The weight of the overburden forces the salt to migrate towards the top of the anomalies because the thickness of the overburden decreases from the flanks towards the top. The force, obliging the salt to migrate upward, decreases from the flanks to the top. In addition, the thicker the overburden, the denser it is and the greater is the force obliging the salt to migrate. The force acting upon the salt is greater at the deepest part of the salt-overburden interface. Therefore, it is logical that the maximum sinking of the sediments takes place on the dome’s flanks where the salt has been evacuated (fig. 54).
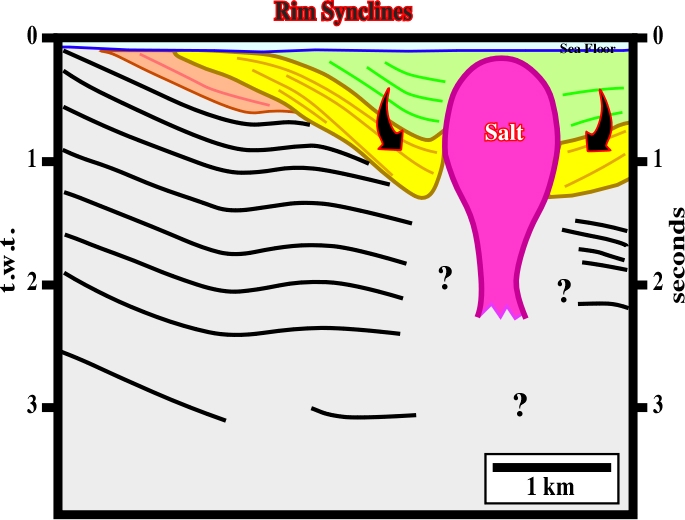
Fig. 54- On this tentative interpretation of a Gabon offshore seismic line, the rim synclines, recognized on each side of the salt dome, are the result of a compensatory subsidence induced by salt flowage from the flanks of the dome toward the top. If such hypothesis is correct, the picking of the domes’ flanks cannot be made by an inductive interpretation approach, as illustrated, but only by a rational hypothetical-deductive approach. R. Descartes and F. Bacon represent two forms of reasoning: deduction and induction. Deduction is the method used to show that one theory follows from another. Induction is the method of inferring a general rule from few cases)(see fig. 55).
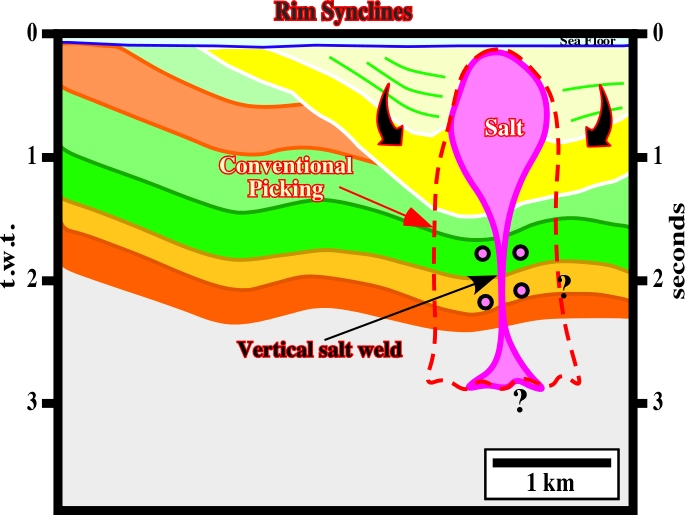
Fig. 55- This tentative geological interpretation of the previous Gabon offshore seismic line (fig. 54) was made using the rational hypothetical-deductive approach initially proposed by R. Descartes. The geoscientist in charge of the interpretation took into account that a salt structure with vertical flanks is a physical impossibility: the salt is interpreted as a detached salt stock structure, i.e., a salt drop detached from the mother layer by a vertical salt weld. Conventional inductive interpretations are easily be refuted just by common sense, as illustrated next (fig. 58).
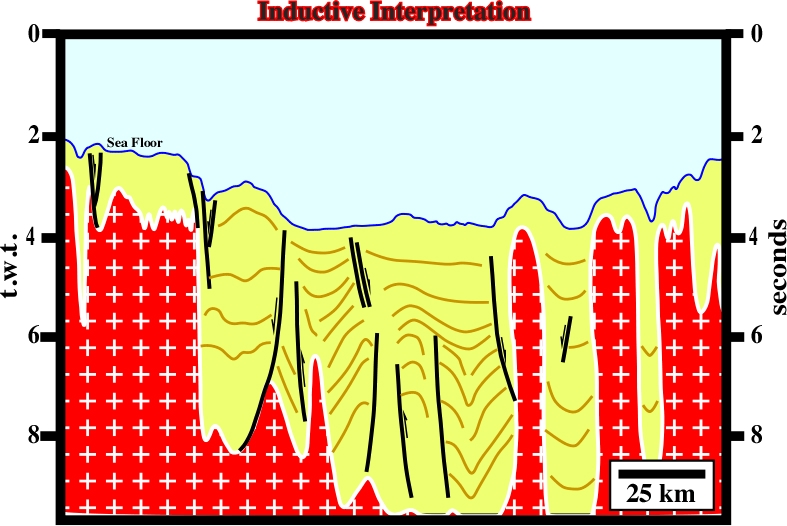
Fig. 56- The proposed inductive interpretation of the salt picking can easily be refuted by common sense. As a seismic line is a time section and the seismic waves travel through the salt at 4-5 km/s and through the overburden at 2-3 km/s, the proposed interpretation is unlikely, since it gives, in depth, the thickness of the salt domes that is, is least twice the total thickness of the basin, what is a physical impossibility. Take into account that, generally, geoscientists pick always to much salt, particularly in diapiric structures. Do not forget the inversion point (fig. 27a).
3.3- Withdrawal of the Dome’s Flanks
The sketches illustrated in fig. 57 and 58, depict the withdrawal of the flanks of a salt dome.
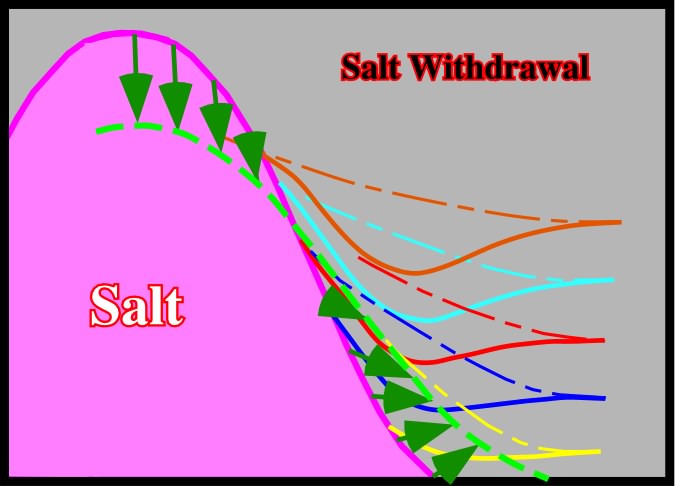
Fig. 57- Taking the initial limit of the top salt as the dotted green marker, it is easy to recognize that the flanks of the dome withdrawal as the apex of the dome is uplifted. Such a transfer of salt increases, locally, the space available for sediments (accommodation) and created local depocenters, as depicted by the collapse of the other coloured markers. The depocenters or rim synclines, i.e., the syn-kinematic synform located around the salt domes , will be, progressively, displaced toward the flanks of the dome as sketched on next figure (fig. 58).
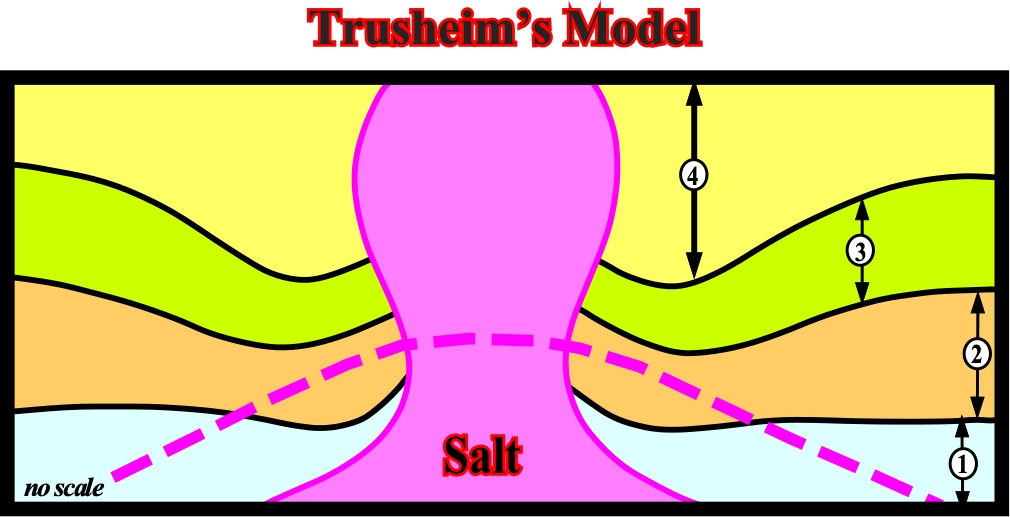
Fig. 58- In Trusheim’s salt dome model, the successive lateral withdrawal of the flanks of the former salt intumescence (mound), which is underlined by the dashed violet line, can be recognized by the inward displacement of the depocenters, located each side of the salt dome. The depocenters are induced by the compensatory subsidence, created by the salt flowage, as depicted previously (fig. 57). In fact the flowage of a salt layer induces a local increasing of the available space for sediments (accommodation) independently of eustasy and tectonic subsidence. Recalling:(i) the eustasy is he worldwide sea-level regime and its fluctuation, caused by absolute changes in the quantity of seawater (glacio-eustasy) or volume of the oceanic basins. The definition of Eustasy more difficult to falsify is: "Vertical sea level changes regardless their causes (A. Mörner, 1977), ; (ii) the tectonic subsidence is the subsidence of the basement, which contrasts with the compensatory subsidence, in which the basement stays inactive.
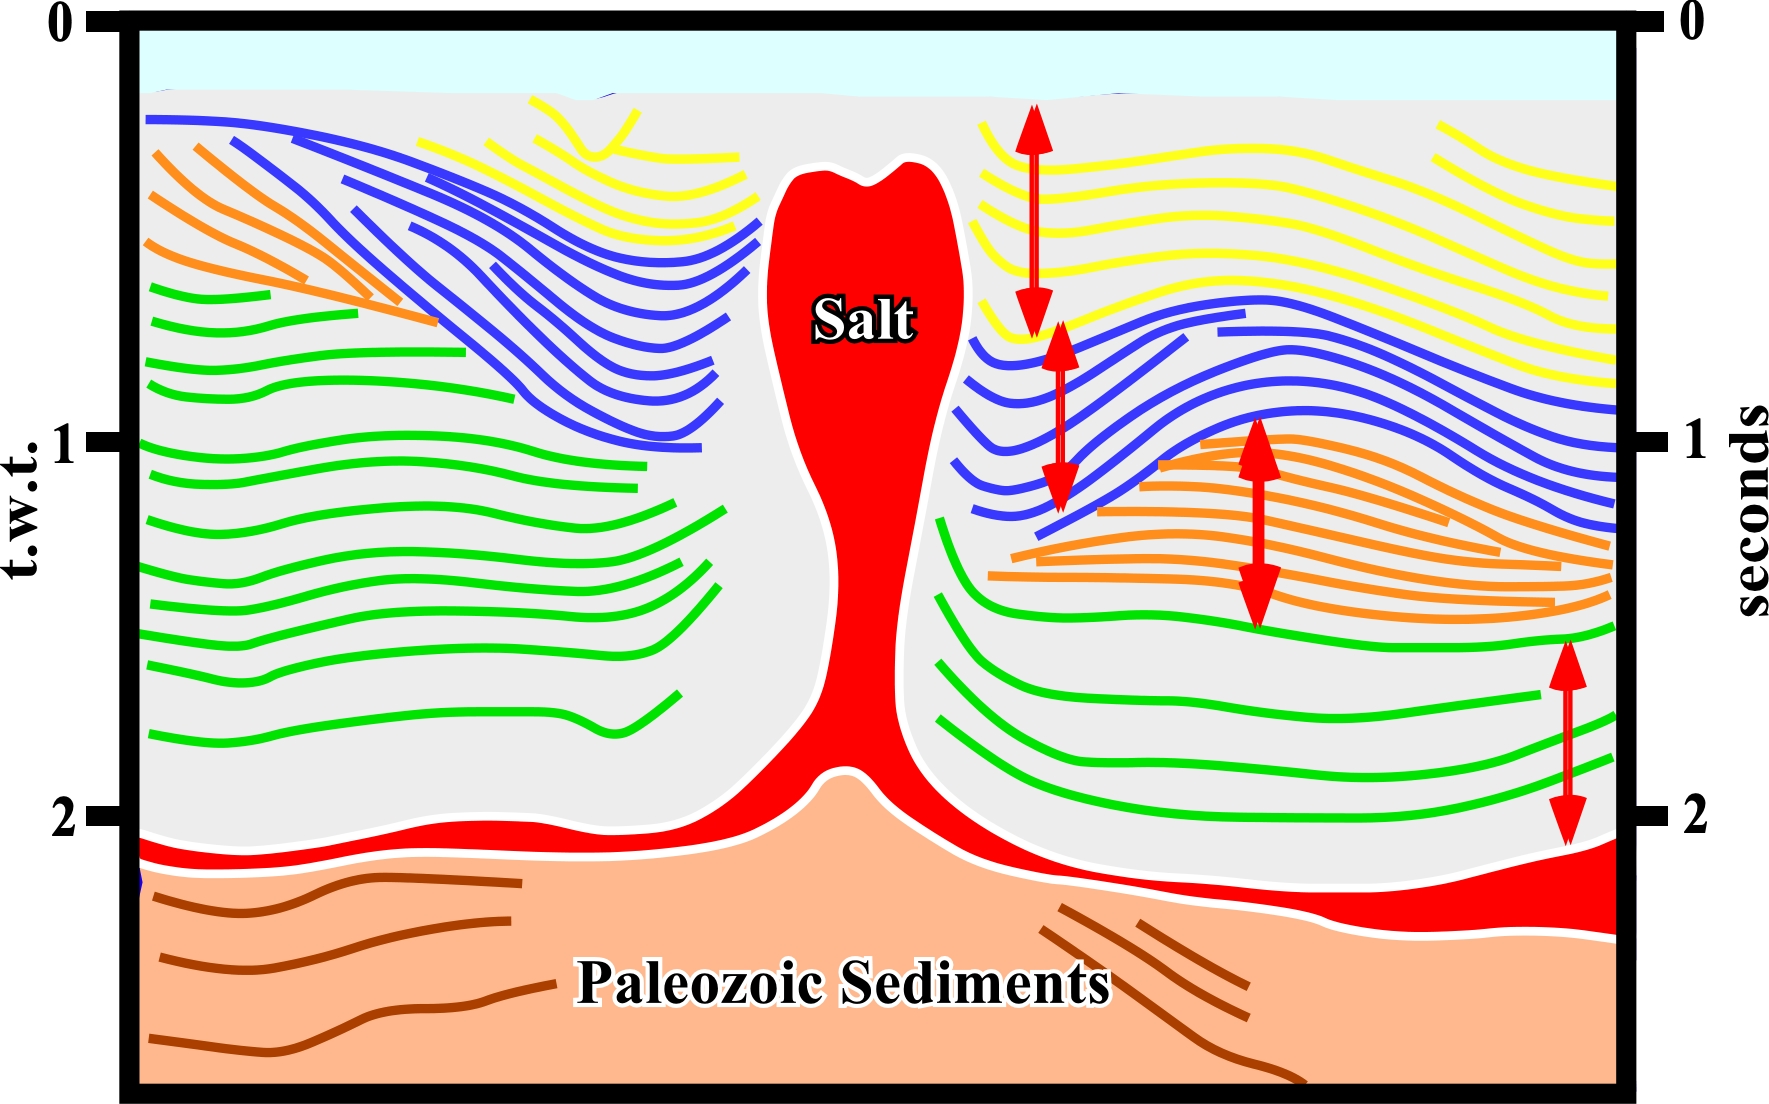
Fig. 59- The final result of the withdrawal of flanks of a pristine salt mound and the coeval vertical salt flowage to form a dome are depicted on this preparative tentative geological interpretation of a manual autotrace of a North Sea seismic line. The lateral displacement of the successive depocenters (red arrows) is, easily, recognized, in spite of the erosional surfaces between them. The asymmetry of the depocenters suggests a different evolution of the flanks of the former salt anomaly. The reflection free area below top of the dome requires a hypothetical-deductive approach (Theory precedes Observation). Indeed, in Geology there are not uninterpreted observations. All seismic interpretations are theory impregnated.
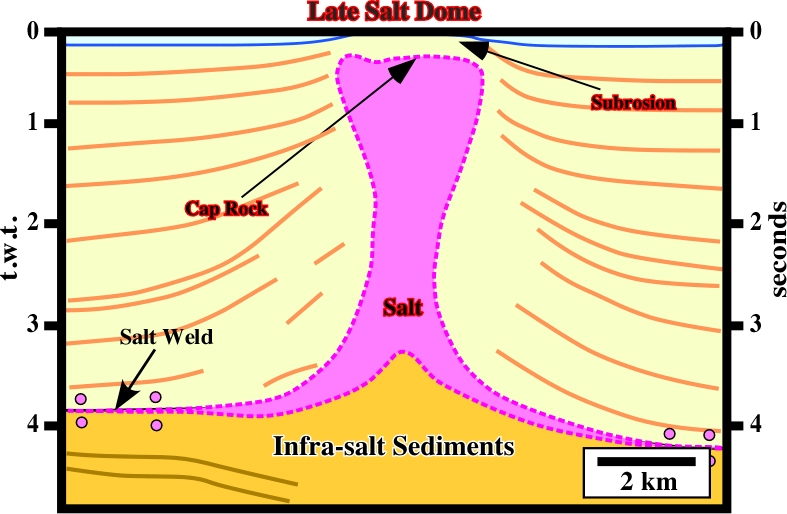
Fig. 61- This hypothetical-deductive tentative interpretation of a manual autotrace of a seismic line of the Gulf of Mexico illustrates that not all salt domes (salt limits presumable) are associated with the development of lateral depocenters (rim synclines). On this particular example, the upward salt movement is, mainly, post-depositional. The sedimentary packages, overlying the mother layer (probable a salt nappe, i.e., allochthonous salt ), were deformed by a late upward salt movement. In such hypothesis the interpreted salt weld is a tertiary salt weld, i.e., joining strata originally separated by gently dipping allochthonous salt sheet. On the top of the salt, subrosion (washing of roof of the dome, which is not outcropping but covered by a relative thin and permeable sedimentary interval ) has been quite important. The sub-horizontal geometry of the limit between the cap rock and the salt is quite evident, as well as the positive anomaly of the sea floor at the vertical of the dome.
Table IV
3.4- Vertical Pressure (PV) Within and Outside a Dome
In the overburden, the geostatic pressure increases with the depth and with the average density of the sedimentary layers, as illustrated in fig. 62. Taking into account the wildcats (exploration wells) as reference, the geostatic pressures (in blue and red) show, in depth three sharp breaks. They are associated with the stratigraphic boundaries, the deeper associated with the interface between overburden or cap rock and the salt ( autochthonous or allochthonous).
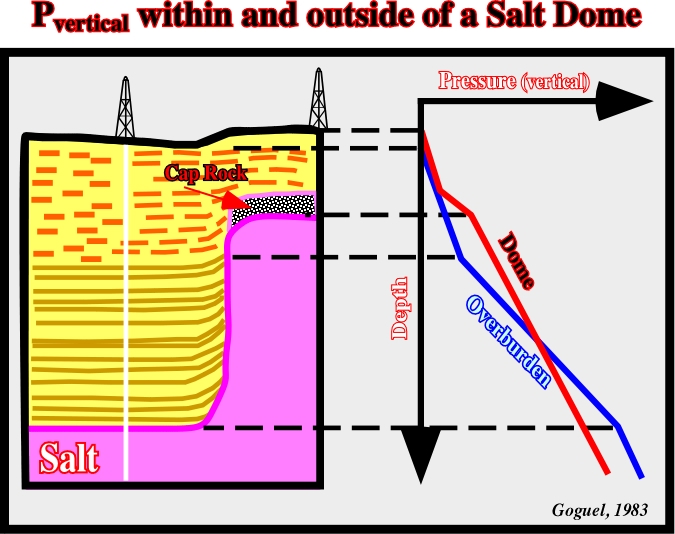
Fig. 62- In spite of the fact that the vertical geometry of the illustrated flank of the salt dome, which is very unlikely, this figure can be used to illustrated the depth evolution of the vertical pressure in two wildcats. The left wildcat, located outside of the apex of the salt dome, recognized, mainly, the overburden and the autochthonous salt, i.e., the salt resting in the original strata on which it accumulated (tit is in its stratigraphic position). The other wildcat, located on a topographic anomaly, induced by the upward salt movement, recognize the uppermost part of the overburden, the cap rock resulting, probably, from the accumulation of the less soluble minerals of the salt body during leaching in the course of its ascent, the allochthonous salt and the mother source rock, i.e., the autochthonous salt. In the first well the vertical pressure profile (in blue) shows to significant breaks, the upper is associated to a composition change in the rocks composing the overburden, and the slower one at the interface overburden-autochthonous salt. In the well, the vertical pressure profile (in red) shows, also, two breaks, but the upper one is associated with the interface overburden-cap rock and the lower one with the interface cap rock-allochthonous salt. There is no break associated with the interface allochthonous-autochthonous salt, since the salt density does not changes with depth (the compaction of the salt is meaningless).
The geostatic pressure calculated along the well through the salt dome, is illustrated in red on fig. 62. As depicted, two sharp breaks are visible. The first is associated with the cap rock. The second corresponds to salt. In the salt, the geostatic pressure keeps a constant slope, since the density of the salt does change with depth. The two profiles of the geostatic pressure (blue and red), illustrated on fig. 62, define an inversion point. Above this point, the density of the salt is higher than the average density of the overburden. Below the inversion point, the density of the sediments is higher than the salt. In other words, one can say:
(i) Above the inversion point, the lateral pressure the salt against the sediments is not balanced by the lateral pressure the sediments against the salt.
(ii) Below the inversion point, the lateral pressure that the sediments against the salt is not balanced by the lateral pressure that the sediments against the salt.
Additionally, one can say, a salt dome with vertical flanks, as the one suggested on fig. 62, as stated previously, is unlikely. Such geometry represents a mechanical instability due to the presence of an inversion density point.
3.5- Vertical Pressure (PV) at bottom of a Dome and Overburden
δPAB = H (δ -δ’) - hδThe difference (?P) between the geostatic pressure of the overburden and that of a theoretical salt dome (δP) growing from an autochthonous mother layer, as illustrated in fig. 63, can be, easily, calculated using the following formula:
where:
a) δ is the average density of the overburden ;
b) δ’ is the density of the salt ;
c) H is the height of the salt dome ;
d) h is the height of the topographic anomaly induced by the salt dome.,
The difference of pressure ?P is one of the driving forces that forces the salt to flow toward the dome until it reaches a pseudo-equilibrium state with the overburden.
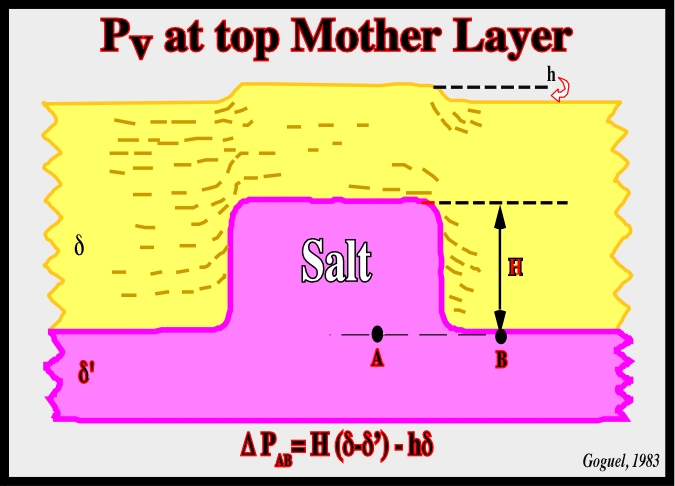
Fig. 63- Goguel (1983) calculated the vertical pressure at the bottom of a dome (A, top mother layer, i.e., of the autochthonous salt) and bottom of the overburden (B) and the
PAB=H(δ-δ’)-hδ. Theoretically, the topographic (or bathymetric) anomaly above the salt dome compensates the ?P between (A) and (B).
The following seismic examples corroborate the hypothesis that vertical flanks are unlikely, because they correspond to an unstable geological situation: (i) Above the inversion point, the salt flows laterally (toward the sediments), creating overhang structures, (ii) Below the inversion point, as the lateral pressure of the sediments is not balanced by the lateral pressure induced by the salt, the salt flows vertically. Such a flowage can disconnect the diapir from the underlying mother layer and create a salt drop structure, which requires also a contraction or collapse of the salt stem, i.e., a vertical salt welds, by pressure of the sediments and not just by vertical flow.
Fig. 66- Salt domes can also develop in association with allochthonous salt as illustrated on this tentative geological interpretation of a Gulf of Mexicoc seismic line. A salt small dome has been developed from an allochthonous salt layer. Normal-faults (stretching-faults) extending the overburden above the top of the diapir create a negative bathymetric anomaly on the sea floor. Taking into account such a negative bathymetric anomaly (lengthening) the late upward movemt of the salt still seems to be active.
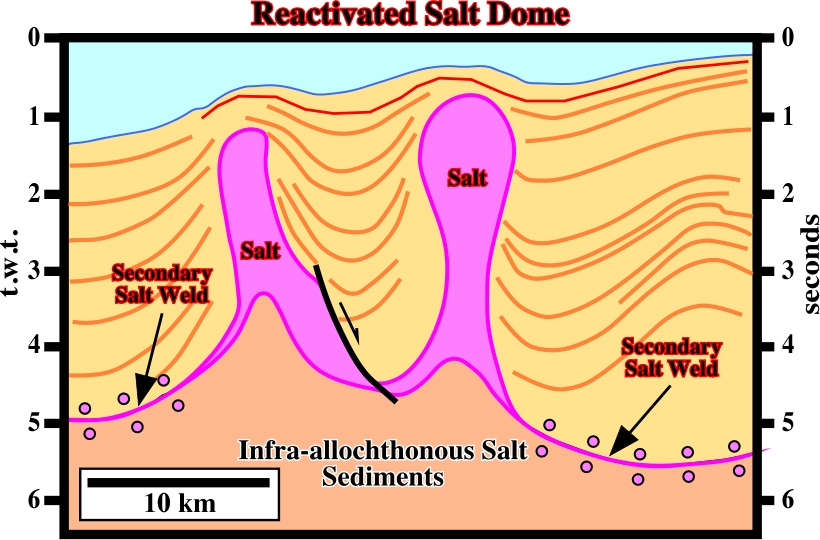
Fig. 67- On this tentative interpretation of a GOM seismic line, the salt domes are related with an allochthonous salt nape, which at present time is, mainly, represented by secondary salt welds. The rim synclines associated with the salt dome, located on the right part if the seismic line, suggests that this dome is, slightly, older that the other one. In fact, not only there is no evidence rim syncline or depocenter, on the left end of this seismic line, but the seismic reflectors are quite uplifted and probably shortened (squeezed).
3.6- Intrusive and Extrusive Salt Domes
Salt domes can be intrusive or extrusive (fig. 68). Intrusive salt domes never outcrop. They do not reach the surface (fig. 69). Extrusive salt domes reach the surface. They induce an apparent diapirism as sedimentation progresses (fig. 70).
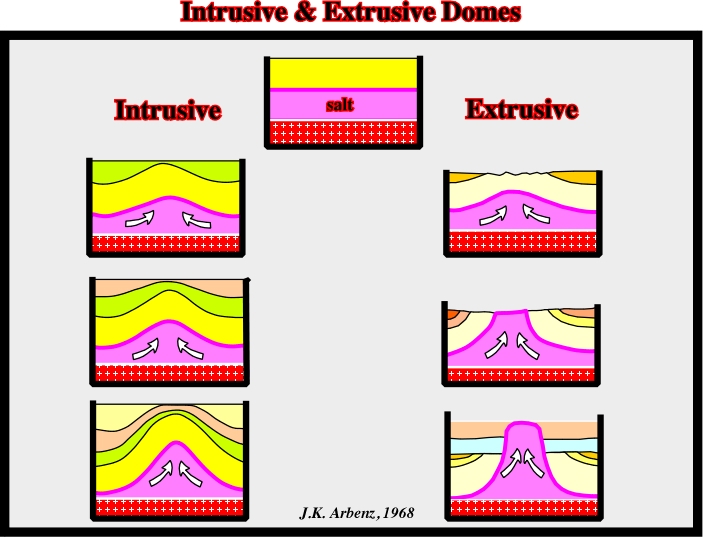
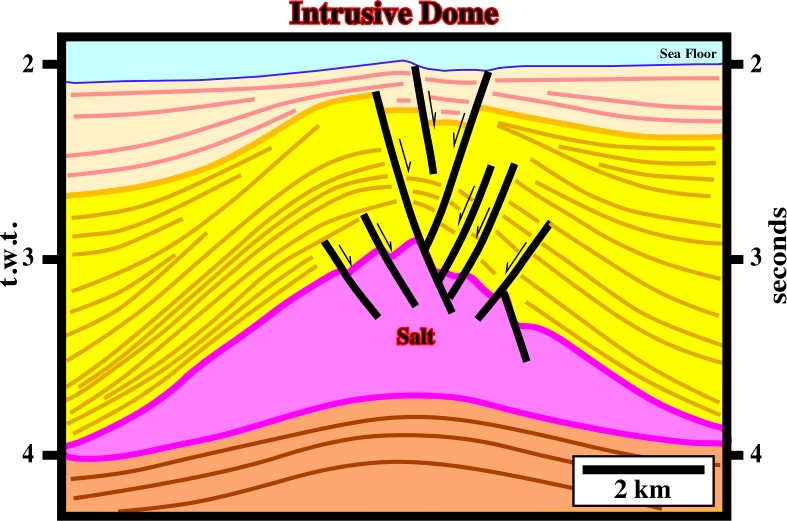
Fig. 69- On this tentative geological interpretation of a Gabon offshore seismic line, an intrusive salt dome is illustrated. The salt dome does not outcrop. It deforms all overburden strata. Stretching-faults, which accommodate the volume problem created by the lengthening of the overburden due to the upward movement of the salt, are visible in the of the top of the salt, as well as, in the apex of the overburden antiform, affecting, often the the sea floor.
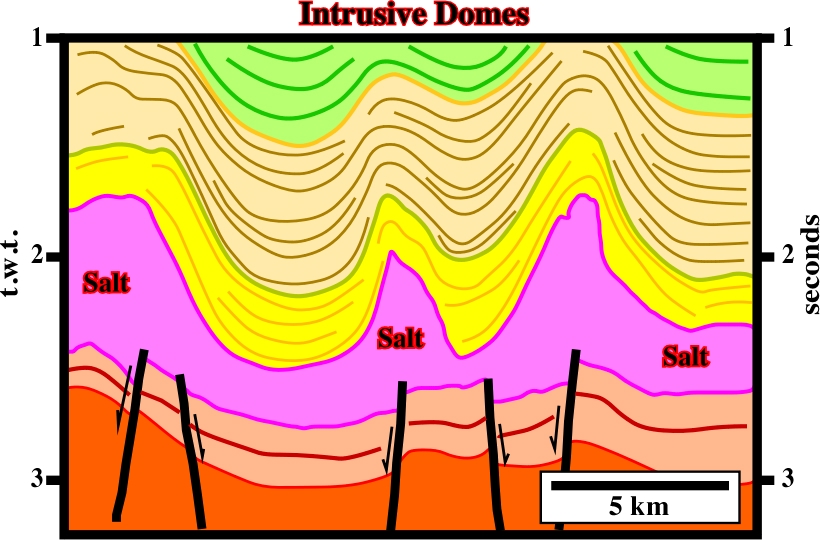
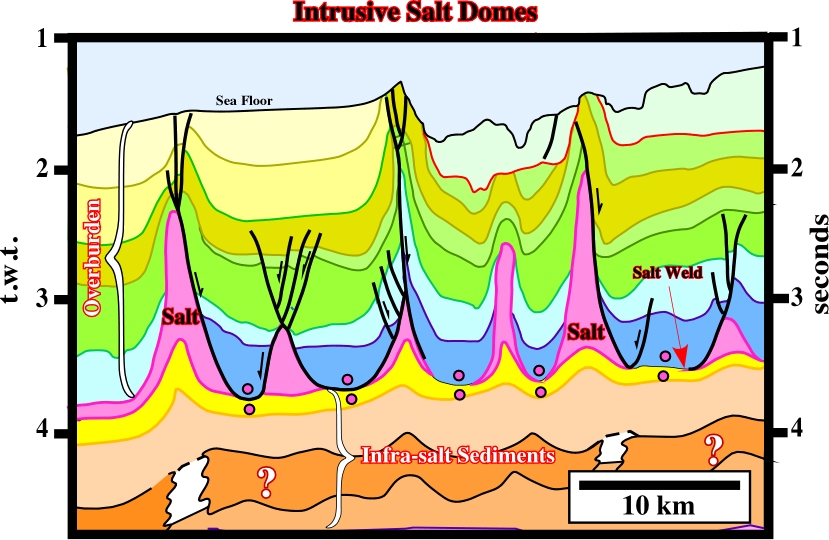
Fig. 71- On this tentative interpretation (Angola offshore), the tectonic disharmony between the infra-salt strata and the cover (salt + overburden), strongly, suggests that halokinesis is dominant, since the distance between the salt structures is, more or less, constant (see later). However, some of them seem to be extrusives and slightly squeezed (see next figures).
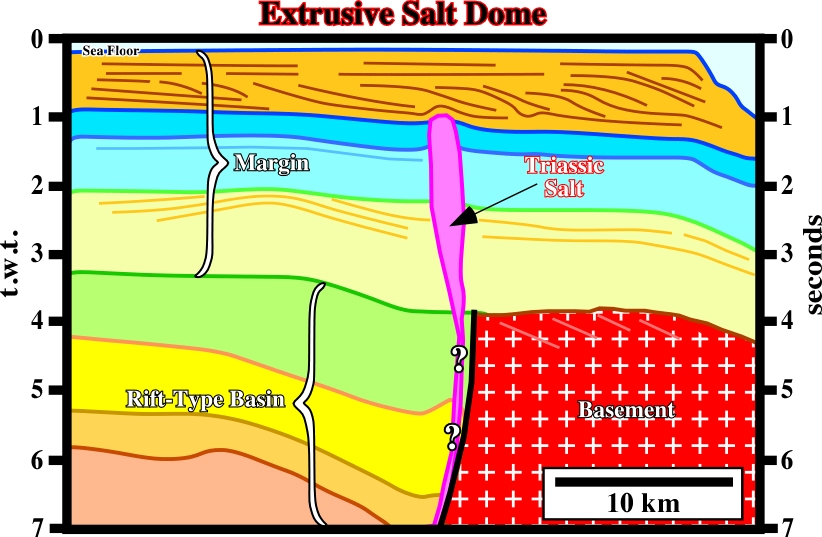
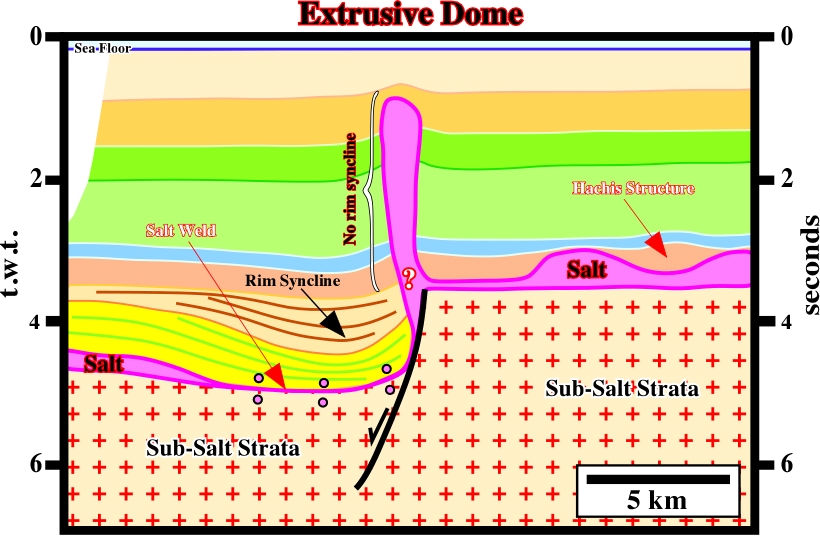
Fig. 73- On this tentative interpretation of a North Sea seismic line, the salt structure became and extrusive salt dome since the salt reached the surface, that is to say, since the fault movement responsible for the deposition of the hanging-wall syn-tectonic sediments stopped. In fact, there is any deformation in the upper overburden (above the rim syncline of t hanging-wall sediments). On the contrary, before reaching the surface, the salt created a compensatory subsidence, which induced the depocenter recognized on the left part of the line (yellow an orange intervals). The salt structures visible on the right part of the line will be explained later (haggis structures).
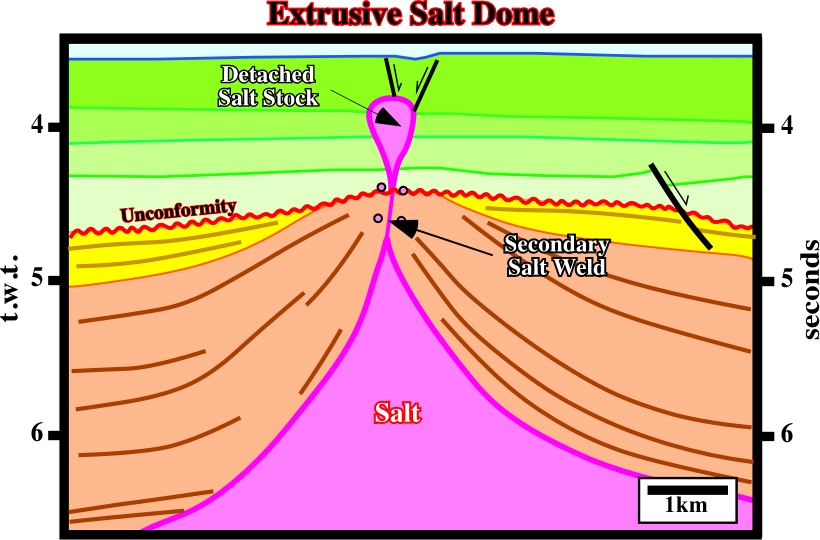
Fig. 74- An extrusive salt dome is, easily, recognized on this tentative interpretation of a Gulf of Mexico seismic line. In fact, in a first phase, the salt flowed upward, deforming the overburden (brown and yellow intervals) until it reached the surface (or bottom of the sea). As sedimentation progressed, the salt flew upward, without deforming the coeval sediments post unconformity . Later, a compressional tectonic regime squeezed the diapir disconnecting it from the mother salt layer. At present time, a secondary salt weld separates the mother layer from the detached salt stock, which is extending the surrounding sediments as suggest by stretching faults with opposite vergence.
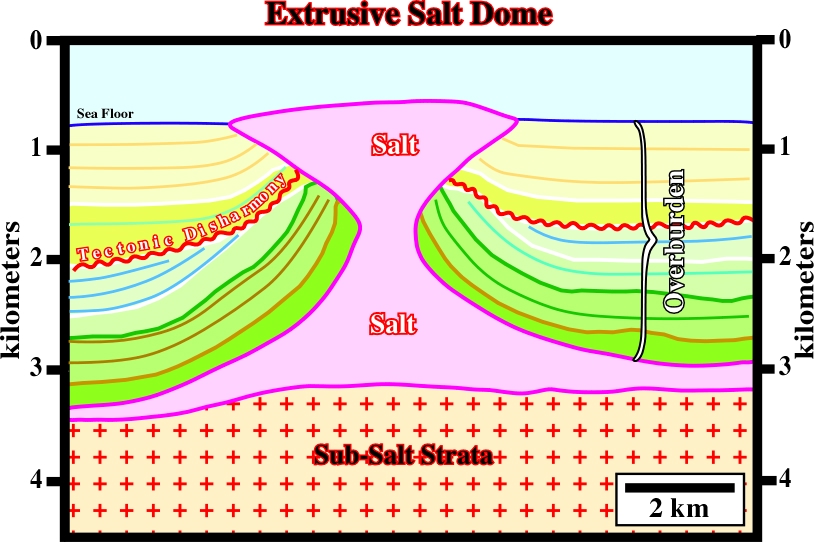
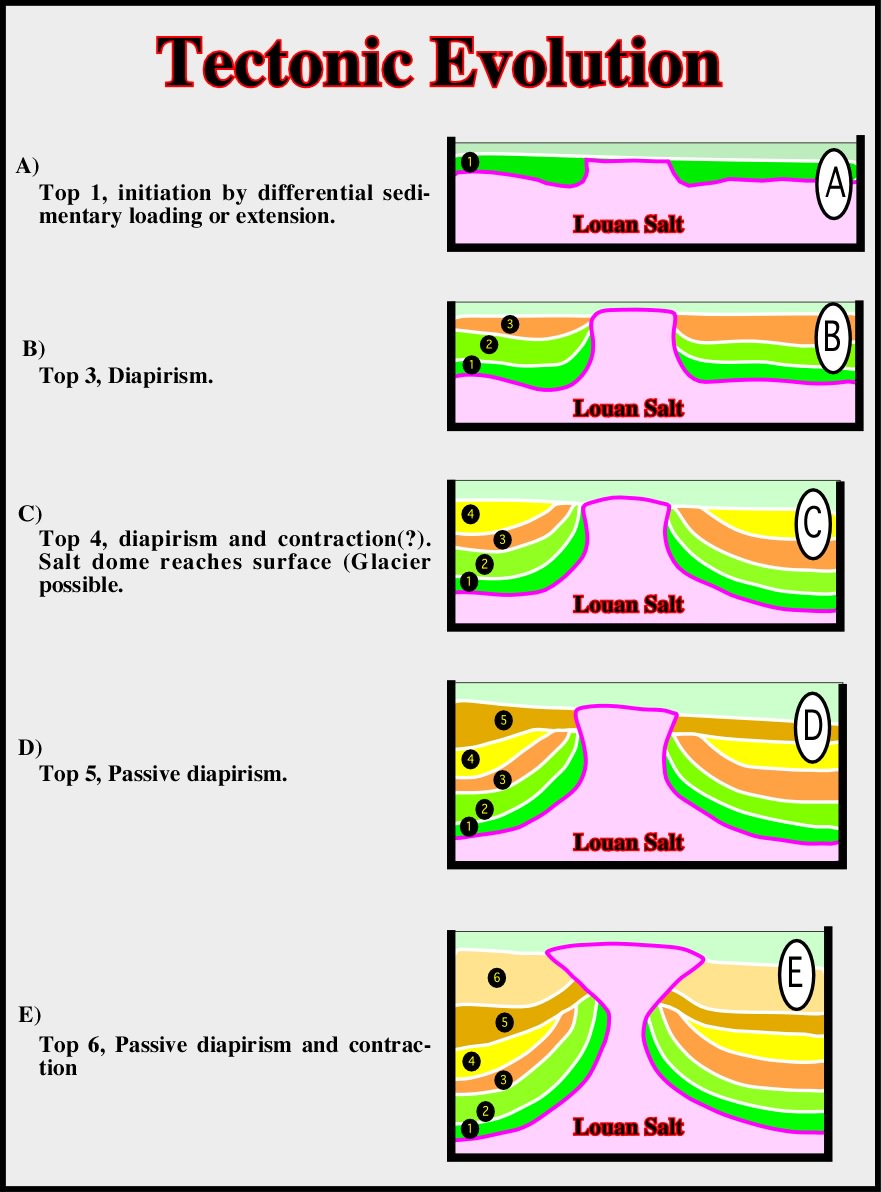
Fig. 76- The evolution of the extrusive salt structure illustrated on fig. 77, can be explained assuming an early passive or extrusive diapirism. The salt reached the sea floor since the onset of the overburden deposition. A first compressive tectonic regime exaggerated the overburden deformation creating an angular unconformity between the interval 4 and 5. A second compressive tectonic regime was responsible from the deformation of the angular unconformity and the formation a salt glacier (namakier), i.e., by the sheet-like extrusion of the salt issuing from the exposed extrusive diapir and its spreading beneath air or water.
to continue press
next
![]()